

Abstract
The purpose of this study was to analyse differences in rally length considering attack effectiveness, a players’ location and a game outcome in professional padel players. A total of 1527 rallies from 10 male matches of the 2013 Masters Finals of the World Padel Tour were registered through systematic observation. Data treatment included non-parametric mean comparisons (Mann-Withney and Kruskal-Wallis tests), and association analyses (crosstabs and Chi square analysis). In overall, 40% of unforced errors were made within the first 4 s of the rally, over 50% of points were scored between the 5th and 11th s, and 30% of forced errors occurred after the 11th –s of the rally. Hence, the ability to score in rallies of over 11 s duration and not making unforced errors within the first 4 s contributed to the rally outcome. More specifically, winners played longer rallies compared to losers (10.42 ± 7.77 s vs. 8.42 ± 6.43 s); particularly at the net, when scoring from the baseline (11.04 ± 7.64 s vs. 8.90 ± 5.41 s) and making forced (8.86 ± 7.44 s vs. 6.86 ± 6.24 s) and unforced errors (11.91 ± 9.47 s vs. 8.33 ± 6.92 s). Such knowledge may have implications in the design and structure of specific training programmes for padel players according to competition requirements.
Keywords: racket sports, match analysis, paddle-tennis, performance analysis
Introduction
Padel (also known as paddle tennis) is a doubles racket sport that uses tennis rules and a scoring system, although it is played inside an enclosed synthetic glass and metal court (10 x 20 m), allowing the use of side and back walls (International Padel Federation, 2008). Over the last few years, the popularity of padel has seen exponential growth becoming one of the most practiced sports in South America and Spain (García-Ferrando and Llopis, 2010), expanding rapidly around the world. Nonetheless, knowledge of specific-competition requirements and game dynamics in padel is still limited (Carrasco et al., 2011; Courel-Ibáñez et al., 2015). In modern racket sports such as padel, a better understanding of temporal structure and game performance is needed for playing and training according to specific performance indicators (Drust, 2010; Hughes and Bartlett, 2002; O’Donoghue, 2009). This information may assist coaches in designing specific practice environments that represent competition constraints (Araújo and Davids, 2009; Araujo et al., 2006). Besides, competition-specific preparation has results advantageous for players in terms of anticipating and refining their response (Eccles et al., 2009; Munivrana et al., 2015).
Many researchers have sought to identify performance indicators that describe and explain effective players’ behaviours during the competition. In racket sports, points and error distribution allow to characterize players’ performance (i.e., profiling), predicting a match outcome and game success (Djurovic et al., 2009; Katic et al., 2009; O’Donoghue, 2015; O’Donoghue and Ingram, 2001). Recently, Courel-Ibáñez et al. (2015) examined winners and losers’ effectiveness from 15 games of top 16 male padel players, finding on average 44.3% of points (49.1% for winners) and 55.7% of errors (50.9% for winners). In comparison with other racket sports, the padel stroke-effectiveness pattern shows a greater proportion of errors up to 25% in squash, 15% in badminton, and 10% in tennis (Abian-Vicen et al., 2013; Hughes and Robert, 2005; Roddy et al., 2014). Regarding scoring strategies, a players’ location (i.e., net or baseline) and movement sequences (e.g., approaching to the net) have been reported to have notable implications in racket sports. Hughes and Robert (2005) observed the prevalence of movement behind the baseline, but higher effectiveness when volleying at the net (31.8% winners) in elite men tennis players. Similarly, volleys in squash and strokes from near the net in badminton have been found to significantly contribute to the rally outcome (Abian-Vicen et al., 2013; Roddy et al., 2014). In elite padel games, points scored at the net accounted for over 80% of the total, especially for winners who scored about 34% more points and made 40% less unforced errors from this location compared to losers (Courel-Ibáñez et al., 2015).
Temporal structure has been widely studied in racket sports, providing important information about playing patterns and energy requirements during competition (Laffaye et al., 2015; Lees, 2003; Torres-Luque et al., 2014). In padel, several investigations have explored temporal variables such as rally time, recovery time between games and total match time (Carrasco et al., 2011; Castillo-Rodríguez et al., 2014; Sánchez-Alcaraz, 2014). They found periods of work and recovery of 5-15 s and 10-20 s, respectively, interspersed by longer rest stages (i.e., 90 s between changeover breaks), considering differences resulting from sex, age and the level of performance. Based on previous research on the activity pattern in racket sports (Girard et al., 2011; Girard and Miller, 2009), we could define padel as intermittent activity, characterized by repetitions of rapid starts and stops as well as alternating brief periods of exercise at maximal or near maximal intensity, and longer periods of lower intensity Physiological demands in racket sports such as padel are determined by players’ ability to accelerate, decelerate, change direction, move quickly, maintain balance and repeatedly generate optimum stroke production (Lees, 2003). Besides, during the match, competitors are constantly solving problems by cooperating and interacting to perform individual and collective actions focused on disturbing the opponent and defending the own court (Garganta, 2009; McGarry et al., 2002). Thus, performance arises from a complex interaction between technical, tactical, physiological and psychological skills. In this sense, knowledge on rally length variations in padel could help better understand match activity and players’ strategies and efficiency.
Furthermore, it may constitute a useful guide in the development of competition-specific training tasks to enhance athletes’ adaptations and responses during the match, improving their performance.
Therefore, the purpose of this study was to analyse differences in the length of a rally considering attack effectiveness, a players’ location and a game outcome in elite padel players. Due to the lack of previous reports exploring these relationships, we found it difficult to establish an accurate hypothesis.
Material and Methods
Participants
The sample included 1527 rallies from 10 male matches of the 2013 Masters Finals of the World Padel Tour. This competition gathers the top 16 players, becoming the most important padel tournament in the world and ensuring the highest competitive level in all the matches. Variables pertaining to the length of a rally, attack effectiveness, a game outcome and a players’ location were included in the analysis:
-
•
Length of a rally: rally’s duration was recorded from the time the serving player hit the ball to the end of the rally as specified in the rules. Then, it was converted into a cates, 8 to 11 s, and over 11 s.
-
•
Attack effectiveness: success of the last stroke of the rally was registered considering points scored (the ball not reached by the opponent and the attacker wins the rally), forced errors (lost point by a bad play or a mistake in a situation that should be fully controlled by a player), and unforced errors (considered when the opponent’s action forced the attacker to miss after hitting the ball unbalanced, hitting back a high-speed ball, or hitting very close to the wall).
-
•
Game outcome: strokes were classified whether performed by the winning or losing pair of the match.
-
•
Players’ location: As depicted in Figure 1, the court was divided into two zones (net and baseline). Following Ramón-Llín and Guzmán (2014), padel players are located between the 3rd and the 4th m from the net when volleying. In this sense, a net zone was set considering the visual reference at the horizontal bar in the grille zone located at the 4th m from the net (Courel-Ibáñez et al., 2015).
Figure 1.
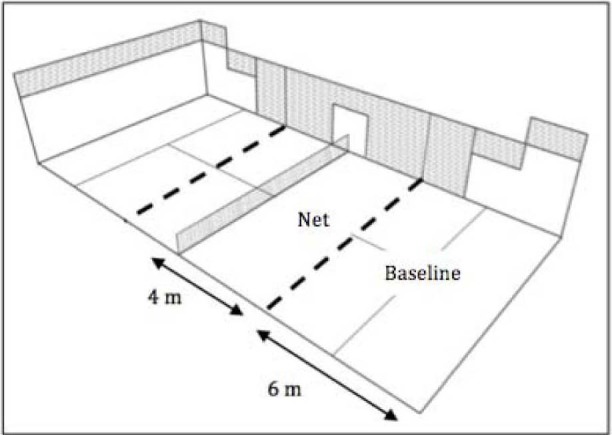
Court zones delimitation. Visual reference was set at the horizontal bar in the grille zone located at the 4th m from the net.
Procedures
The matches were viewed from the official youtube channel of the World Padel Tour (https://www.youtube.com/user/WorldPadelTour AJPP). Data were collected through systematic observation, following Anguera’s (2003) considerations. Two observers specialized in padel were specifically trained for this task. Having completed the training process, each observer registered the same three games (N = 322 rallies) in order to calculate inter-rater reliability through Cohen’s kappa, obtaining a minimum score above k = 0.80. To ensure consistency of data obtained, intra-observer evaluation at the end of the observation process was performed by Cohen’s kappa calculation, obtaining a minimum score of k = 0.93. According to Altman (1991), kappa values obtained presented very good strength of agreement (k>0.80). The recording instrument used was the LINCE software (Gabín et al., 2012), flexible digital recording software that allows data exportation for its treatment to statistical packages.
Statistical analyses
Descriptive analysis included frequencies, means and standard deviations. Assumptions of normality and homogeneity of variances were verified using the Kolmogorov-Smirnov test and the Levene’s test. Symmetry was analysed dividing the skewness and kurtosis by their respective standard error, getting distributions > 1.96. Then, non-parametric tests were implemented (Pallant, 2011). The Kruskal-Wallis test and post-hoc pairwise comparisons were used to identify differences in the length of the rally regarding attack effectiveness. Significant interactions were further investigated using the Mann-Whitney test with Bonferroni correction, i.e., the level of significance for individual comparisons was set at p < 0.01 to ensure a global type I error rate of α = 0.05 (Field, 2009). The Mann-Whitney test was also used to identify differences in the length of the rally, attack effectiveness and a players’ location between winners and losers. Effect size (r = z/√n) was calculated for each pair of groups that differed significantly, considering small (r = .10), medium (r = .30) and large (r = .50) effects (Cohen, 1988; Fritz et al., 2011). Moreover, crosstabs and Chi square analysis was performed to identify relationships between attack effectiveness and the game outcome within the four time intervals. The adjusted standardized residuals (ASRs) were used to study the significance of these relationships, setting values between 1.96 and 2.58 as p = 0.05, between 2.58 and 3.29 as p = 0.01, and over 3.29 as p < 0.01 (Field, 2009). Cramer’s V was calculated to measure the strength of the relationship, considering small (V = .06), medium (V = .17) and large (V = .29) effects for df = 3 (Cohen, 1988; Fritz et al., 2011). Data were processed in IBM SPSS 20.0 Statistics for Macintosh (Armonk, NY: IBM Corp.).
Results
Table 1 shows the length of rallies distribution regarding attack effectiveness, the players’ location and the game outcome. The Kruskal-Wallis test yielded effects of attack effectiveness on rally duration (H(2) = 68.19, p < 0.01): the shortest rally mean duration was for unforced errors, followed by points scored and forced errors. Post hoc comparisons revealed duration differences between forced and unforced errors (z = −5.90, p < 0.01, r = .15), and points scored and unforced errors (z = −7.94, p < 0.01, r = .20). Regarding the game outcome, the Mann-Whitney test showed longer rally duration for winners compared to losers (z = 6.03, p < 0.01, r = .15). Concretely, winners played longer rallies when scoring (z = 4.05, p < 0.01, r = .10) and committing forced errors (z = 3.35, p < 0.01, r = .08), but not when making unforced errors (z = 1.84, p = 0.07). Considering the players’ location, rallies finished at the net were longer than those from the baseline (z = 4.99, p < 0.01, r = .13), particularly for winners (z = 4.03, p < 0.01, r = .13). Besides, winners made longer forced (z = 2.60, p < 0.01, r = .21) and unforced errors (z = 2.40, p = 0.02, r = .15) from the net and longer points from the baseline (z = 3.70, p < 0.01, r = .15) compared to losers.
Table 1.
Length of rallies distribution regarding attack effectiveness, the players’ location and the game outcome.
| Length of rally in seconds (M ± SD) | |||
|---|---|---|---|
| Performance variable | |||
| Winners | Losers | Total | |
| Effectiveness | |||
| Point | 10.91 ± 7.58* | 8.90 ± 5.97* | 10.12 ±7.18 |
| Forced Error | 11.91 ±8.87* | 9.25 ± 7.42* | 10.71 ±8.05 |
| Unforced Error | 8.37 ±6.69 | 7.38 ±6.15 | 7.49 ± 6.10 |
| Location | |||
| Net | 10.20 ±8.17* | 7.69 ± 6.86* | 9.74 ±6.95 |
| Baseline | 10.55 ± 7.57* | 8.89 ±6.11* | 8.80 ± 7.57 |
| Location & Effectiveness | |||
| Net Point | 10.31 ± 7.29 | 8.95 ±8.13 | 10.07 ±6.81 |
| Net Forced Errors | 11.91 ±9.47* | 8.33 ± 6.92* | 11.12 ±9.14 |
| Net Unforced Errors | 8.86 ± 7.44* | 6.86 ± 6.24* | 7.94 ± 5.93 |
| Baseline point | 11.04 ±7.64* | 8.90 ± 5.41* | 9.66 ± 7.01 |
| Baseline Forced Errors | 11.92 ±8.37 | 10.28 ± 7.85 | 9.95 ± 8.34 |
| Baseline Unforced Errors | 7.85 ± 5.83 | 8.01 ±6.03 | 7.66 ± 6.80 |
| Total | 10.42 ± 7.77* | 8.42 ± 6.43* | 9.40 ± 7.19 |
Significant differences between winners and losers (p<0.05).
Frequency of attack effectiveness, time intervals and the game outcome are shown in Table 2. Significant relationships were found between attack effectiveness and the intervals (X2(6) = 92.159, p < 0.01, V = .17). Particularly, unforced errors were likely to be made during the first 4 s of the rally, while unforced errors were mostly made after the 11th seconds of the rally. Besides, around six out of ten points were scored in the interval of 5 to 11 s. Regarding the game outcome, significant differences were detected between winners and losers in points (X2(3) = 30.062, p < 0.01, V = .18) and forced errors (X2(3) = 11.191, ρ = 0.01, V = .21), but not in unforced errors (X2(3) = 4.030; p = 0.26). Specifically, losers made earlier unforced errors and scored earlier points; conversely, winners were able to score points later as well as made unforced errors later.
Table 2.
Frequency of attack effectiveness, time intervals the and game outcome, including adjusted standardized residuals (ASRs).
| Frequency | % Row (a) | % Column (c) | |||||||||
|---|---|---|---|---|---|---|---|---|---|---|---|
| Win. | Los. | T. | Win. | Los. | T. | ASRs (b) | Win. | Los. | T. | ASRs (d) | |
| 1 to 4 s | 142 | 256 | 398 | 35.7 | 64.3 | 100 | 19.6 | 31.9 | 26.1 | ||
| Point | 41 | 78 | 119 | 34.4 | 65.5 | 17.3 | -4.8* | 10.9 | 24.8 | 29.9 | -7.1* |
| Forced Error | 27 | 51 | 78 | 65.4 | 34.6 | 22.8 | -2.7* | 16.4 | 28.8 | 19.6 | -1.6 |
| Unforced Error | 74 | 127 | 201 | 63.2 | 36.8 | 40.5 | N.S | 36.1 | 43.6 | 50.5 | 8.9* |
| 5 to 7 s | 207 | 189 | 396 | 52.3 | 47.7 | 100 | 28.6 | 23.6 | 25.9 | ||
| Point | 115 | 76 | 191 | 60.2 | 39.8 | 27.7 | 1.9 | 30.7 | 24.2 | 48.2 | 1.4 |
| Forced Error | 38 | 46 | 84 | 45.2 | 54.8 | 24.6 | -0.6 | 23.0 | 26.0 | 21.2 | -0.7 |
| Unforced Error | 54 | 67 | 121 | 44.6 | 55.4 | 24.4 | N.S | 26.3 | 23.0 | 30.6 | -1.0 |
| 8 to 11 s | 163 | 176 | 339 | 48.1 | 51.9 | 100 | 22.5 | 21.9 | 22.2 | ||
| Point | 95 | 91 | 186 | 51.1 | 48.9 | 27.0 | -1.1 | 25.3 | 29.0 | 54.9 | 4.1* |
| Forced Error | 37 | 38 | 75 | 50.7 | 49.3 | 21.9 | 0.5 | 23.0 | 20.9 | 22.1 | -0.1 |
| Unforced Error | 31 | 47 | 78 | 39.7 | 60.3 | 15.7 | N.S | 15.1 | 16.2 | 23.0 | -4.2* |
| Over 11 s | 212 | 181 | 393 | 53.9 | 46.1 | 100 | 29.3 | 22.7 | 25.8 | ||
| Point | 124 | 69 | 193 | 64.2 | 35.8 | 28.0 | 3.2* | 33.1 | 22.0 | 49.0 | 1.8 |
| Forced Error | 42 | 62 | 104 | 41.0 | 59.0 | 30.7 | 2.7* | 37.6 | 24.3 | 26.6 | 2.4* |
| Unforced Error | 46 | 50 | 96 | 52.1 | 47.9 | 19.4 | N.S | 22.4 | 17.2 | 24.4 | -4.0* |
Win: Winner; Los: Loser; T: Total.
(a) Percentage comparing attack effectiveness vs. game outcome.
(b) ASRs for the time interval: positive sign=positive association with the current time interval.
(c) Percentage within each time interval.
(d) ASRs for the game outcome: positive sign=positive association for winners and negative association for losers.
Significant positive/negative association, considering values 1.96-2.58 as p<0.05, 2.58-3.29 as p<0.01, and over 3.29 as p<0.01. N.S. Non significant results (Chi-Square p>0.05).
Discussion
The purpose of this study was to analyse differences in the length of rallies considering attack effectiveness, a players’ location and a game outcome in elite padel players. Overall, 40% of unforced errors were made within the first 4 s of the rally, over 50% of points were scored between the 5th and 11th s, and 30% of forced errors occurred after the 11th s of the rally. Therefore, the ability to score in rallies of over 11 s duration and not making unforced errors within the first 4 s contributed to the rally outcome in padel. Furthermore, winners played longer rallies than losers, particularly when scoring and making forced errors. More specifically, longest winners’ errors were made at the net, while longest points were scored at the baseline.
Significant differences were found between winners and losers length of rallies and effectiveness. Winners played longer rallies compared to losers, resulting in better performance. It is well known that high cardiorespiratory capacity and muscular endurance may help players to delay fatigue and aid in recovery, being a distinguishing factor for best players in racket sports (Banzer et al., 2008; Girard and Millet, 2009; Kovacs, 2006). However, padel is a two-on-two racket sport, in which each player has a theoretical responsibility area of 5 x 2.5 m (i.e., total court dimension/number of players). Hence, physical and physiological responses in elite padel competition are significantly lower in comparison with tennis, badminton or squash (Castillo-Rodriguez et al., 2014). Indeed, high-level male padel players cover less distance and at lower speed compared with advanced and amateur players (Castillo-Rodriguez et al., 2014), indicating better on-court movement and positioning towards the ball. This leads to the suggestion that more specific factors such as acceleration, agility, balance and response time should require special attention in physical padel training.
More precisely, the ability to score in rallies of over 11 s duration and not making unforced errors within the first 4 s contribute to the rally outcome in padel. Psychological skills and execution behavior may have a critical bearing on this fact. A better performance could be related to the capability of resolving competition problems by selecting the most appropriate solution and the speed of this decision-making in a rapidly changing and unpredictable environment (Wang et al., 2013). An interesting approach made in tennis identifies the differences between expert and novice players in decision-making and execution variables (Del Villar et al., 2007; Nielsen and McPherson, 2001). These authors state that expert players display a greater ability to make appropriate decisions, selecting the most tactical responses (i.e., putting pressure on the opponent); furthermore, they were able to carry out forceful executions to their opponent with greater efficiency, making the opponent’s response much more difficult.
Interestingly, we found winners’ longer rally length when scoring from the baseline and longest winners’ errors were made at the net. Technical and tactical skills may have special implications in this point. Scoring ability in padel is strongly related with players’ effectiveness at the net, enhancing winning chances (Courel-Ibáñez et al., 2015; Sánchez-Alcaraz et al., 2016). Similarly, previous research in tennis reported a greater proportion of points won at the net compared to the baseline (O’Donoghue and Ingram, 2001). Moreover, tactical dynamics might account for these differences by better players’ positioning and movement when approaching the net, increasing the time spent at the net and enhancing scoring options (Martínez-Gallego et al., 2013; Ramón-Llin et al., 2013). Following Martínez-Gallego et al. (2013), in tennis, better offensive skills from the net will allow players to keep this advantageous location for longer time, resulting in more points scored. These results showed that when winners were in the offensive zone, they took advantage of this better position to strike the ball more effectively, and consequently scored or forced opponent’s errors. On the contrary, when losers were in the offensive zone, they committed more unforced errors, losing their options to win the point or force their opponent’s errors. Nevertheless, further research on the effectiveness at the net and baseline, as well as during transitions, is needed to well define useful strokes and movement patterns in padel (Sánchez-Alcaraz et al., 2015).
Conclusion
The current study adds information on performance analysis in racket sports, particularly on padel. Such knowledge may have implications in the design and structure of specific training programmes for padel players according to competition requirements. Nonetheless, there are several limitations that must be acknowledged. First, contextual variables such as the game period, game location or match status were not registered. Given the influence of situational variables on game performance according to critical moments (Gómez et al., 2013), it would be of great interest to include such information in future research on padel. Second, the players’ location was exclusively explored in the longitudinal axis, not including any measurements related the lateral zones. Furthermore, specific information about stroke technique was not registered.
Authors submitted their contribution to the article to the editorial board.
References
- Altman DG. Practical Statistics for Medical Research. London: Chapman & Hall; 1991. [Google Scholar]
- Anguera MT. Encyclopedia of Psychological Assessment. London: Sage; 2003. Observational Methods (General). In R. Fernández-Ballesteros (Ed.) [Google Scholar]
- Araújo D,, Davids K.. Ecological approaches to cognition and action in sport and exercise: Ask not only what you do, but where you do it. Int J Sports Psychol. 2009;40(1):5–37. [Google Scholar]
- Araújo D,, Davids KW,, Hristovski R.. The ecological dynamics of decision making in sport. Psychol Sport Exerc. 2006;7(6):653–76. [Google Scholar]
- Banzer W,, Thiel C,, Rosenhagen A,, Vogt L.. Tennis ranking related to exercise capacity. Br } Sports Med. 2008;42(2):152–4. doi: 10.1136/bjsm.2007.036798. [DOI] [PubMed] [Google Scholar]
- Carrasco L,, Romero S,, Sañudo B,, De Hoyo M.. Game analysis and energy requirements of paddle tennis competition. Sci Sports. 2011;26(6):338–44. [Google Scholar]
- Castillo-Rodríguez A,, Alvero-Cruz JR,, Hernández-Mendo A,, Fernández-Garda JC.. Physical and physiological responses in Paddle Tennis competition. Int J Perf Anal Sport. 2014;14(2):524–34. [Google Scholar]
- Cohen J. Statistical power analysis for the behavioral sciences Hillsdale. NJ: Lawrence Earlbaum Associates; 1988. [Google Scholar]
- Courel-Ibáñez J,, Sánchez-Alcaraz BJ,, Cañas J.. Effectiveness at the net as a predictor of final match outcome in professional padel players. Int J Perf Anal Sport. 2015;15:632–40. [Google Scholar]
- Del Villar F,, González LG,, Iglesias D,, Moreno MP,, Cervello EM.. Expert-Novice Differences In Cognitive And Execution Skills During Tennis Competition. Percept Mot Skills. 2007;104(2):355–65. doi: 10.2466/pms.104.2.355-365. [DOI] [PubMed] [Google Scholar]
- Djurovic N,, Lozovina V,, Pavicic L.. Evaluation of Tennis Match Data - New Acquisition Model. J Hum Kinet. 2009;21(1):15–21. [Google Scholar]
- Drust B.. Performance analysis research: Meeting the challenge. J Sports Sci. 2010;28:921–2. doi: 10.1080/02640411003740769. [DOI] [PubMed] [Google Scholar]
- Eccles D,, Ward P,, Woodman T.. Competition-specific preparation and expert performance. Psychol Sport Exerc. 2009;10:96–107. [Google Scholar]
- Field A. Discovering statistics using SPSS. London: Sage; 2009. [Google Scholar]
- Fritz CO,, Morris PE,, Richler JJ.. Effect size estimates: Current use, calculations, and interpretation. J Exp Psychol Gen. 2012;141(1):2–18. doi: 10.1037/a0024338. [DOI] [PubMed] [Google Scholar]
- Gabín B,, Camerino O,, Anguera MT,, Castañer M.. Lince: multiplatform sport analysis software. Procedía Comput Sci. 2012;46:4692–4. [Google Scholar]
- García-Ferrando M,, Llopis R.. Survey of sporting habits in Spain 2010: Democratic ideal and personal welfare. Madrid: Consejo Superior de Deportes & Centro de Investigaciones Sociológicas. 2011 2015 Jul 27; https://www.google.es/url?sa=t&rct=j&q=&esrc=s&source=web&cd=2&cad=rja&uact=8&ved=0ahUKEwi_oL WluI7OAhUC5xoKHR0KAPMQFggfMAE&url=http%3A%2F%2Fwww.mecd.gob.es%2Fservicios-al-ciudadano-mecd%2Fdms%2Fmecd%2Fservicios-al-ciudadano-mecd%2Festadisticas%2Fdeporte%2Fehd%2FSurvey_of_sporting_habits_in_Spain_2015_Synthesis_of _results.pdf&usg=AFQjCNFNGB_C4xMv_ZJ9NNw-VKcclflK0Q&sig2=AWpZVQXymR4y-bJXYztawA accessed on. [Google Scholar]
- Garganta J.. Trends of tactical performance analysis in team sports: bridging the gap between research, training and competition. Revista Portuguesa de Ciencias do Desporto. 2009;9(1):81–9. [Google Scholar]
- Girard O,, Méndez-Villanueva A,, Bishop D.. Repeated-sprint ability: part I. Factors contributing to fatigue. Sports Med. 2011;41:673–94. doi: 10.2165/11590550-000000000-00000. [DOI] [PubMed] [Google Scholar]
- Girard O,, Millet GP.. Neuromuscular fatigue in racquet sports. Phys Med Rehabil Clin N Am. 2009;20:161–73. doi: 10.1016/j.pmr.2008.10.008. [DOI] [PubMed] [Google Scholar]
- Gómez MA,, Lago C,, Pollard R. Routledge Handbook of Sports Performance Analysis. London: Routledge; 2013. Situational Variables. In: McGarry T, O’Donoghue P, Sampaio J, editors; pp. 259–69. [Google Scholar]
- Hughes M,, Bartlett R.. The use of performance indicators in performance analysis. J Sports Sci. 2002;20(10):739–54. doi: 10.1080/026404102320675602. [DOI] [PubMed] [Google Scholar]
- Hughes M,, Franks IM. Notational Analysis of Sport: Systems for Better Coaching and Performance in Sport. London: Routledge; 2004. [Google Scholar]
- Hughes M,, Robert M.. Movement patterns in elite men’s singles tennis. Int J Perf Anal Sport. 2005;5(2):110–34. [Google Scholar]
- International Padel Federation. Padel regulations. Calgary. 2008 [Google Scholar]
- Katic R,, Milat S,, Zagorac N,, Djurovic N.. Impact of game elements on tennis match outcome in Wimbledon and Roland Garros. Coll Antropol. 2009;35(2):341–6. [PubMed] [Google Scholar]
- Kovacs MS.. Applied physiology of tennis performance. Br } Sports Med. 2006;40(5):381–5. doi: 10.1136/bjsm.2005.023309. [DOI] [PMC free article] [PubMed] [Google Scholar]
- Laffaye G,, Phomsoupha M,, Dor F.. Changes in the Game Characteristics of a Badminton Match: A Longitudinal Study through Olympic Game Finals Analysis in Men’s Singles. J Sports Sci Med. 2015;14:585–90. [PMC free article] [PubMed] [Google Scholar]
- Lees A.. Science and the major racket sports: A review. J Sports Sci. 2003;21(9):707–32. doi: 10.1080/0264041031000140275. [DOI] [PubMed] [Google Scholar]
- Martínez-Gallego R,, Gúzman JF,, James N,, Ramón-Llín J,, Crespo M,, Vuckovic G.. The relationship between the incidence of winners/errors and the time spent in different areas of the court in elite tennis. Journal of Human Sport & Exercise. 2013;8(3):601–7. [Google Scholar]
- McGarry T,, Anderson DI,, Wallace SA,, Hughes MD,, Franks IM.. Sport competition as a dynamical self-organizing system. J Sports Sci. 2002;20(10):771–81. doi: 10.1080/026404102320675620. [DOI] [PubMed] [Google Scholar]
- Munivrana G,, Petrinovic LZ,, Kondric M.. Structural analysis of technical-tactical elements in table tennis and their role in different playing zones. J Hum Kinet. 2015;47:197–214. doi: 10.1515/hukin-2015-0076. [DOI] [PMC free article] [PubMed] [Google Scholar]
- Nielsen TM,, McPherson SL.. Response selection and execution skills of professionals and novices during singles tennis competition. Percept Mot Skills. 2001;93:541–55. doi: 10.2466/pms.2001.93.2.541. [DOI] [PubMed] [Google Scholar]
- O’Donoghue P. Research methods for sports performance analysis. London: Routledge; 2009. [Google Scholar]
- O’Donoghue P. In: McGarry T, O’Donoghue P, Sampaio J, editors Routledge Handbook of Sports Performance Analysis. London: Routledge; 2013. Sports Performance Profiling; pp. 127–39. [Google Scholar]
- O’Donoghue P,, Ingram B.. A notational analysis of elite tennis strategy. J Sports Sci. 2001;19(2):107–15. doi: 10.1080/026404101300036299. [DOI] [PubMed] [Google Scholar]
- Pallant J. SPSS Survival Manual: A Step by Step Guide to Data Analysis Using the SPSS Program. Australia: Allen & Unwin; 2011. [Google Scholar]
- Ramón-Llín J,, Guzmán JF.. Distance to the net of padel players according to their receiving position on the court. Revista Internacional de Deportes Colectivos. 2014;18:105–113. [Google Scholar]
- Ramón-Llín J,, Guzmán JF,, Martínez-Gallego R,, Vuckovic G,, James N. Performance Analysis of Sport IX. London: Routledge; 2013. Time-motion analysis of Pádel players in two matches of the 2011 Pro Tour. In: Peters D, O’Donoghue P, editors. [Google Scholar]
- Roddy R,, Lamb K,, Worsfold P.. The importance of perturbations in elite squash: An analysis of their ability to successfully predict rally outcome. Int J Perf Anal Sport. 2014;14(3):652–79. [Google Scholar]
- Sánchez-Alcaraz BJ.. Game actions and temporal structure differences between male and female professional paddle players. Acción Motriz. 2014;12:17–22. [Google Scholar]
- Sánchez-Alcaraz BJ,, Cañas J,, Courel-Ibáñez J.. Analysis of scientific research in padel. AGON Int J Sport Sci. 2015;5(1):44–54. [Google Scholar]
- Sánchez-Alcaraz BJ,, Courel-Ibáñez J,, Cañas J.. Groundstroke accuracy assessment in padel players according to their level of play. RICYDE. Rev Int Cienc Deporte. 2016;12(45):324–333. [Google Scholar]
- Torres-Luque G,, Sánchez-Pay A,, Fernández-García AI,, Palao JM.. Characteristics of temporal structure in tennis. A review, J Sport Health Res. 2014;6(2):117–28. [Google Scholar]
- Wang CH,, Chang CC,, Liang YM,, Shih CM,, Chiu WS,, Tseng P,, Hung D,, Tzeng O,, Muggleton N,, Juan CH.. Open vs. Closed Skill Sports and the Modulation of Inhibitory Control. PLoS ONE. 2013;8(2):e55773. doi: 10.1371/journal.pone.0055773. [DOI] [PMC free article] [PubMed] [Google Scholar]