

SUMMARY
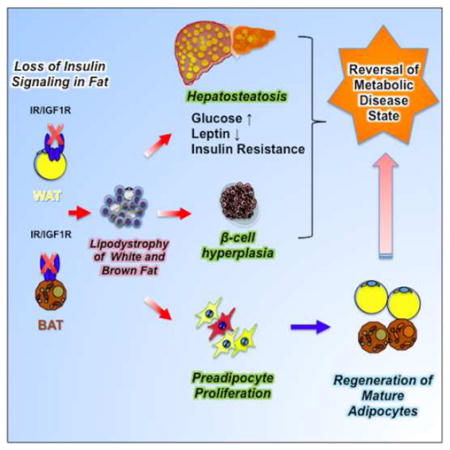
Insulin and IGF-1 signaling are important for adipose tissue development and function, however their role in mature adipocytes is unclear. Mice with a tamoxifen-inducible knockout of insulin and/or IGF1 receptors (IR/IGF1R) demonstrate a rapid loss of white and brown fat due to increased lipolysis and adipocyte apoptosis. This results in insulin resistance, glucose intolerance, hepatosteatosis, islet hyperplasia with hyperinsulinemia, and cold intolerance. This phenotype, however, resolves over 10–30 days due to a proliferation of preadipocytes and rapid regeneration of both brown and white adipocytes as identified by mTmG lineage tracing. This cycle can be repeated with a second round of receptor inactivation. Leptin administration prior to tamoxifen treatment blocks development of the metabolic syndrome without affecting adipocyte loss or regeneration. Thus, IR is critical in adipocyte maintenance, and this loss of adipose tissue stimulates regeneration of brown/white fat and reversal of metabolic syndrome associated with fat loss.
Graphical abstract
INTRODUCTION
Metabolic health depends on the maintenance of normal mass and function of adipose tissue. Accumulation of excess body fat, i.e. obesity, or pathological loss of adipose tissue, i.e., lipodystrophy, is associated with insulin resistance, glucose intolerance, fatty liver, and hyperlipidemia (Haslam and James, 2005; Rosen and Spiegelman, 2006; Mori et al., 2014; Weiss et al., 2004). These pathologies are the result of increased circulating free fatty acids (FFA), changes in circulating adipokines, development of adipose tissue inflammation with increases in circulating cytokines, accumulation of fat in other tissues and induction of stress kinases and ER stress in tissues throughout the body (Hotamisligil, 2006).
There are two major types of adipose tissue which have different morphologies, differentiate from different progenitors and serve unique functions (Seale et al., 2008; Shinoda et al., 2015; Tseng et al., 2010; Xue et al., 2015). White adipocytes are involved in energy storage and contain a large single lipid droplet made up of triglycerides that can be released as fatty acids during fasting (Poher et al., 2015). Brown adipocytes are involved in energy expenditure and thermogenesis. They contain multilocular lipid droplets and are rich in mitochondria expressing uncoupling protein-1 (UCP1) (Enerback et al., 1997).
In adult animals, maintenance of normal white and brown adipose tissue (WAT and BAT) mass is the result of a balance of lipogenesis and lipolysis (Bouchard et al., 1993), and turnover of adipocytes is very slow (estimated at 10% per year in humans (Arner et al., 2010). These new adipocytes are generated from specific precursors in each tissue (Rodeheffer et al., 2008; Macotela et al., 2012; Tang et al., 2008). Increased generation of white adipocytes has been shown in obese humans (Arner et al., 2011; Spalding et al., 2008), in mice on a high fat diet (Jeffery et al., 2015; Macotela et al., 2012; Vishvanath et al., 2016; Wang et al., 2013) and in response to an induction of apoptosis in adipose tissue following activation of the caspase system (Pajvani et al., 2005). To what extent brown adipose tissue can regenerate or turnover is unknown.
Insulin and IGF-1 acting through their respective receptors are essential for the development and function of BAT and WAT (Bluher et al., 2002; Boucher et al., 2012). Insulin is a major regulator of glucose uptake and lipid metabolism in mature adipocytes, and both insulin and IGF-1 play important roles in the stimulation of adipocyte differentiation and preadipocyte survival (Boucher et al., 2010). In previous studies, we and others have demonstrated the role of insulin/IGF1-signaling in adipose tissues in vivo by the creation of mice with a stable inactivation of the insulin receptor (IR) and IGF-1 receptor (IGF1R) genes in adipocytes using a transgene containing the Cre-recombinase driven by the aP2-promoter (Bluher et al., 2002; Boucher et al., 2012). These studies revealed that a lifelong lack of insulin receptors severely impairs the development of both brown and white fat. However, these models, by their developmental nature, do not provide information regarding the involvement of insulin and IGF-1 in regulation of mature adipocyte function or turnover.
To address this fundamental question, we have now created mice with an inducible knockout of the IR and/or IGF1R in adipocytes (here designated Ai-IRKO, Ai-IGFRKO and Ai-DKO) using a tamoxifen-inducible adiponectin-CreERT2 to drive recombination (Sassmann et al., 2010). We show that adult mice with a conditional knockout of IR or IR/IGF1R rapidly develop severe lipodystrophy, hepatosteatosis and systemic insulin resistance with marked hyperglycemia, hyperinsulinemia, β-cell proliferation, decreased energy expenditure and cold intolerance demonstrating the critical role of IR in the maintenance of both BAT and WAT in the adult. This syndrome, however, is transient as adipose tissues rapidly regenerate due to a marked increase in proliferation of preadipocytes and differentiation of new cohorts of brown and white adipocytes. These data indicate the presence of an adipostatic sensor which can increase adipose proliferation and differentiation in response to a loss of adipose tissue secondary to a loss of insulin signaling. While leptin replacement can block development of metabolic syndrome during the lipodystrophic phase, it does not affect the ability of adipocytes to regenerate.
RESULTS
Role of insulin and IGF-1 receptors in mature adipocytes
To investigate the roles of insulin and IGF-1 in adipocytes in adulthood, we established mouse models in which IR and/or IGF-1R were deleted specifically in adipose tissues in an inducible manner by crossing mice with floxed insulin and/or IGF-1 receptor alleles (Boucher et al., 2012) with mice carrying a tamoxifen-inducible Cre ERT2 transgene under control of the adiponectin promoter (AdipoqCreERT2) (Sassmann et al., 2010). This transgene is 97–99% effective in inducing gene recombination. Control mice, i.e., mice carrying floxed alleles, but not the Cre-transgene, were also given tamoxifen, since some studies have suggested that tamoxifen treatment can induce metabolic abnormalities (Hesselbarth et al., 2015). However, under the conditions used here, the Control mice showed no adverse effects of tamoxifen.
When 8 week-old mice carrying floxed IR and IGF1R and the AdipoqCreERT2 transgene were treated with tamoxifen, the resultant Ai-DKO mice exhibited a rapid, major loss of adipose tissue, with 59–77% reductions in interscapular BAT, and subcutaneous (SC), perigonadal (PG), and retroperitoneal (Ret) WAT depots as early as 3 days after the last tamoxifen injection (Figures 1A, 1B, S1A and S1B). Knockout of IR alone (Ai-IRKO) produced a similar decrease in SC and PG-WAT mass, but a somewhat lesser reduction of BAT, whereas loss of IGF1R alone (Ai-IGFRKO) produced only a modest reduction of PG-WAT and no significant effect on SC-WAT or BAT (Figures 1A and S1A). Histologically, Ai-DKO fat at day 3 revealed extensive losses of adipocytes in all depots and a relative increase in stromovascular cells in SC- and PG-WAT, without evidence of inflammation (Figure 1C). Similar, but somewhat lesser effects, were observed in Ai-IRKO, whereas in Ai-IGFRKO there was no loss of fat, and adipose tissue histology was normal (Figure S1C).
Figure 1.

Physiology of mice with acute disruption of IR and/or IGF1R in fat. All data are from male mice 7–8 weeks of age on normal chow diet. Day 0 is the day of the last tamoxifen dose. (A) Tissue weights of SC-WAT, PG-WAT, and BAT in Control (n = 13), Ai-IGFRKO (IGF1R−/−) (n = 6), Ai-IRKO (IR−/−) (n = 13) and Ai-DKO (IGF1R−/− IR−/−) (n = 12) day 3 after treatment with tamoxifen. (B) Representative pictures of adipose tissue of Control and Ai-DKO at day 3. Scale bars indicate 1 cm. (C) HE stained sections of adipose tissue at day 3. Scale bars, 50 μm. (D) Blood glucose levels of Control (n = 13) and Ai-DKO (n = 14) under fed and fasted conditions at day 2. (E) Serum insulin and HOMA-IR levels of Control (n = 13) and Ai-DKO (n = 14) under fasting conditions at day 2. (F) OGTT on day 2 for Control (n = 13) and Ai-DKO (n = 12). (G) ITT on day 2 (n = 10/genotype) (H) mRNA expression measured by real-time qPCR in SC-WAT from Control (n = 7) and Ai-DKO (n = 6) at day 3. (I) mRNA abundance measured by real-time qPCR in BAT from Control (n = 7) and Ai-DKO (n = 6) at day 3. (J) Serum adiponectin and leptin concentrations at day 2 (n = 5/genotype). (K) Lipolysis assessed by FFA release from SC-WAT of Control (n = 5) and Ai-DKO (n = 7) at day 1.5. Samples were incubated ex vivo for 2 h at 37 °C in the presence or absence of 10 μM isoprenaline, and FFA released into the medium was quantified. (L) SC-WAT sections from Control and Ai-DKO were stained for TUNEL and DAPI at day 3 (left) and quantitated (n = 6/genotype) (right). (M) Representative pictures of liver in Control and Ai-DKO at day 3. Scale bar indicates 1 cm. (N) Liver tissue sections stained with HE in Control and Ai-DKO at day 3. Scale bars, 100 μm. Statistical significance is shown as p<0.05 (*), p<0.01 (**), and p<0.001 (***).
Coincident with the loss of adipose tissue, within 3 days after treatment, Ai-DKO developed a severe metabolic syndrome with average fasting blood glucoses of ~235 mg/dl and fed glucoses >460 mg/dl (Figure 1D). This was associated with a 6.8-fold increase in serum insulin levels and a 12.4-fold increase in insulin resistance as measured by HOMA-IR (Figure 1E). Ai-IRKO also showed hyperglycemia, hyperinsulinemia and insulin resistance, whereas Ai-IGFRKO and Control mice treated with tamoxifen showed no changes in glucose or insulin levels (Figures S1D, S1E and 1D). The lipodystrophy in Ai-IRKO and Ai-DKO was also associated with severe glucose intolerance on oral GTT and marked resistance to exogenous insulin during an insulin tolerance test (ITT) (Figures 1F and 1G).
Gene expression analysis of SC-WAT taken 3 days after tamoxifen administration showed marked reductions in adiponectin, leptin, FAS, ATGL, HSL, Glut4, PPARγ, AP2, and CEBPα mRNAs in Ai-DKO (Figure 1H). There was also a 5-fold increase in UCP-1 mRNA in SC-WAT, indicating some browning of SC-WAT (Figures 1H). BAT of Ai-DKO, on the other hand, showed a reduction of UCP1 mRNA, as well as reductions of AP2, Adrb3, ElpvI3, Cidea, PRDM16, Tfam and PGC1a mRNA when compared to Control (Figure 1I). Consistent with these changes in mRNA and the decrease in fat mass, serum levels of adiponectin and leptin were decreased by 73% and 93% in Ai-DKO (Figure 1J). This loss of adipose mass was associated with a significant increase of basal lipolysis in Ai-DKO as measured using explants of SC and PG-WAT, with no significant change of maximal isoprenaline-stimulated lipolysis (Figures 1K and S1H). In addition, both white and brown fat pads from Ai-DKO mice showed increased apoptosis by both TUNEL and cleaved caspase-3 staining by day 3 after tamoxifen-treatment (Figures 1L, S1I–S1K). Interestingly, however at this time point, Ai-DKO showed minimum evidence of inflammation in either adipose tissue depot and non-significant increases in serum levels of TNFα and IL-6 (Figures S1L and S1M). Due to the rapid loss of BAT, Ai-DKO showed a significant decrease of oxygen consumption rate (VO2) (Figure S1N).
Ai-DKO also developed acute hepatomegaly with a >50% increase in liver weight (Figures 1M and S1O). This was associated with a 5-fold increase of triglyceride (TG) content in the liver, and histologically evidence of hepatosteatosis (Figures 1N and S1P). Interestingly, in contrast to other models of lipodystrophy, serum TG, FFA, and beta-hydroxybutyrate remained normal range at all points tested (Figures S1Q–S1S).
Ai-IRKO and Ai-DKO rapidly recover from the insulin resistant lipodystrophic state
Despite the marked insulin resistance and metabolic abnormalities (at day 3), by day 9 after tamoxifen blood glucose levels in Ai-DKO had decreased from peak values by 50%, and they returned to normal by day 30 (Figure 2A). Glucose intolerance also returned to normal by day 30 (Figures 2B, S2A and S2B), as did the HOMA-IR and the impaired ITTs (Figures 2C, 2D and S2A–S2D). Ai-IRKO mice recovered similarly (Figures 2A–2D and S2A–S2D). H All features of hepatosteatosis in Ai-IRKO and Ai-DKO returned toward normal (Figures 2E, 2F and S2E), as did expression of hepatic lipogenic and gluconeogenic genes, which were increased in Ai-IRKO and Ai-DKO early in the time course (Figure S2F).
Figure 2.

Recovery from insulin resistance and glucose intolerance in mice after tamoxifen-treatment. Tamoxifen was administered 5 times over 6 days as indicated by arrows. The day of final injection was considered experimental day 0. (A) Fed glucose levels in Control (n = 17), Ai-IGFRKO (n = 12), Ai-IRKO (n = 12) and Ai-DKO (n = 14) before and after tamoxifen-treatment. (B) HOMA-IR levels at days −3, 3, 13 and 30 of the experiment. (C) Comparison of GTT at day 2 and 30 after tamoxifen-treatment. (D) ITT at day 2 and 30. (E) Liver tissue sections stained with Oil Red O for Control, Ai-IRKO, Ai-IGFRKO and Ai-DKO at day 3 and 30. Scale bars, 100 μm. (F) Liver weights in Control (gray, n = 6), Ai-DKO (red, n = 6) at day 9 and 30. Statistical significance is indicated as p<0.05 (*), p<0.01 (**), p<0.001 (***), and NS = not significant.
Induction and reversal of pancreatic β-cell proliferation in lipodystrophic mice
Both acute and chronic insulin resistance, including the insulin resistance of lipodystrophy, have been associated with hyperinsulinemia and increased pancreatic β-cell mass (Michael et al., 2000). While insulin levels remained low in Ai-IGFRKO and Control tamoxifen-treated mice, both Ai-DKO and Ai-IRKO displayed a rapid development of hyperinsulinemia by day 3, which returned almost to Control levels by day 30 (Figure 3A). In Ai-DKO and Ai-IRKO showed paralleled changes in islet mass and β-cell proliferation as identified by Ki67 staining. Indeed there was an 11-fold increase of Ki67-positive β-cells at day 3 (from 0.51 ± 0.10% to 5.76 ± 0.95%) (Figures 3B, 3C, S3A and S3B) and a 2.2-fold increase in β-cell mass compared to Control (2.46 ± 0.41 mg vs. 1.1 ± 0.12 mg, p<0.01) (Figure 3D). By day 30, β-cell replication measured by Ki67 had returned to normal levels (0.62 ± 0.16%), and β-mass had begun to decrease to a level not statistically greater than Control (Figures 3B–D and S3A). Similar results were observed in Ai-IRKO mice (Figure S3A). In Ai-DKO expression of the putative β-cell growth factor ANGPTL8/betatrophin (Yi et al., 2013) transiently increased in liver, but decreased in adipose tissue, while expression of SerpinB1, another peptide shown to have β-cell growth factor activity (El Ouaamari et al., 2016), was significantly increased in both SC-WAT and BAT, but not in liver.
Figure 3.

Effect of the insulin resistance of acquired lipodystrophy on β-cell replication, mass, and function. (A) Fasting serum insulin measured at days −3, 3, 13 and 30 of the experiment. (B) Pancreatic sections were immunostained for insulin and Ki67 in Control and Ai-DKO at day 3 and day 30 after tamoxifen treatment. Scale bars, 100 μm. (C) Quantification of Ki67+insulin+ cells in Control (n = 4–7) and Ai-DKO (n = 4–6) pancreas sections at day 3 and 30. (D) Quantitation of β-cell mass at day 3 and 30 (see Supplementary Experimental Procedures). (E) mRNA abundance measured by real-time qPCR in liver from Control (n = 7) and Ai-DKO (n = 6) at days 3 and 9. (F) Expression levels of mRNA measured by real-time PCR in SC, PG and BAT from Control and Ai-DKO at days 3 and 9 (n = 5–7 per group). Statistical significance is as in Figure 2.
Recovery of WAT in Ai-IRKO and Ai-DKO
To determine if adipose tissue contributes to the recovery of Ai-IRKO and Ai-DKO mice from the insulin resistant state, we analyzed WAT at days 9 and 30 after tamoxifen (Figure 4A). In Ai-IRKO and Ai-DKO, the weights of PG-WAT, which were reduced to 35.1% and 27.7% of Control at day 9, increased to 95.5% and 89.4% of Control levels by day 30. Similar effects were observed in SC-WAT (Figure 4A). Also by day 30, the WAT of Ai-IRKO and Ai-DKO showed normal morphology, although there was ~30% increase in mean cell diameter (Figures 4B, S4A and S4B).
Figure 4.

Regeneration of WAT in Ai-IRKO and Ai-DKO. (A) Recovery of tissue weights of SC and PG-WAT in Ai-IRKO (n = 6–7) and Ai-DKO (n = 6) at day 9 to 30 after tamoxifen-treatment compared to Control (n = 6). (B) SC and PG-WAT sections with HE in Control and Ai-DKO at day 30. Scale bars, 50 μm. (C) FACS profiles of sorted subcutaneous adipose SVF at day 3 from Control (n = 11), Ai-IRKO (n = 9) and Ai-DKO (n = 6). The live cells of the lineage-negative (Lin−) population, i.e. lacking of CD31, CD45 and Ter119 expression, were considered preadipocyte on the basis of positive Sca1 and CD34 expression. Representative data are indicated as the FACS profiles, and the averages are shown in the right graph. (D) mTmG labeling of mature SC and PG adipocytes in Control, Ai-IRKO and Ai-DKO before and on day 30 after tamoxifen treatment. Scale bars, 100 μm. (E) qPCR of Ucp1 gene expression in SC (left) and PG-WAT (right) from Control and Ai-DKO male mice treated with CL-316,243 (1 mg/kg) or vehicle for 7 days (n = 5–7 per group). Results are expressed as fold change over the Control SC (vehicle) group. Statistical significance is as in Figure 2.
To determine if preadipocyte proliferation in Ai-IRKO and Ai-DKO contributed to recovery of fat mass, we performed FACS analysis of the stromovascular fractions (SVF) from SC-WAT of Control and KO mice on day 3 after tamoxifen-treatment using the preadipocyte markers (Lin− Sca1+ CD34+). This revealed a marked increase in the percentage of preadipocytes from 5.4 ± 0.98% to 34.4 ± 2.2% (p<0.001) in Ai-DKO and similar changes in Ai-IRKO, indicating that preadipocyte proliferation contributes, at least part, to the rapid recovery of adipose mass in these mice (Figures 4C and S4C).
To further define the source of adipocyte regeneration lineage-tracing was performed by crossing Ai-IRKO and Ai-DKO mice, as well as mice carrying the adiponectin-CreERT2 transgene, with mice carrying the mTmG reporter. This reporter consists of tandemly aligned cDNAs for membrane-targeted tomato-fluorescent protein (mTFP) and membrane-targeted green-fluorescent protein (mGFP) separated by a lox-STOP-lox sequence driven by the ubiquitously expressed ROSA promoter (Muzumdar et al., 2007) (Figures S4D). In the Controladiponectin-creERT2:mTmG mice prior to tamoxifen-treatment the entire fat pad showed red fluorescence reflecting the ubiquitous expression of this transgene (Figure 4D, left). Within 3 days after tamoxifen more than 95% of the adipocytes exhibited green-fluorescent staining, demonstrating the efficacy of tamoxifen-induced gene rearrangement (Figures 4D, S4E and S4F). Like Controls, Ai-IRKO-mTmG and Ai-DKO-mTmG showed only red fluorescence in adipose tissues without tamoxifen-treatment, confirming no leakage of Cre-expression in these mice (Figure S4G).
At day 30 after tamoxifen, Control-mTmG mice carrying the Adipoq-Cre-ERT2 transgene continued to display green-labeled adipocytes in both SC- and PG-WAT, indicating that in mice on normal chow there was little adipocyte turnover in these depots over this 30-day period (Jeffery et al., 2015). By contrast, at day 30, Ai-IRKO-mTmG showed only a few residual green-labeled adipocytes (all without significant lipid droplets) scattered in SC- and PG-WAT pads, whereas > 90% of the lipid-containing adipocytes exhibiting red fluorescence, indicating that they were derived from preadipocytes not expressing adiponectin at the time of tamoxifen-treatment. Similar findings were made in Ai-DKO-mTmG with almost complete replacement of green adipocytes with red adipocytes in SC- and PG-WAT (Figures 4D and S4G). qPCR showed that the levels of FAS, ATGL, HSL, PPARγ, AP2, adiponectin, and leptin mRNA, which were low at day 9, had returned to normal at day 30 (Figure S4H). To determine the browning capacity of these WAT cells, Ai-DKO were given the β3-adrenergic receptor agonist (CL-316,243; 1 mg/kg) or vehicle for 7 days intraperitoneally beginning 6 weeks after tamoxifen treatment. The regenerated SC-WAT and PG-WAT in male and female Ai-DKO showed significantly lower stimulation of UCP1 expression in these tissues compared with Controls (Figures 4E and S4I), indicating that the regenerated WAT had some decrease in the ability to undergo browning/beiging compared to Controls.
Regeneration of BAT in Ai-DKO Mice
Regeneration of BAT in Ai-DKO occurred at a slower rate compared to WAT (Figure 5A). At day 9, the weight of BAT was reduced to ~18% of Controls, and this increased to only 37.3% of Controls by day 30, but did return to Control levels by day 180. Histologically, during this recovery period, the BAT contained both multilocular fat cells, typical of BAT, and large unilocular fat cells, resembling WAT (Figure 5B). Lineage-tracing demonstrated that generation of both the multilocular and unilocular BAT involved differentiation of new fat cells (Figure 5C). Thus, before treatment with tamoxifen, all BAT cells were red, but at day 3 after tamoxifen, more than 95% of Control-mTmG brown adipocytes were green (Figure S5A), and in Controls this fraction remained constant for 120 days, indicating effective gene recombination in BAT and little turnover of brown adipocytes in Controls over this time period (Figures S5B and S5C). BAT in Ai-DKO mice mostly converted to green by day 3 after tamoxifen, but by day 30, the majority of both the unilocular and multilocular fat cells exhibited red fluorescence (Figures 5C and S5B). This replacement by new cells became even more prominent at days 60, 90 and 120 (Figure S5B), indicating nearly complete regeneration of brown adipocytes in Ai-DKO. As in WAT, during the early phase of recovery, there was a ~4-fold increase in the percentage of preadipocytes of BAT in Ai-DKO as assessed by FACS analysis (3.17 ± 0.36% vs. 13.4 ± 3.46%) (Figure 5D). By day 180, expression of FAS, ATGL, Glut4, UCP1, AP2, Cidea and Adrb3 returned to normal BAT levels, with low levels of the beige fat markers Tmem26 and Shox2 (Figure S5D) and low levels of leptin mRNA (Figure 5E), i.e., reflecting the molecular signature of classical brown adipocyte markers. Most of the multilocular and unilocular cells were positive for UCP-1 protein (Figure 5F). By contrast, the regenerated SC- and PG-WAT showed a homogeneous population with no UCP1+ adipocytes (Figure S5E). Both thoracic and abdominal perivascular adipose tissue also regenerated during the recovery from lipodystrophy. UCP1 staining indicated that the regenerated thoracic perivascular adipose tissue more closely resembled brown fat, whereas the regenerated abdominal perivascular fat resembled subcutaneous and perigonadal WAT (Figures S5F and S5G).
Figure 5.

Brown adipocyte regeneration in Ai-DKO. (A) Recovery of tissue weights of BAT in Ai-DKO (n = 5–6) male mice at day 9, 30, and 180 after tamoxifen-treatment compared to Control (n=6–8). (B) H & E staining of BAT sections on day 9, 30 and 180. Scale bars, 50 μm. (C) mTmG lineage tracing of brown adipocytes in BAT of Control and Ai-DKO also carrying a Rosa- mTmG transgene as in Supplementary Figure 3C before and on days 3 and 30 after tamoxifen-treatment. Scale bars, 50 μm. (D) Percentage of Sca1+/CD34+ preadipocytes cells in brown adipose (Lin−) SVF at day 3 in Control (n = 10) and Ai-DKO (n = 6). (E) Relative mRNA levels in Ai-DKO (n=5–6) and Control (n = 6–7) on days 9, 30 and 180 after tamoxifen-treatment. (F) UCP1 expression in BAT assessed by anti-UCP1 immunostaining in Control and Ai-DKO at day 180. (G) Rectal temperature in Control and Ai-DKO at day 9 and 90 during a 3 h exposure to an 8 °C environment (n = 5 per group). (H) Thermal images using a FLIR T300 Infrared Camera showing surface temperature over interscapular BAT after 2 h at 8 °C between Control and Ai-DKO on day 9 and 90. Statistical significance is as in Figure 2
Sensitivity to cold exposure paralleled these changes in BAT (Figure 5G). At day 9, when BAT mass and UCP1 expression were low, Ai-DKO were highly sensitive to cold exposure (8 ºC) with a decrease in body temperature to ~20 ºC with 3 h. By day 90, however, Ai-DKO had recovered near normal temperature homeostasis, indicating significant function of the regenerated BAT (Figure 5G). Thermal imaging also demonstrated low body temperature over the interscapular region at day 9, which returned to normal by day 90, consistent with the presence of functional BAT (Figure 5H). This recovery potential was also confirmed by examining whole animal oxygen consumption rate (VO2) in metabolic cages which were initially decreased (Figure S1M) and returned to normal levels in Ai-DKO 6 weeks after tamoxifen treatment (Figure S5H). At this time both Control and DKO mice also showed a significant increase in oxygen consumption after stimulation with β3-adrenergic receptor agonist CL-316,243 (Figure S5H).
Regeneration potential of white and brown adipocytes is preserved after repeated episodes of lipodystrophy
To examine the potential of continuing adipocyte regeneration, mice which had recovered from the initial round of conditional gene inactivation were re-treated with tamoxifen at day 30. Following the second round of tamoxifen, both Ai-IRKO and Ai-DKO again rapidly developed lipodystrophy with insulin resistance, marked hyperglycemia, and hepatosteatosis similar to that observed after the first round of tamoxifen-treatment (Figures 6A, 6B and S6A–S6D). These mice again recovered by day 55 to day 65, i.e. 15–20 days after the second round of tamoxifen (Figures 6A, 6B and S6A–S6D). This second insulin resistance was associated with a second round of increased pancreatic β-cell proliferation and increased islet mass at day 41 (i.e., 6 days after the second treatment). Again β-cell replication reverted toward normal by day 65 (30 days after the second round of tamoxifen), although at this time total islet mass remained increased (6.34 ± 0.48 mg vs. 1.80 ± 0.24 mg, p<0.001) (Figures 6C–6E).
Figure 6.

Regeneration potential of WAT and BAT after two rounds of tamoxifen-treatment, with the second round given 5 times over 6 days between days 30 and 35. (A) Fed blood glucose levels after 1st and 2nd rounds of tamoxifen in Control (n = 9), Ai-IRKO (n = 6) and Ai-DKO (n = 5). (B) Serum insulin was measured in Ai-IRKO and Ai-DKO at days 40 and 65 compared with Control (n = 5–7 per group). p<0.05 = ** and p<0.001 = ***. (C) Pancreatic sections from Control and Ai-DKO were stained for insulin and Ki67 at days 41 and 65 after tamoxifen treatment. Scale bars, 100 μm. (D) Quantitation of Ki67+insulin+ cells in Control (n = 5–7) and Ai-DKO (n = 5–7) pancreas at days 41 and 65 after tamoxifen-treatment. (E) Quantitation of β-cell mass in Control (n = 4–7) and Ai-DKO (n = 4–7) pancreases at days 41 and 65. (F) HE sections of SC-WAT from Control and Ai-DKO mice at days 41 and 65. Scale bars, 50 μm. (G) Relative UCP1 mRNA levels in Ai-DKO (n = 4–6) and Controls (n = 4–10) at day 41, 65 and 155. (H) HE sections of BAT from Control and Ai-DKO at days 41, 65 and 155. Scale bars, 50 μm. (I) UCP1 expression in BAT by anti-UCP1 immunostaining in Control and Ai-DKO at days 30, 41, 65 and 155. Scale bars, 50 μm. (J) Rectal temperature in male Control and Ai-DKO taken every 30 min for 3 h during exposure to an 8 °C environment (n = 5 per group) at days 44, 65 and 125. Comparison of rectal temperature drop after 3 h of 4 °C challenge in Control and Ai-DKO (right). Statistical significance is as in Figure 2..
This recovery was accompanied by a second round of regeneration of WAT and BAT. Thus, 30 days after the second round of tamoxifen treatment (day 65), the WAT adipose depots showed relatively normal morphology, although the average diameter of the adipocytes was again increased. Again, BAT consisted of a mixture of multilocular and unilocular adipocytes. Expression of UCP-1 and ability to maintain body temperature when exposed to cold improved by day 65, but were still below normal, however this further normalized by day 155 (120 days after the second tamoxifen treatment) (Figures 6F–6J and S6D–S6G). Leptin mRNA levels in BAT, which had increased acutely following knockout of the IR/IGF1R, returned to normal by day 155.
Leptin blocks hyperglycemia and hepatic steatosis in Ai-DKO without affecting adipocyte regeneration
Like other lipodystrophy models, Ai-DKO showed the decrease of circulating leptin levels with rapid loss of both WAT and BAT (Figure 1J). Since leptin has been shown to improve hyperglycemia and metabolic syndrome in some animal models and humans with lipodystrophy (Coppari and Bjorbaek, 2012; Wang et al., 2010), we examined the effect of continuous leptin administration on development of the acute lipodystrophy and insulin resistance in Ai-DKO (Figure S7A). Leptin almost completely prevented the development of fed and fasted hyperglycemia and hyperinsulinemia compared with Controls (Figures 7A,B and S7B). This was associated with a marked reduction in the severity of insulin resistance as calculated from the HOMO-IR (Figure S7C). Leptin also caused ~25% reduction in food intake (Figure S7D) and prevented the hepatomegaly and fatty liver (Figures 7C and S7E). However, leptin did not prevent fat loss or affect the mass of WAT and BAT (Figure 7D). Interestingly, even with long-term (4 weeks) leptin treatment, which inhibited the entire cycle of hyperglycemia and hyperinsulinemia (Figure S7F), both white and brown adipocytes regeneration occurred resulting in replacement of cells by new red-labelled fat cells as monitored with mTmG lineage tracing (Figure 7E). These new adipocytes in Ai-DKO receiving leptin exhibited normal perilipin staining (Figures 7F and S7G), however total WAT and BAT mass was reduced in these leptin-treated mice compared with that of saline-treated Controls reflecting the decreased food intake (Figures 7G and S7D). The lack of leptin effect on adipocyte turnover in vivo was confirmed by in vitro studies which demonstrated that leptin treatment at concentrations up to 20 nM had minimal effect on the proliferation or differentiation of primary brown or white preadipocytes (Figures S7H–S7L).
Figure 7. Leptin inhibits the hyperglycemia and hepatic steatosis but not the regeneration of white and brown adipocytes in Ai-DKO.

(A) Effect of leptin treatment on hyperglycemia induced by gene recombination in Ai-IRKO and Ai-DKO compared to Controls (n = 5–7 per group). Leptin (10 mg/day) was administered using Alzet 1002 minipumps between day −3 and day 9 surrounding tamoxifen-treatment. (B) Fasted serum insulin concentrations at day 3 after tamoxifen-treatment with or without leptin (n = 5–7 per group). (C) Liver sections stained with Oil Red O for Control, Ai-IRKO and Ai-DKO with saline or leptin at day 3. Scale bars, 100 μm. (D) Weights of SC and BAT fat at day 9 in Ai-IRKO (Saline: n=6, leptin: n=5), Ai-DKO (Saline: n = 7, leptin: n = 6) and Control (Saline: n = 9, leptin: n = 7). (E) Immunofluorescence staining for GFP (green), Td-tomato (red) and DAPI (blue) in SC-WAT and BAT from Control mTmG and Ai-DKO mTmG, as indicated, at day 30. Scale bars, 50 μm. (F) Perilipin (green) staining of SC and BAT in Ai-DKO (with saline or leptin) at day 9 and 30. Scale bars, 50 μm. (G) Tissue weights of SC and BAT at day 30 in Ai-DKO (Saline: n = 9, leptin: n = 5) and Control (Saline: n = 9, leptin: n = 5). Statistical significance is as in Figure 2.
DISCUSSION
Insulin and IGF1 receptors are present on preadipocytes and adipocytes, and play important roles in proliferation, differentiation and metabolic function of these cells (Bluher et al., 2005; Boucher et al., 2010b; Tseng et al., 2002). In this study, using an inducible Cre to knockout of the IR and/or IGF1R, we show that loss of IR (with or without loss of IGFR1R) in mature adipocytes results in a rapid loss of adipose tissue mass. This appears to be due to a rapid development of unrestrained lipolysis and a more gradual development of an apoptotic process as demonstrated by both increased TUNEL and cleaved caspase-3 staining. This results in development of an acute state of systemic insulin resistance with hyperglycemia, hyperinsulinemia, islet hyperplasia, hepatosteatosis and cold intolerance (summarized in Figure S7M). Interestingly, this occurs without any evidence of inflammation in the adipose tissue and without any measurable increase in serum TG and FFA typically observed in chronic states of lipodystrophy both in mice and humans (Ficarella et al., 2015; Mori et al., 2014; Patni and Garg, 2015), suggesting that any released FFA and TG are rapidly taken up by other tissues such as liver. Although some reports have suggested that tamoxifen itself may induce insulin resistance (Hesselbarth et al., 2015), under the conditions of our study, there was no evidence of any metabolic change in control mice, all of which received tamoxifen.
In this form of acute insulin resistance, there is also a rapid induction of β-cell proliferation. Pancreatic β-cells normally replicate at an extremely low rate in adult mice (Teta et al., 2007), but this can be increased in response to pathophysiological stresses such as gestation (Parsons et al., 1992b), hyperglycemia (Alonso et al., 2007), and insulin resistance (Kulkarni et al., 2004). Several previous studies have shown that β-cell hyperplasia in insulin resistant states is due to an increase in one or more circulating islet growth factors (Flier et al., 2001; Saxena et al., 2010). Potential growth factors include insulin (Kulkarni et al., 1999), placental lactogen (Parsons et al., 1992a), prolactin (Brelje et al., 1994) and ANGPTL8/betatrophin (Yi et al., 2013) and serpinB1 (El Ouaamari et al., 2016), as well as hyperglycemia itself (Leahy et al., 1986). Our data demonstrate transient increases in expression of ANGPTL8/betatrophin in liver and serpinB1 in adipose tissue following induction of gene recombination; to what extent these contribute to the increase in β-cell proliferation remains to be determined.
While both Ai-IRKO and Ai-DKO mice show a rapid onset of the metabolic syndrome associated with lipodystrophy, both also show a surprisingly rapid recovery, beginning within 10 days after tamoxifen treatment. By day 30, there is an almost complete normalization of glucose and insulin levels, reduction of hepatosteatosis, and reversal of cold intolerance. This recovery is associated with a regeneration of both white and brown adipose tissue. The regenerated WAT displayed normal histology and gene expression, although it’s ability to undergo beiging when stimulated with the β3-adrenergic agonists was decreased. BAT, on the other hand, recovered to near normal tissue weight and UCP1 expression, although the regenerated BAT, especially early in recovery, showed altered morphology, containing cells with both multilocular and unilocular fat droplets, resembling human BAT rather than typical interscapular murine BAT. Both the multilocular and unilocular cells stained positively for UCP-1 indicating that they were brown or beige adipocytes. A second round of deletion of IR/IGF1R in the regenerated adipose tissue induced by a second round of tamoxifen-treatment produced an almost identical metabolic and histological response, confirming the plasticity of adipose tissue and the cellular and molecular changes in regeneration of brown and white adipocytes.
Both FACS analysis and mTmG-lineage tracing show that the recovery of WAT and BAT in Ai-DKO mice is due to increased proliferation of preadipocytes and increased differentiation of these cells into adipocytes. Thus, in control mice only about 5–7% of cells in the SVF labeled with markers of preadipocytes, and mTmG showed almost no turnover of adipocytes in either WAT or BAT over 30 days, consistent with the other studies showing a low turnover rate of adipocytes in mice on a normal diet (Jeffery et al., 2015; Wang et al., 2013). Turnover of human adipocytes in adults is also slow, estimated at ~10% per year (Arner et al., 2010; Spalding et al., 2008). By contrast, within 3 days after induction of gene recombination, Ai-DKO and Ai-IRKO have a remarkable 5- to 10-fold increase in the percentage of preadipocytes, followed by a rapid differentiation and regeneration of fat tissues, with almost 100% of the lipid-storing cells being derived from cells that did not express adiponectin at the time of the initial tamoxifen treatment. A similar regeneration of WAT has been observed when WAT is ablated by activation of caspase 8 (Pajvani et al., 2005). However, in the latter there is marked adipose tissue inflammation, which is not observed in the Ai-DKO or Ai-IRKO mice.
In the Ai-DKO and Ai-IRKO mice, recovery of the subcutaneous and visceral WAT preceded recovery of BAT, and this coincided with the recovery from the dysmetabolic state. The marked proliferation of white preadipocytes and associated adipogenesis is much greater that observed in response to high fat diet (Jeffery et al., 2015; Macotela et al., 2012) demonstrating a strong homeostatic mechanism to restore white fat mass after loss due to IR gene inactivation. An important finding of the current study is that a similar homeostatic mechanism also occurs in BAT with a large increase in preadipocytes and a new round of differentiation indicating the plasticity of this adipose depot as well. Whether this homeostatic mechanism is the result of secretion of an adipotrophic factor or loss of an adipostatic factor remains to be determined (Figure S7M), but the results clearly demonstrate a potent checkpoint in adipose biology, which attempts to restore both white and brown adipose mass to normal levels.
In Ai-DKO mice, regeneration of brown, UCP1-expressing adipocytes occurs almost exclusively in the interscapular region, the site of classical brown fat (Gesta et al., 2007). Whether these are derived from a Myf-5-positive lineage like classical brown adipocytes (Harms and Seale, 2013) remains to be determined, but the regenerated interscapular BAT shows a heterogeneous cell population with both multilocular and unilocular cells, similar to human cervical BAT (Cypess et al., 2013). The regenerated WAT, on the other hand shows a homogeneous population of unilocular cells without any apparent beige-like adipocytes and a low level of UCP-1 compared with BAT. Gene expression analysis of the recovered interscapular BAT shows the molecular signature of classical brown adipocyte markers, with no increase in the beige fat markers, Tmem26 and Shox2 (Jespersen et al., 2013; Sharp et al., 2012; Wu et al., 2012). Whether the heterogeneity of the brown adipocytes during recovery represents some alteration in the maturation of brown adipocytes in this rapid turnover state or represents a developmental difference is unclear, but it is clear that after recovery, the new BAT is functional for normal thermogenesis.
Leptin is produced by adipose tissue and regulates food intake and systemic metabolism by acting primarily on leptin receptors of the central nervous system (Coppari and Bjorbaek, 2012). Remarkably, leptin administration almost completely suppressed the development of hepatosteatosis, hyperglycemia, hyperinsulinemia and hyperphagia in Ai-DKO. Leptin, however, did not cause any change in the loss or regeneration of white and brown adipocytes occurring in Ai-DKO mouse, indicating that adipose tissue regeneration is regulated by factor(s) other than hyperinsulinemia, hyperglycemia, leptin, and food intake.
In summary, mature adipocytes are highly dependent on insulin signaling for maintenance, as well as function. Loss of insulin signaling results in acute lipodystrophy with loss of virtually all existing mature adipocytes and severe systemic insulin resistance with its associated metabolic features. Our data show that adult adipose tissues also possess a strong homeostatic mechanism, such that following loss of insulin signaling, there is a rapid proliferation of preadipocytes and regeneration of new brown and white adipocytes restoring metabolic homeostasis and reversing the metabolic syndrome associated with the lipodystrophy, including both the β-cell proliferation and cold intolerance (summarized in Figure S7M). Targeting this homeostatic mechanism could provide a novel point for the treatment of diseases with either fat excess or fat loss by slowing the expansion of white adipose mass while increasing functional brown adipose tissue.
EXPERIMENTAL PROCEDURES
Mice
Mice were housed at 20–22 °C on a 12 h-light/dark cycle in the animal facility at the Joslin Diabetes Center, MA, USA. All animal studies were approved by the Institutional Animal Care and Use Committee (IACUC) and were in accordance with NIH guidelines. Additional information about animal studies is described in Supplementary Experimental Procedures.
Metabolic studies
Oral glucose tolerance tests (2 g dextrose/kg bw) were performed in unrestrained conscious mice fasted for 6 h. Insulin tolerance tests (1 unit/kg bw, Human R, Lilly) were performed after a 6 h fast. Glucose levels were measured in tail vein blood using Infinity glucose monitors (US Diagnostics). Whole-body energy expenditure was measured at ambient temperature (~22° C) using a Comprehensive Lab Animal Monitoring System. To examine response to adrenergic stimulation mice were injected intraperitoneally with a β3-adrenergic receptor-specific agonist CL-316,243 1 mg/kg (Cannon and Nedergaard, 2011). Insulin, leptin, adiponectin, TG and FFA were measured by ELISA (Crystal Chem).
Ex vivo lipolysis assay in adipose tissues
Lipolysis was assessed as described before (Garcia-Martin, et al., 2016). Briefly subcutaneous and perigonadal fat depots were surgically removed from 8-week-old Control and Ai-DKO 1.5 days after the last dose of tamoxifen and washed with cold PBS. A piece of 25mg was further cut into 5–6 pieces, and incubated for 2 h at 37°C in 200μl of Dulbecco modified Eagle’s medium (DMEM) containing 2% fatty acid-free BSA (Sigma-Aldrich) and in the presence or absence of 10 μM isoprenaline (Sigma-Aldrich). Fatty acids released to the medium were quantified using a free fatty acid fluorometric assay kit (Cayman Chemical) and normalized to the weight of each fat pad.
Histopathology and immunohistochemistry
Tissues were fixed in 10% formalin, subjected to paraffin-embedded sectioning and stained with hematoxylin or immunostained with anti-UCP1 (Sigma) and anti-perilipin A (Abcam) antibodies. TUNEL (terminal deoxynucleotidyl transferase dUTP-mediated nick end labelling) (Promega) and cleaved caspase-3 (Cell signaling) immunostaining were performed per manufacturer’s instructions. Additional information is described in the Supplementary Experimental Procedures.
Sorting of Adipocyte Precursor Cells/Preadipocytes
SVF was obtained from subcutaneous WAT or interscapular BAT by treatment with 2 mg/ml collagenase (Sigma) for 45 min at 37 °C. The isolated SVF was resuspended in cold Hank’s balanced salt solution (HBSS) with 2% fetal bovine serum (FBS). Cells were incubated with Ter119-PE-Cy7 (BD Pharmingen™), CD31-PE-Cy7 (Biolegend), CD45-PE-Cy7 (Biolegend), CD34-APC (eBioscience), and Sca-1-BV421 (Biolegend) antibodies for 30 min in HBSS containing 2% FBS on ice, then washed and resuspended in solution with propidium iodide (Sigma-Aldrich). Cells were analyzed on a BD FACSAria cell sorter after selection by forward scatter (FSC) and side scatter (SSC), followed by exclusion of dead cells with propidium iodide staining, and analyzed for cell-surface markers using FlowJo software (TreeStar, Inc.). The data are shown as the percentage of Sca1+ and CD34 + and lineage-negative (Lin−) cells, as well as the number of total preadipocytes per depot.
Lineage tracing system of adipocytes
Rosa-mTmG (Jax no. 007676) were purchased from Jackson Laboratories and bred to Adiponectin-Cre ERT2, Ai-IRKO and Ai-DKO. The adipose depots were fixed in 10% formalin. Whole mount 3D (Z-stack) imaging was performed using a 2-photon microscope (Zeiss 710) optimized for td-Tomato and eGFP expression.
Tissue triglyceride quantification
Liver samples (100 mg) were homogenized in 1 ml Folch solution (2:1 v/v chloroform/methanol) and centrifuged at 15,000 rpm for 15 min. The supernatants were collected, and TG content determined using Infinity Triglycerides Reagent kit (Thermo Scientific).
Body temperature and cold exposure
Body temperatures of mice were measured using a RET-3 rectal probe (Physitemp) as described in Supplementary Experimental Procedures.
Quantitative RT-PCR
Total RNA was extracted from tissues with an RNeasy minikit (Qiagen), and complementary DNA (cDNA) was synthesized with a high-capacity cDNA reverse-transcription kit (Applied Biosystems). Additional information is described in the Supplementary Experimental Procedures.
Administration of leptin by micro-osmotic pump implantation
8-week-old mice were given a dose of 10 μg/day of recombinant mouse leptin (Sigma) dissolved in sterile saline and administered via Alzet mini-osmotic pumps (DURECT Corp.) designed for either 2 or 4 weeks’ infusion. Pumps were implanted subcutaneously on day 3 before the final dose of tamoxifen treatment. Saline filled pumps were implanted in the Control groups.
β-cell histology and proliferation
β-cell counting was performed manually in a blinded manner by a single observer. Ki67+ β-cells, i.e., insulin+ cells showing nuclear DAPI staining, were assessed by immunofluorescence microscopy. Insulin+ cells showing co-localized nuclear staining for DAPI and Ki67 were counted as proliferating β-cells. The double-positive cells (Ins+/Ki67+) were confirmed in randomly selected cells in all experiments by confocal microscopy. Additional information is described in the Supplementary Experimental Procedures.
Statistics
All data are presented as mean ± S.E.M. and analyzed by Student’s t-test or analyses of variance (ANOVA) followed by post hoc comparisons as appropriate. N indicates the number of animals per group or number of independent experiments. Results were considered significant if p<0.05.
Supplementary Material
Acknowledgments
We thank T. Roderick Bronson and C. Penniman for assistance and the Animal Physiology Core at the Joslin Diabetes Center for performing and interpreting the comprehensive lab animal monitoring system and dual-energy X-ray absorptiometry analysis. This work was supported by NIH grants R37DK031036 and R01DK082659 to CRK; R01DK67536 and R01DK103215 to RNK; the Diabetes Endocrinology Research Center Grant P30DK034834 and the Mary K. Iacocca Professorship. M.S. was supported by the Manpei Suzuki Diabetes Foundation and a fellowship from the Japan Society for the Promotion of Science.
Footnotes
AUTHOR CONTRIBUTIONS
M.S. designed and performed the experiments, analyzed data and wrote the paper. S.F., W.K., J.N.F., M.K., B.O., M.L., R.G.M. and H.T. helped to perform the experiments. J.H. performed analyses of beta cell mass and proliferation. R.N.K. supervised the islet work and edited the manuscript. C.R.K. designed the experiments, wrote the paper and supervised the project.
COMPETING FINANCIAL INTERESTS
The authors declare no competing financial interests.
Publisher's Disclaimer: This is a PDF file of an unedited manuscript that has been accepted for publication. As a service to our customers we are providing this early version of the manuscript. The manuscript will undergo copyediting, typesetting, and review of the resulting proof before it is published in its final citable form. Please note that during the production process errors may be discovered which could affect the content, and all legal disclaimers that apply to the journal pertain.
References
- Alonso LC, Yokoe T, Zhang P, Scott DK, Kim SK, O’Donnell CP, Garcia-Ocana A. Glucose infusion in mice: a new model to induce beta-cell replication. Diabetes. 2007;56:1792–1801. doi: 10.2337/db06-1513. [DOI] [PMC free article] [PubMed] [Google Scholar]
- Arner E, Westermark PO, Spalding KL, Britton T, Ryden M, Frisen J, Bernard S, Arner P. Adipocyte turnover: relevance to human adipose tissue morphology. Diabetes. 2010;59:105–109. doi: 10.2337/db09-0942. [DOI] [PMC free article] [PubMed] [Google Scholar]
- Arner P, Bernard S, Salehpour M, Possnert G, Liebl J, Steier P, Buchholz BA, Eriksson M, Arner E, Hauner H, et al. Dynamics of human adipose lipid turnover in health and metabolic disease. Nature. 2011;478:110–113. doi: 10.1038/nature10426. [DOI] [PMC free article] [PubMed] [Google Scholar]
- Bluher M, Michael MD, Peroni OD, Ueki K, Carter N, Kahn BB, Kahn CR. Adipose tissue selective insulin receptor knockout protects against obesity and obesity-related glucose intolerance. Dev Cell. 2002;3:25–38. doi: 10.1016/s1534-5807(02)00199-5. [DOI] [PubMed] [Google Scholar]
- Bouchard C, Despres JP, Mauriege P. Genetic and nongenetic determinants of regional fat distribution. EndocrRev. 1993;14:72–93. doi: 10.1210/edrv-14-1-72. [DOI] [PubMed] [Google Scholar]
- Boucher J, Macotela Y, Bezy O, Mori MA, Kriauciunas K, Kahn CR. A kinase-independent role for unoccupied insulin and IGF-1 receptors in the control of apoptosis. Sci Signal. 2010;3:ra87. doi: 10.1126/scisignal.2001173. [DOI] [PMC free article] [PubMed] [Google Scholar]
- Boucher J, Mori MA, Lee KY, Smyth G, Liew CW, Macotela Y, Rourk M, Bluher M, Russell SJ, Kahn CR. Impaired thermogenesis and adipose tissue development in mice with fat-specific disruption of insulin and IGF-1 signalling. Nat Commun. 2012;3:902. doi: 10.1038/ncomms1905. [DOI] [PMC free article] [PubMed] [Google Scholar]
- Brelje TC, Parsons JA, Sorenson RL. Regulation of islet beta-cell proliferation by prolactin in rat islets. Diabetes. 1994;43:263–273. doi: 10.2337/diab.43.2.263. [DOI] [PubMed] [Google Scholar]
- Cannon B, Nedergaard J. Nonshivering thermogenesis and its adequate measurement in metabolic studies. The Journal of experimental biology. 2011;214:242–253. doi: 10.1242/jeb.050989. [DOI] [PubMed] [Google Scholar]
- Coppari R, Bjorbaek C. Leptin revisited: its mechanism of action and potential for treating diabetes. Nat Rev Drug Discov. 2012;11:692–708. doi: 10.1038/nrd3757. [DOI] [PMC free article] [PubMed] [Google Scholar]
- Cypess AM, White AP, Vernochet C, Schulz TJ, Xue R, Sass CA, Huang TL, Roberts-Toler C, Weiner LS, Sze C, et al. Anatomical localization, gene expression profiling and functional characterization of adult human neck brown fat. Nat Med. 2013;19:635–639. doi: 10.1038/nm.3112. [DOI] [PMC free article] [PubMed] [Google Scholar]
- El Ouaamari A, Dirice E, Gedeon N, Hu J, Zhou JY, Shirakawa J, Hou L, Goodman J, Karampelias C, Qiang G, et al. SerpinB1 Promotes Pancreatic beta Cell Proliferation. Cell Metab. 2016;23:194–205. doi: 10.1016/j.cmet.2015.12.001. [DOI] [PMC free article] [PubMed] [Google Scholar]
- Enerback S, Jacobsson A, Simpson EM, Guerra C, Yamashita H, Harper ME, Kozak LP. Mice lacking mitochondrial uncoupling protein are cold-sensitive but not obese. Nature. 1997;387:90–94. doi: 10.1038/387090a0. [DOI] [PubMed] [Google Scholar]
- Ficarella R, Laviola L, Giorgino F. Lipodystrophic diabetes mellitus: a lesson for other forms of diabetes? Curr Diab Rep. 2015;15:12. doi: 10.1007/s11892-015-0578-5. [DOI] [PubMed] [Google Scholar]
- Flier SN, Kulkarni RN, Kahn CR. Evidence for a circulating islet cell growth factor in insulin-resistant states. Proc Natl Acad Sci U S A. 2001;98:7475–7480. doi: 10.1073/pnas.131192998. [DOI] [PMC free article] [PubMed] [Google Scholar]
- Garcia-Martin R, Alexaki VI, Qin N, Rubin de Celis MF, Economopoulou M, Ziogas A, Gercken B, Kotlabova K, Phieler J, Ehrhart-Bornstein M, et al. Adipocyte-Specific Hypoxia-Inducible Factor 2alpha Deficiency Exacerbates Obesity-Induced Brown Adipose Tissue Dysfunction and Metabolic Dysregulation. Mol Cell Biol. 2016;36:376–393. doi: 10.1128/MCB.00430-15. [DOI] [PMC free article] [PubMed] [Google Scholar]
- Gesta S, Tseng YH, Kahn CR. Developmental origin of fat: tracking obesity to its source. Cell. 2007;131:242–256. doi: 10.1016/j.cell.2007.10.004. [DOI] [PubMed] [Google Scholar]
- Harms M, Seale P. Brown and beige fat: development, function and therapeutic potential. Nat Med. 2013;19:1252–1263. doi: 10.1038/nm.3361. [DOI] [PubMed] [Google Scholar]
- Haslam DW, James WP. Obesity. Lancet. 2005;366:1197–1209. doi: 10.1016/S0140-6736(05)67483-1. [DOI] [PubMed] [Google Scholar]
- Hesselbarth N, Pettinelli C, Gericke M, Berger C, Kunath A, Stumvoll M, Bluher M, Kloting N. Tamoxifen affects glucose and lipid metabolism parameters, causes browning of subcutaneous adipose tissue and transient body composition changes in C57BL/6NTac mice. Biochem Biophys Res Commun. 2015;464:724–729. doi: 10.1016/j.bbrc.2015.07.015. [DOI] [PubMed] [Google Scholar]
- Hotamisligil GS. Inflammation and metabolic disorders. Nature. 2006;444:860–867. doi: 10.1038/nature05485. [DOI] [PubMed] [Google Scholar]
- Jeffery E, Church CD, Holtrup B, Colman L, Rodeheffer MS. Rapid depot-specific activation of adipocyte precursor cells at the onset of obesity. Nat Cell Biol. 2015;17:376–385. doi: 10.1038/ncb3122. [DOI] [PMC free article] [PubMed] [Google Scholar]
- Jespersen NZ, Larsen TJ, Peijs L, Daugaard S, Homoe P, Loft A, de Jong J, Mathur N, Cannon B, Nedergaard J, et al. A classical brown adipose tissue mRNA signature partly overlaps with brite in the supraclavicular region of adult humans. Cell Metab. 2013;17:798–805. doi: 10.1016/j.cmet.2013.04.011. [DOI] [PubMed] [Google Scholar]
- Kulkarni RN, Bruning JC, Winnay JN, Postic C, Magnuson MA, Kahn CR. Tissue-specific knockout of the insulin receptor in pancreatic beta cells creates an insulin secretory defect similar to that in type 2 diabetes. Cell. 1999;96:329–339. doi: 10.1016/s0092-8674(00)80546-2. [DOI] [PubMed] [Google Scholar]
- Kulkarni RN, Jhala US, Winnay JN, Krajewski S, Montminy M, Kahn CR. PDX-1 haploinsufficiency limits the compensatory islet hyperplasia that occurs in response to insulin resistance. J Clin Invest. 2004;114:828–836. doi: 10.1172/JCI21845. [DOI] [PMC free article] [PubMed] [Google Scholar]
- Leahy JL, Cooper HE, Deal DA, Weir GC. Chronic hyperglycemia is associated with impaired glucose influence on insulin secretion. A study in normal rats using chronic in vivo glucose infusions. J Clin Invest. 1986;77:908–915. doi: 10.1172/JCI112389. [DOI] [PMC free article] [PubMed] [Google Scholar]
- Macotela Y, Emanuelli B, Mori MA, Gesta S, Schulz TJ, Tseng YH, Kahn CR. Intrinsic differences in adipocyte precursor cells from different white fat depots. Diabetes. 2012;61:1691–1699. doi: 10.2337/db11-1753. [DOI] [PMC free article] [PubMed] [Google Scholar]
- Michael MD, Kulkarni RN, Postic C, Previs SF, Shulman GI, Magnuson MA, Kahn CR. Loss of insulin signaling in hepatocytes leads to severe insulin resistance and progressive hepatic dysfunction. Mol Cell. 2000;6:87–97. [PubMed] [Google Scholar]
- Mori MA, Thomou T, Boucher J, Lee KY, Lallukka S, Kim JK, Torriani M, Yki-Jarvinen H, Grinspoon SK, Cypess AM, et al. Altered miRNA processing disrupts brown/white adipocyte determination and associates with lipodystrophy. J Clin Invest. 2014;124:3339–3351. doi: 10.1172/JCI73468. [DOI] [PMC free article] [PubMed] [Google Scholar]
- Muzumdar MD, Tasic B, Miyamichi K, Li L, Luo L. A global double-fluorescent Cre reporter mouse. Genesis. 2007;45:593–605. doi: 10.1002/dvg.20335. [DOI] [PubMed] [Google Scholar]
- Pajvani UB, Trujillo ME, Combs TP, Iyengar P, Jelicks L, Roth KA, Kitsis RN, Scherer PE. Fat apoptosis through targeted activation of caspase 8: a new mouse model of inducible and reversible lipoatrophy. Nat Med. 2005;11:797–803. doi: 10.1038/nm1262. [DOI] [PubMed] [Google Scholar]
- Parsons JA, Brelje TC, Sorenson RL. Adaptation of islets of Langerhans to pregnancy: increased islet cell proliferation and insulin secretion correlates with the onset of placental lactogen secretion. Endocrinology. 1992a;130:1459–1466. doi: 10.1210/endo.130.3.1537300. [DOI] [PubMed] [Google Scholar]
- Parsons JA, Brelje TC, Sorenson RL. Adaptation of islets to pregnancy: Increased islet cell proliferation and insulin secretion correlates with the onset of placental lactogen secretion. Endocrinology. 1992b;130:1459–1466. doi: 10.1210/endo.130.3.1537300. [DOI] [PubMed] [Google Scholar]
- Patni N, Garg A. Congenital generalized lipodystrophies--new insights into metabolic dysfunction. Nat Rev Endocrinol. 2015;11:522–534. doi: 10.1038/nrendo.2015.123. [DOI] [PMC free article] [PubMed] [Google Scholar]
- Poher AL, Altirriba J, Veyrat-Durebex C, Rohner-Jeanrenaud F. Brown adipose tissue activity as a target for the treatment of obesity/insulin resistance. Front Physiol. 2015;6:4. doi: 10.3389/fphys.2015.00004. [DOI] [PMC free article] [PubMed] [Google Scholar]
- Rodeheffer MS, Birsoy K, Friedman JM. Identification of white adipocyte progenitor cells in vivo. Cell. 2008;135:240–249. doi: 10.1016/j.cell.2008.09.036. [DOI] [PubMed] [Google Scholar]
- Rosen ED, Spiegelman BM. Adipocytes as regulators of energy balance and glucose homeostasis. Nature. 2006;444:847–853. doi: 10.1038/nature05483. [DOI] [PMC free article] [PubMed] [Google Scholar]
- Sassmann A, Offermanns S, Wettschureck N. Tamoxifen-inducible Cre-mediated recombination in adipocytes. Genesis. 2010;48:618–625. doi: 10.1002/dvg.20665. [DOI] [PubMed] [Google Scholar]
- Saxena R, Hivert MF, Langenberg C, Tanaka T, Pankow JS, Vollenweider P, Lyssenko V, Bouatia-Naji N, Dupuis J, Jackson AU, et al. Genetic variation in GIPR influences the glucose and insulin responses to an oral glucose challenge. Nat Genet. 2010;42:142–148. doi: 10.1038/ng.521. [DOI] [PMC free article] [PubMed] [Google Scholar]
- Seale P, Bjork B, Yang W, Kajimura S, Chin S, Kuang S, Scime A, Devarakonda S, Conroe HM, Erdjument-Bromage H, et al. PRDM16 controls a brown fat/skeletal muscle switch. Nature. 2008;454:961–967. doi: 10.1038/nature07182. [DOI] [PMC free article] [PubMed] [Google Scholar]
- Sharp LZ, Shinoda K, Ohno H, Scheel DW, Tomoda E, Ruiz L, Hu H, Wang L, Pavlova Z, Gilsanz V, et al. Human BAT possesses molecular signatures that resemble beige/brite cells. PLOS One. 2012;7:e49452. doi: 10.1371/journal.pone.0049452. [DOI] [PMC free article] [PubMed] [Google Scholar]
- Shinoda K, Luijten IH, Hasegawa Y, Hong H, Sonne SB, Kim M, Xue R, Chondronikola M, Cypess AM, Tseng YH, et al. Genetic and functional characterization of clonally derived adult human brown adipocytes. Nat Med. 2015;21:389–394. doi: 10.1038/nm.3819. [DOI] [PMC free article] [PubMed] [Google Scholar]
- Spalding KL, Arner E, Westermark PO, Bernard S, Buchholz BA, Bergmann O, Blomqvist L, Hoffstedt J, Naslund E, Britton T, et al. Dynamics of fat cell turnover in humans. Nature. 2008;453:783–787. doi: 10.1038/nature06902. [DOI] [PubMed] [Google Scholar]
- Tang W, Zeve D, Suh J, Bosnakovski D, Kyba M, Hammer B, Tallquist MD, Graff JM. White Fat Progenitor Cells Reside in the Adipose Vasculature. Science. 2008;322:583–586. doi: 10.1126/science.1156232. [DOI] [PMC free article] [PubMed] [Google Scholar]
- Teta M, Rankin MM, Long SY, Stein GM, Kushner JA. Growth and regeneration of adult beta cells does not involve specialized progenitors. Dev Cell. 2007;12:817–826. doi: 10.1016/j.devcel.2007.04.011. [DOI] [PubMed] [Google Scholar]
- Tseng YH, Cypess AM, Kahn CR. Cellular bioenergetics as a target for obesity therapy. Nat Rev Drug Discov. 2010;9:465–482. doi: 10.1038/nrd3138. [DOI] [PMC free article] [PubMed] [Google Scholar]
- Tseng YH, Ueki K, Kriauciunas KM, Kahn CR. Differential roles of insulin receptor substrates in the anti-apoptotic function of insulin-like growth factor-1 and insulin. J Biol Chem. 2002;277:31601–31611. doi: 10.1074/jbc.M202932200. [DOI] [PubMed] [Google Scholar]
- Vishvanath L, MacPherson KA, Hepler C, Wang QA, Shao M, Spurgin SB, Wang MY, Kusminski CM, Morley TS, Gupta RK. Pdgfrbeta(+) Mural Preadipocytes Contribute to Adipocyte Hyperplasia Induced by High-Fat-Diet Feeding and Prolonged Cold Exposure in Adult Mice. Cell Metab. 2016;23:350–359. doi: 10.1016/j.cmet.2015.10.018. [DOI] [PMC free article] [PubMed] [Google Scholar]
- Wang MY, Chen L, Clark GO, Lee Y, Stevens RD, Ilkayeva OR, Wenner BR, Bain JR, Charron MJ, Newgard CB, et al. Leptin therapy in insulin-deficient type I diabetes. Proc Natl Acad Sci U S A. 2010;107:4813–4819. doi: 10.1073/pnas.0909422107. [DOI] [PMC free article] [PubMed] [Google Scholar]
- Wang QA, Tao C, Gupta RK, Scherer PE. Tracking adipogenesis during white adipose tissue development, expansion and regeneration. Nat Med. 2013;19:1338–1344. doi: 10.1038/nm.3324. [DOI] [PMC free article] [PubMed] [Google Scholar]
- Weiss R, Dziura J, Burgert TS, Tamborlane WV, Taksali SE, Yeckel CW, Allen K, Lopes M, Savoye M, Morrison J, et al. Obesity and the metabolic syndrome in children and adolescents. N Engl J Med. 2004;350:2362–2374. doi: 10.1056/NEJMoa031049. [DOI] [PubMed] [Google Scholar]
- Wu J, Bostrom P, Sparks LM, Ye L, Choi JH, Giang AH, Khandekar M, Virtanen KA, Nuutila P, Schaart G, et al. Beige adipocytes are a distinct type of thermogenic fat cell in mouse and human. Cell. 2012;150:366–376. doi: 10.1016/j.cell.2012.05.016. [DOI] [PMC free article] [PubMed] [Google Scholar]
- Xue R, Lynes MD, Dreyfuss JM, Shamsi F, Schulz TJ, Zhang H, Huang TL, Townsend KL, Li Y, Takahashi H, et al. Clonal analyses and gene profiling identify genetic biomarkers of the thermogenic potential of human brown and white preadipocytes. Nat Med. 2015;21:760–768. doi: 10.1038/nm.3881. [DOI] [PMC free article] [PubMed] [Google Scholar]
- Yi P, Park JS, Melton DA. Betatrophin: a hormone that controls pancreatic beta cell proliferation. Cell. 2013;153:747–758. doi: 10.1016/j.cell.2013.04.008. [DOI] [PMC free article] [PubMed] [Google Scholar] [Retracted]
Associated Data
This section collects any data citations, data availability statements, or supplementary materials included in this article.