

Abstract
We review epidemiological evidence indicating that most people will develop a diagnosable mental disorder, suggesting that only a minority experience enduring mental health. This minority has received little empirical study, leaving the prevalence and predictors of enduring mental health unknown. We turn to the population-representative Dunedin cohort, followed from birth to midlife, to compare people never-diagnosed with mental disorder (N = 171; 17% prevalence) to those diagnosed at 1–2 study waves, the cohort mode (N = 409). Surprisingly, compared to this modal group, never-diagnosed Study members were not born into unusually well-to-do families, nor did their enduring mental health follow markedly sound physical health, or unusually high intelligence. Instead, they tended to have an advantageous temperament/personality style, and negligible family history of mental disorder. As adults, they report superior educational and occupational attainment, greater life satisfaction, and higher-quality relationships. Our findings draw attention to “enduring mental health” as a revealing psychological phenotype and suggest it deserves further study.
Keywords: mental health, well-being, psychiatric disorder, epidemiology
General Scientific Summary
This study reviews evidence indicating that the experience of a diagnosable mental disorder at some point during the life course is the norm, not the exception. Our results suggest that the comparatively few individuals who manage to avoid such conditions owe their extraordinary mental health to an advantageous personality style and lack of family history of disorder, but not to childhood socioeconomic privilege, superior health, or high intelligence.
This article reports an investigation of individuals who manage to live for decades without experiencing a mental disorder: the phenomenon of “enduring mental health.” It has been widely assumed that individuals who experience mental disorder are relatively rare in the population, and, conversely, that individuals whose lives remain free from mental disorder are highly prevalent, commonplace, and therefore unremarkable. This assumption is reasonable if based on the point-prevalence of mental disorder in a cross-section of the population at any single point in time. However, new lifetime data are revealing that individuals who experience mental disorder are highly prevalent in the population and as a result of this high lifetime prevalence, individuals whose lives remain free from mental disorder are, in fact, remarkably few in number. Within the past decade, estimates from an array of population-representative samples have converged to suggest that a diagnosable disturbance in emotional or behavioral functioning at some point in the life course is near-universal. This novel observation led us to ask a question missing from the discussion of mental disorders in contemporary society: If nearly everyone will eventually develop a diagnosable mental disorder, what accounts for the distinct minority of individuals who manage to avoid such conditions?
As a result of the lack of awareness that enduring mental health is so statistically unusual, it has not previously attracted scientific interest, and thus it has not been a topic of investigation as a phenotype. To our knowledge, there are no prior studies of it. The consequent knowledge gap about enduring mental health should be filled by research, because if individuals who sustain enduring mental health have special characteristics or life experiences that distinguish them from individuals with more commonplace psychiatric histories, then such discerning characteristics might become interesting new targets for prevention and treatment research. We note a potential parallel to gerontologists’ study of rare individuals with unusually enduring physical health: centenarians. Much is being learned by comparing centenarians against individuals whose aging histories are more commonplace (i.e., characterized by age-related physical disorders). Researchers comparing centenarians to normative agers aim to uncover secrets to successful aging and identify new therapeutic targets. New therapeutic targets are likewise needed in mental health, because mental disorders are the leading cause of years lost to disability worldwide (Whiteford et al., 2013), and are associated with higher health care utilization, a more-than-doubled mortality rate, and a loss of life expectancy of about 10 years (Walker, McGee, & Druss, 2015).
This article has two overarching aims. First, we aim to draw attention to just how common mental disorders are, and, in doing so, inform discussions surrounding etiological theories of mental disorder, societal perceptions of stigma, and prevention efforts. Second, we aim to encourage researchers to shift scientific inquiry from an exclusive focus on the etiology of mental illness toward investigation of the etiology of enduring mental wellness. Just as research on the predictors and correlates of specific mental disorders has contributed substantially to the prediction, prevention, and treatment of these conditions, so too might research on the predictors of enduring mental health provide insight into how clinicians and policymakers can promote its spread in order to reduce both societal burden and individual suffering. This article addresses the knowledge gap about enduring mental health by reporting basic descriptive information about its prevalence, predictors, and correlates. Because readers may reasonably doubt our claim that the experience of diagnosable mental disorder is near universal, the first section of this article reviews existing prevalence findings that document the high lifetime prevalence of mental disorder and the logical basis for our claim that enduring mental health warrants scientific study. The second section then presents an empirical study in which we identified members of a repeatedly assessed, longitudinal cohort who experienced enduring mental health (i.e., an absence of disorder) for close to 3 decades, and analyzed their life circumstances, personal characteristics, and family histories.
A Qualitative Review of the Prevalence of Not Having a Mental Disorder
To date, researchers who have attempted to quantify the proportion of the population that suffers from any kind of diagnosable mental health problem have used data from three sources: (a) national registries, (b) retrospective surveys, and (c) prospective cohort studies.
Lifetime prevalence estimates generated by national registry data are shown as green bars in Figure 1. These (sex-specific) prevalence rates drawn from the Danish Civil Registration System capture the proportion of the Danish population who received treatment in a psychiatric setting between 2000 and 2012, placing the overall lifetime risk of being treated for a mental disorder at approximately 1 in 3, in this country with a national health system (Pedersen et al., 2014). However, because many people with a mental disorder either do not seek treatment or do so in nonpsychiatric medical settings, these estimates can be more accurately thought of as the lower boundary of the proportion of the population who experience a mental disorder during their lives (The WHO World Mental Health Survey Consortium, 2004).
Figure 1.

Proportion of cohort members in each study with a lifetime diagnosis of one or more mental disorders (see Table 1 for Study characteristics). Error bars represent 95% confidence intervals. Green bars represent estimates drawn from Danish registry data. Blue bars represent estimates from cross-sectional epidemiological surveys. Red bars represent estimates from prospective longitudinal studies with repeated mental health assessments. The estimates shown for the Christchurch Study and Dunedin Study are based on subsets (N = 1,041 and 988, respectively) of the full cohorts (N = 1,265 and 1,037, respectively) who contributed data to 3 + assessment waves. Age Range = age of cohort members at first mental health assessment, presented as a single number, range, or as “mean (SD)” where appropriate. No. of assessments = number of assessment waves in each longitudinal study; Length of follow-up = duration of longitudinal follow-up across assessments.
A second group of prevalence estimates comes from nationally representative, retrospective epidemiological surveys, such as the Epidemiological Catchment Area (ECA) Study (Regier & Robins, 1991), the National Comorbidity Survey (NCS; Kessler et al., 1994), the National Comorbidity Survey Replication (NCS-R; Kessler et al., 2005), and the National Epidemiologic Survey on Alcohol and Related Conditions (NESARC; Compton, Thomas, Stinson, & Grant, 2007; Hasin, Stinson, Ogburn, & Grant 2007). As shown by the blue bars in Figure 1, these large surveys have reported that roughly half of all citizens will develop a diagnosable mental disorder over the course of their lives (Kessler et al., 1994, 2005). An important advantage of these studies is that, unlike national registers, they count all cases of disorder irrespective of service use. However, because such surveys are cross-sectional (i.e., rely on a single retrospective report), the lifetime prevalence estimates drawn from these data are biased downward by methodological limitations such as recall failure (Simon & VonKorff, 1995). Moreover, this undercounting of disorder cases may be exacerbated by selective participation, as individuals with mental disorders—particularly severe mental disorders that result in homelessness, institutionalization, or survey refusal—are less likely to be recruited and interviewed.
Finally, a third group of mental disorder prevalence estimates comes from prospective, longitudinal studies, which interview participants repeatedly about psychiatric symptoms and then aggregate disorders across multiple time points to calculate lifetime rates. Although such studies involve fewer participants than epidemiological surveys or national registers, they also boast several advantages that contribute to significantly higher prevalence estimates (Haeny, Littlefield, & Sher, 2014; Moffitt et al., 2010; Takayanagi et al., 2014). Like surveys, longitudinal studies count cases irrespective of service use. In addition, they typically employ shorter recall periods (e.g., 6–12 months) than epidemiological surveys, thereby minimizing the odds of recall failure. Finally, repeated contact with research staff in the context of a longitudinal study may directly facilitate the disclosure of psychiatric symptoms through a heightened sense of trust that accumulates over multiple interviews.
The red bars in Figure 1 display prevalence estimates drawn from five longitudinal studies. In order to be included in Figure 1, longitudinal studies had to (a) report cumulative mental disorder lifetime prevalence estimates aggregated across multiple assessment waves, (b) administer at least 3 separate diagnostic assessments over time, and (c) assess a wide variety of conditions, including those drawn from each of the three most common disorder “families”: depressive disorders, anxiety disorders, and substance-use disorders. As shown in Figure 1, the proportion of participants in these studies diagnosed with a mental disorder ranged from 61.1% to 85.3%—between roughly 1.3 and 1.8 times as high as corresponding estimates drawn from the NCS/NCS-R, and more than twice as high as estimates drawn from Danish registry data, with no overlap in confidence intervals. There was also variation among longitudinal studies, with higher lifetime prevalence estimates tending to come from studies with more frequent assessments and lengthier follow-up periods (Table 1).
Table 1. Characteristics of Studies Included in Figure 1.
| Source | Cohort | Assessment instrument | Classification system |
|---|---|---|---|
| a Lifetime estimates for the Christchurch Health and Development Study were provided by L. J. Horwood, October 7, 2015. | |||
| Registry data | |||
| Pedersen et al. (2014) | Danish Registry Data. All Danish residents (N = approx. 5.6 million) | Individuals were classified with a mental disorder if they had been admitted to a psychiatric hospital, received outpatient psychiatric care, or visited a psychiatric emergency unit. | ICD–8, ICD–9, ICD–10 |
| Epidemiological surveys | |||
| Kessler et al. (1994) | National Comorbity Survey (NCS). Stratified, multistage area probability sample of persons aged 15 to 54 in the noninstitutionalized civilian population in the 48 coterminous United States (N = 8098). | Modified version of the Composite International Diagnostic Interview (CIDI) | DSM–III–R |
| Kessler et al. (2005) | National Comorbity Survey Replication (NCS-R). Nationally-representative sample of English-speaking household residents aged 18 years or older in the coterminous United States (N = 9282). | World Mental Health Survey Initiative Version of the World Health Organization Composite International Diagnostic Interview (WMH-CIDI). | DSM–IV |
| Longitudinal studies | |||
| Copeland et al. (2011) | Great Smoky Mountains Cohort. A representative sample of three cohorts of children ages 9, 11, and 13 years on intake from 11 counties in western North Carolina (N = 1420). | Child and Adolescent Psychiatric Assessment (CAPA) until age 16; Young Adult Psychiatric Assessment (YAPA) at ages 19 and 21. | DSM–IV |
| Farmer et al. (2013) | Oregon Adolescent Depression Project. Cohort of high school students randomly selected from nine high schools in western Oregon (N = 816). | Schedule for Affective Disorders and Schizophrenia for School-Age Children (K-SADS), Longitudinal Interval Follow-Up Evaluation (LIFE), Structured Clinical Interview for DSM–IV (SCID). | DSM–III–R, DSM–IV |
| Angst et al. (2015) | The Zurich Cohort Study of Young Adults. Community-based cohort of 4,547 people aged 19–20 from Zurich Switzerland. A stratified subsample was selected for interview, with two-thirds consisting of high scorers on the global severity index of the SCL–90–R (N = 591). | Structured Psychopathological Interview and Rating of the Social Consequences of Psychological Disturbances for Epidemiology’ (SPIKE), a semi-structured interview. | DSM–III, DSM–III–R, DSM–IV |
| Horwood (2015)a | The Christchurch Health and Development Study. Population representative, Christchurch New Zealand birth cohort (N = 1265) | Diagnostic Interview Schedule for Children (DISC), Composite International Diagnostic Interview (CIDI). | DSM–III–R, DSM–IV |
| Present study | Dunedin Multidisciplinary Health & Development Study. Population-representative Dunedin, New Zealand birth cohort (N = 1037) | Diagnostic Interview Schedule (DIS). | DSM–III, DSM-III–R, DSM–IV |
Estimates from retrospective surveys and prospective cohort studies have been criticized for assessing only common Axis I disorders, omitting conditions such as personality disorders. The impact of this limitation on estimates of the lifetime prevalence of any diagnosable mental health problem is likely fairly small, however, given the high level of comorbidity between personality and common Axis I disorders (Hayward & Moran, 2008).
Viewed together, the three types of studies represented in Figure 1 converge to indicate that the proportion of the population who lives through adolescence and adulthood without experiencing a mental disorder is surprisingly small. This observation is particularly striking given that even the longitudinal prevalence estimates shown in Figure 1 likely represent an underestimate of the true prevalence of mental disorders in the population due to factors such as gaps between assessment periods and the possibility of selective attrition. The experience of enduring mental health, therefore, may be substantially rarer than was previously thought. This realization prompted us to ask the following questions: Who, exactly, are these individuals who lead lives untouched by mental disorders? What sorts of environments did they grow up in? And does enduring mental health matter? That is, is a life free from mental disorders associated with more desirable life outcomes (i.e., greater attainment, increased life satisfaction, and higher-quality relationships)?
Empirical Study of Individuals With Enduring Mental Health
The second section of this article reports an analysis of early-life demographic, family environment, physical health, cognitive, temperamental/personality, and family history characteristics of individuals who have never been diagnosed with a mental disorder during the course of the Dunedin Longitudinal Study. In the absence of prior research or theory on enduring mental health, we selected from our data set measures available to us that have the best published evidence base as important risk factors for mental disorder. We have previously found that several of these measures correlate with scores on the ‘p-factor,’ which represents an individual’s propensity to develop any and all forms of common psychopathologies (Caspi et al., 2014). We reasoned that individuals with enduring mental health (and, consequently, very low scores on the p-factor) thus ought to be exceptionally well-advantaged on these measures. We hypothesized, for example, that they would have well-to-do socioeconomic origins, exceptionally positive parent–child relations, robust physical health, high intelligence, adaptive personality styles from childhood, and nil histories of psychiatric illness in their families. To add to our descriptive data about individuals with enduring mental health, we also tested the hypothesis that they would enjoy exceptionally positive life outcomes (in the domains of educational attainment, socioeconomic status, life satisfaction, and the quality of their most recent romantic relations), as assessed at the end of our study observation period.
The Dunedin Study assessed Study members for a variety of common mental disorders beginning when they were 11 years of age, and repeated these assessments every few years up until the most recent wave, when Study members were all age 38. Because the predictors of most forms of severe and/or chronic mental disorders are well established, we chose to focus our analyses on the predictors and outcomes of extraordinary mental health—that is, what distinguishes Study members who were never diagnosed with a mental disorder (hereafter referred to as the “enduring-mental-health” group) from those who experienced a mental health history that could fairly be characterized as typical (i.e., at the mode) for the Dunedin cohort.
Method
Sample
Participants are members of the Dunedin Multidisciplinary Health and Development Study (DMHDS), a 4-decade, longitudinal investigation of health and behavior in a complete birth cohort. Study members (N = 1,037; 91% of eligible births; 52% male) were all individuals born between April, 1972 and March, 1973 in Dunedin, New Zealand who were eligible for the longitudinal study based on residence in the province at age 3, and who participated in the first follow-up assessment at age 3. The cohort represented the full range of SES in the general population of New Zealand’s South Island. On adult health, the cohort matches the NZ National Health & Nutrition Survey (e.g., body mass index, smoking, general practitioner visits; Poulton et al., 2015). The cohort is primarily white; fewer than 7% self-identify as having partial non-Caucasian ancestry, matching the South Island. Assessments were carried out at birth and at ages 3, 5, 7, 9, 11, 13, 15, 18, 21, 26, 32, and, most recently, 38 years, when 95% of the 1,007 Study Members still alive took part. At each assessment wave, each Study member is brought to the Dunedin research unit for a full day of interviews and examinations. This article examines Study members who were assessed for mental disorders at ages 11, 13, 15, 18, 21, 26, 32, and 38 years of age. The Otago Ethics Committee approved each phase of the Study and informed consent was obtained from all Study members.
Assessment of Mental Disorders
Mental disorders were ascertained in the Dunedin Study longitudinally using a periodic sampling strategy: Every 2 to 6 years, Study members were interviewed about past-year symptoms in a private in-person interview at the research unit by trained interviewers with tertiary qualifications and clinical experience in a mental health-related field such as family medicine, clinical psychology, or psychiatric social work (i.e., not lay interviewers). Interviewers used the Diagnostic Interview Schedule for Children (DIS-C) at the younger ages (11–15 years) and the Diagnostic Interview Schedule (DIS) at the older ages (18–38 years). At each assessment, interviewers were kept blind to Study members’ previous data, including mental health status. At ages 11, 13, and 15, diagnoses were made according to the then-current Diagnostic and Statistical Manual of Mental Disorders (3rd ed.; American Psychiatric Association [APA], 1980) and grouped for this article into a single wave reflecting the presence or absence of a juvenile mental disorder. At ages 18 and 21, diagnoses were made according to the Diagnostic and Statistical Manual of Mental Disorders (3rd ed, rev.; DSM–III–R; APA, 1987) and at ages 26, 32, and 38 diagnoses were made according to the Diagnostic and Statistical Manual of Mental Disorders (4th ed.; DSM–IV; APA, 1994). This method led to 6 waves in total representing ages 11–15, 18, 21, 26, 32, and 38. In addition to symptom criteria, diagnosis required impairment ratings ≥2 on a scale from 1 (some impairment) to 5 (severe impairment). Each disorder was diagnosed regardless of the presence of other disorders. Variable construction details, reliability and validity, and evidence of life impairment for diagnoses have been reported previously. Of the original 1,037 Study members, we included 988 (95.3%) Study members who had participated in at least half of the six mental health assessment waves from ages 11 to 38. Of these Study members, 849 (85.9%) contributed data to all 6 waves, 88 (8.9%) contributed data to 5 waves, 32 (3.2%) contributed data to 4 waves, and 19 (1.9%) contributed data to 3 waves.
Candidate Childhood Predictors
To test what distinguishes Study members who experienced enduring mental health from their peers, we report on 13 different predictors, selected because they are thought to be associated with risk of developing a mental disorder: parental socioeconomic status, positive family climate, negative discipline, maltreatment, parental loss, perinatal complications, childhood health, preschool IQ, middle childhood IQ, emotional difficulties, social isolation, self-control, and family psychiatric history. These measures are described in Table 1 in the online supplementary material.
Midlife Outcomes
Educational attainment
Educational attainment at age 38 was measured on a four-point scale relevant to the New Zealand educational system: 0 = no secondary school qualifications, 1 = school certificate, 2 = high school graduate or equivalent, 3 = bachelor’s degree or higher.
Socioeconomic attainment (SES)
At age 38, Study members were asked about their current or most recent occupation. The SES of the study members was measured on a 6-point scale that assessed self-reported occupational status and allocates each occupation to 1 of 6 categories (1 = unskilled laborer, 6 = professional) on the basis of the educational levels and income associated with that occupation in data from the New Zealand census. Homemakers and those not working were prorated based on their educational status according to criteria included in the New Zealand Socioeconomic Index (Milne, 2012).
Life satisfaction
At age 38, Study members completed the 5-item Satisfaction With Life Scale (e.g., “In most ways my life is close to ideal”; “So far I have gotten the important things I want in life”; Pavot & Diener, 1993).
Relationship quality
At age 38, Study members who reported being in a relationship for at least one month during the past year reported on a 28-item scale about their current or most recent relationship, covering relationship characteristics such as shared activities and interests, the balance of power, respect and fairness, emotional intimacy and trust, and open communication. Each of these items was coded on a 3-point scale (0 = Almost never, 1 = Sometimes, 2 = Almost always). We summed these ratings across items to create a composite measure reflecting overall relationship quality (α = .93). Of the 988 Study members who had participated in at least half of the six mental health assessments from ages 11 to 38, 841 (85.1%) reported a current or recent relationship at age 38.
Results
Defining Mental Health Histories Over the First Half of the Life Course
Figure 2a displays the number of waves (from 0 to 6) in which Study members met criteria for one or more mental disorders. On average, cohort members met criteria for a mental disorder on 2.3 of the six assessment waves, but there was a great deal of variation. The most common mental health history in the cohort appeared to be one characterized by a relatively brief, episodic course of disorder, in which Study members met diagnostic criteria for a disorder at only 1 or 2 assessment waves (N = 409). We also included in this group 9 Study members who were not diagnosed with a mental disorder by Dunedin Study staff, but reported receiving a psychiatric diagnosis while using mental health services in the gaps between assessment waves.1 Study members who experienced enduring mental health (i.e., met diagnostic criteria at 0 waves), in contrast, were a distinct minority, comprising only 17.3% of the cohort (N = 171).2 The remainder of the cohort were Study members who had met criteria for one or more mental disorder diagnoses at 3 + waves (N = 408). It is important to note that Study members were not classified as having enduring mental health simply because they participated in fewer waves: On average, Study members with enduring mental health had complete data on 5.7 (out of 6) waves, whereas Study members who met diagnostic criteria at 1–2 waves had complete data on 5.8 waves, and Study members who met diagnostic criteria at 3–6 waves had complete data on 5.8 waves.
Figure 2.

Mental disorder diagnoses in the Dunedin Cohort (N = 988). Panel A: Number of waves in which Dunedin Study members met criteria for a DSM diagnosis. The 6 waves represent ages 11–15, 18, 21, 26, 32, and 38. The red bar represents Study members with enduring mental health (those diagnosed at 0 waves). The light blue bars represent Study members with typical mental health histories (those diagnosed at 1–2 waves). The dark blue bars represent Study members diagnosed at 3 + waves. Panel B: Distribution of DSM diagnoses across assessment waves. Each thin horizontal line represents an individual Study member’s mental health history. Blue indicates that the Study member met criteria for a past-year DSM -defined psychiatric disorder during this assessment. Red indicates that the Study member did not meet criteria for a past-year DSM-defined psychiatric disorder during this assessment. Panel B shows that the largest proportion of Study members met diagnostic criteria at 1–2 waves, but that neither these individuals nor those diagnosed at 3 + waves were characterized by any particular developmental pattern (e.g., adolescent-limited course of disorder or late-onset forms of disorder).
Figure 2b displays the temporal pattern of psychiatric diagnoses across the life course of the cohort, from ages 11 to 38 years. The figure shows that the diagnosed groups were not dominated by any particular developmental pattern.
Table 2 displays indicators of disorder type, age-of-onset, and severity for individuals as a function of mental health-history group. Relative to the Study members diagnosed at 3 + waves, those with typical mental health histories (i.e., diagnosed at 1–2 waves) presented with a narrower set of disorders (primarily depression, anxiety, and substance dependence), an older age of onset, less comorbidity, and lower scores on a general factor of psychopathology (Caspi et al., 2014).
Table 2. Demographic and Diagnostic Characteristics of Each Mental Health Group in the Dunedin Cohort.
| Measures | Total N | Full cohort | 0 waves (N = 171) | 1–2 waves (N = 409) | 3 + waves (N = 408) |
|---|---|---|---|---|---|
| Note. ADD = attention deficit disorder; PTSD = posttraumatic stress disorder. | |||||
| a The p-factor, derived from confirmatory factor analysis of symptom-level data collected between ages 18 and 38, represents an individual’s propensity to develop any and all forms of common psychopathologies (Caspi et al., 2014). | |||||
| % | % | % | % | ||
| Demographic | |||||
| Sex (% male) | 988 | 51.3 | 56.7 | 52.6 | 47.8 |
| Type of disorder (ages 11–38) | |||||
| ADD | 953 | 6.2 | 0 | 4.7 | 10.1 |
| Conduct disorder | 953 | 17.6 | 0 | 12.2 | 30.0 |
| Any anxiety | 988 | 57.5 | 0 | 53.3 | 85.8 |
| Depression | 988 | 48.3 | 0 | 39.1 | 77.7 |
| Substance abuse/dependence | 988 | 41.2 | 0 | 35.4 | 64.2 |
| PTSD | 983 | 8.9 | 0 | 3.5 | 17.9 |
| Schizophrenia | 953 | 3.9 | 0 | 0 | 9.3 |
| Mania | 947 | 1.0 | 0 | 0 | 2.3 |
| Age of onset | |||||
| First diagnosis before age 15 | 973 | 34.6 | 0 | 24.6 | 58.8 |
| First diagnosis at age 38 | 973 | 2.6 | 0 | 6.3 | 0 |
| M (SD) | M (SD) | M (SD) | M (SD) | ||
| Indicators of mental disorder severity | |||||
| Comorbidity | |||||
| Different lifetime diagnoses (mean) | 988 | 1.8 (1.3) | 0 (0) | 1.5 (0.7) | 2.8 (1.0) |
| Persistence | |||||
| Waves in which they received a diagnosis | 988 | 2.3 (1.8) | 0 (0) | 1.5 (0.5) | 4.1 (1.0) |
| Impairment | |||||
| Rating of functional impairment (max ever) | 974 | 3.7 (1.2) | — | 3.5 (1.1) | 4.4 (0.8) |
| Symptom Score | |||||
| p-factor (z score)a | 988 | 0 (1.0) | −1.0 (0.6) | −0.3 (0.7) | 0.7 (0.9) |
| % | % | % | % | ||
| Informant reports | |||||
| Problems with depression (ages 18–38) | 987 | 32.3 | 15.8 | 25.7 | 46.0 |
| Problems with unreasonable fears (ages 18–38) | 987 | 23.0 | 8.2 | 18.1 | 34.2 |
| Problems with alcohol (ages 18–38) | 987 | 14.4 | 1.8 | 10.3 | 23.8 |
| Problems with drugs (ages 18–38) | 987 | 12.2 | 1.8 | 6.4 | 22.4 |
| Talks about suicide (ages 26–38) | 974 | 3.5 | 0.6 | 1.7 | 6.5 |
| Any problem (ages 18–38) | 987 | 45.9 | 21.1 | 38.9 | 63.4 |
Informant Reports: To What Extent Do They Confirm the Enduring Mental Health of Never-Diagnosed Study Members?
Given the high lifetime prevalence of mental disorders, it is reasonable to wonder whether Study members classified as experiencing “enduring mental health” are, in fact, simply those with a tendency to down-play or deny genuine past-year psychiatric symptoms during clinical interviews. As an additional “check” for evidence of mental disorder, we reviewed informant reports to see if these Study members showed any outwardly perceivable signs of common mental disorders. At ages 18, 21, 26, 32, and 38, we asked Study members to nominate someone who knew them well (e.g., best friends, partners, or other family members). These informants were mailed questionnaires which asked them “To the best of your knowledge, did ________ have any of these problems over the last 12 months?” Items included “Feels depressed, miserable, sad, or unhappy,” “Has unreasonable worries or fears,” “Has alcohol problems,” “Marijuana or other drug problems,” and (at ages 26, 32, and 38), “Talks about suicide.” Informants were asked to rate these items on a 3-point scale (0 = Not a problem, 1 = Bit of a problem, 2 = Yes, a problem). In analyzing these data, we took a conservative approach, treating a rating of “2” by any informant during any assessment wave as evidence of symptomatic behavior. Informant report data were available for 987 (99.9%) of the 988 Study members reported here.
Although informant reports provide a useful complement to self-reported symptoms, endorsements of symptomatic behaviors must be interpreted with caution. The informant questionnaire was not designed to correspond directly with DSM diagnoses or diagnostic criteria. Therefore, many informants may have been inclined to endorse Study member “problems” (e.g., “feels depressed, miserable, sad, or unhappy”) even when these issues were not of sufficient severity to meet diagnostic criteria for a DSM-defined mental disorder (e.g., major depression).
As shown in the bottom panel of Table 2, informant reports largely confirmed the absence of mental health problems among Study members with enduring mental health. From ages 18 to 38, only 36 (21.1%) Study members with enduring mental health had an informant report that they showed evidence of problems with depression, unreasonable fears, alcohol, drugs, or had talked about suicide (compared to 38.9% and 63.4% of Study members diagnosed at 1–2 and 3 + waves, respectively). According to informants, the most common problem for these Study members was feeling depressed (15.8%), with only a small handful of informants reporting problems with unreasonable fears (8.2%), alcohol (1.8%), drugs (1.8%), or talking about suicide (0.6%).
What Distinguishes Study Members Who Experienced Enduring Mental Health From Those Who Experienced “Typical” Mental Health Histories?
It has been repeatedly demonstrated that individuals with severe, persistent, or recurrent mental disorders differ from individuals without such disorders in multiple ways. This well-established finding was confirmed in our study: Table 3 shows that Study members diagnosed at 3 + waves had more childhood risk factors across each domain compared to both Study members with enduring mental health and Study members diagnosed at 1–2 waves.
Table 3. Childhood Predictors of Lifetime Mental Health History in the Dunedin Cohort.
| Predictors | 0 waves vs. 1–2 waves | 0 waves vs. 3 + waves | 1–2 waves vs. 3 + waves | |||
|---|---|---|---|---|---|---|
| Risk ratio (95% CI) | p | Risk ratio (95% CI) | p | Risk ratio (95% CI) | p | |
| Note. “Risk” of membership in the group diagnosed at fewer waves was calculated by entering each predictor into a Poisson regression predicting age 38 mental health group membership (0 waves vs. 1–2 waves, 0 waves vs. 3 + waves, and 1–2 waves vs. 3 + waves), controlling for sex. To facilitate comparison across predictors, all variables were standardized to a mean of 0 (representing the mean of the full cohort) and a standard deviation of 1. CI = confidence interval; SES = socioeconomic status. | ||||||
| Demographic information | ||||||
| Parental SES | 0.95 [0.84, 1.07] | .399 | 1.13 [1.00, 1.28] | .053 | 1.13 [1.06, 1.21] | <.001 |
| Family environment | ||||||
| Positive family climate (ages 7–9) | 1.07 [0.92, 1.24] | .382 | 1.20 [1.04, 1.38] | .012 | 1.10 [1.01, 1.18] | .017 |
| Negative discipline (ages 7–9) | 0.85 [0.73, 1.00] | .044 | 0.72 [0.62, 0.83] | <.001 | 0.87 [0.81, 0.94] | <.001 |
| Maltreatment (ages 3–11) | 0.80 [0.63, 1.02] | .077 | 0.68 [0.58, 0.81] | <.001 | 0.85 [0.79, 0.92] | <.001 |
| Parental loss (ages 3–11) | 0.72 [0.57, 0.91] | .006 | 0.64 [0.50, 0.81] | <.001 | 0.92 [0.86, 1.00] | .038 |
| Physical health | ||||||
| Perinatal Complications (birth) | 0.98 [0.86, 1.12] | .755 | 0.92 [0.80, 1.06] | .261 | 0.96 [0.89, 1.04] | .323 |
| Childhood health (ages 3–11) | 1.08 [0.94, 1.25] | .261 | 1.25 [1.08, 1.43] | .002 | 1.11 [1.03, 1.19] | .006 |
| Cognitive ability | ||||||
| Early childhood IQ (ages 3–5) | 1.10 [0.96, 1.26] | .176 | 1.27 [1.18, 1.44] | <.001 | 1.11 [1.03, 1.19] | .004 |
| WISC IQ (ages 7–11) | 1.00 [0.87, 1.16] | .958 | 1.22 [1.07, 1.39] | .003 | 1.16 [1.08, 1.25] | <.001 |
| Temperament/personality | ||||||
| Emotional difficulties (ages 5–11) | 0.80 [0.70, 0.92] | .002 | 0.71 [0.62, 0.81] | <.001 | 0.92 [0.86, 0.99] | .024 |
| Social isolation (ages 5–11) | 0.82 [0.70, 0.96] | .013 | 0.76 [0.66, 0.88] | <.001 | 0.94 [0.88, 1.01] | .098 |
| Low self-control (ages 3–11) | 0.73 [0.60, 0.89] | .002 | 0.60 [0.49, 0.72] | <.001 | 0.84 [0.78, 0.92] | <.001 |
| Family history | ||||||
| Proportion of 1st degree relatives with indicators of mental disorder | 0.79 [0.69, 0.92] | .002 | 0.64 [0.55, 0.74] | <.001 | 0.87 [0.81, 0.94] | <.001 |
The key comparison in this article, however, is between Study members who were never diagnosed with a mental disorder, and those who experienced a mental health history that resembles the histories of the majority of other Study members (i.e., the “1-2 wave” group). By comparing Study members with enduring mental health to those with more typical mental health histories across candidate predictor variables hypothesized to discriminate between them, we can distinguish factors predictive of enduring mental health from those that simply predict the absence of a severe, persistent, or recurrent disorder.
Although we had expected to find that Study members with enduring mental health were significantly advantaged across all 13 of our candidate predictors relative to Study members with typical histories, this hypothesis received only mixed support. First, we found that Study members with enduring mental health were surprisingly similar to Study members who met diagnostic criteria at 1–2 waves in terms of parental socioeconomic status, childhood physical health, and childhood cognitive ability (the observed distribution of mean predictor variable scores across the number of waves in which Study members received a diagnosis can be seen in Figure 1 in the online supplemental materials). Second, although we found some evidence to suggest that Study members in the two groups differed in their upbringing, analyses using these variables returned mixed results. Third, Study members with enduring mental health showed statistically significant advantages in childhood temperament/personality relative to Study members diagnosed at 1–2 waves, including fewer emotional difficulties, less social isolation, and superior self-control. Finally, Study members with enduring mental health also had significantly fewer first- and second-degree relatives who showed signs of mental disorder (Table 3).
Thus far, we have characterized Study members’ mental health histories as a function of persistence or recurrence; that is, by the number of waves in our longitudinal study during which they received a diagnosis. We found that a mental health history in which the Study member met diagnostic criteria for a mental disorder at 1 or 2 waves was the most common pattern. Another way to characterize mental health histories, however, is as a function of comorbidity; that is, by the number of different types of disorder categories or “families” represented in Study members’ accumulated diagnostic histories. To ensure that the results in Table 3 were not dependent on the particular way in which we classified the severity of Study members’ mental health histories, we repeated these analyses using a classification scheme based on comorbidity rather than recurrence or persistence. As shown in Figure 2 in the online supplemental material, the same group of 171 Study members received no diagnosis throughout the course of the study, and were thus considered to experience enduring mental health by virtue of having no psychiatric comorbidity. Our new comparison group, however, consisted of 540 Study members who were diagnosed with disorders from 1–2 different diagnostic families, the cohort “comorbidity mode.” Similarly, our most severe group consisted of the 277 remaining Study members with mental health histories characterized by unusually high comorbidity, or diagnoses from 3 + different diagnostic families. Our substantive conclusions regarding the most and least effective predictors of enduring mental health remained almost entirely unchanged under this alternate classification scheme (see Table 2 in the online supplemental material). This stability is largely attributable to the fact that comorbidity and number of waves with disorder are highly correlated (r = .80, p < .001), as are most indicators of disorder severity. The most common mental health history in our data thus appears to be characterized not only by disorders of relatively short duration but also those that are diagnostically “pure” (that is, with limited lifetime comorbidity).
Is Enduring Mental Health Associated With More Desirable Life Outcomes (i.e., Greater Educational and Occupational Attainment, Increased Life Satisfaction, and Higher Quality Relationships)?
As shown in Figure 3, despite their comparable socioeconomic background, Study members with enduring mental health achieved higher levels of educational and socioeconomic attainment by age 38 than Study members who had experienced 1–2 waves of disorder. Study members with enduring mental health also expressed higher levels of life satisfaction when interviewed at age 38 than Study members diagnosed at 1–2 waves. Interestingly, although Study members with enduring mental health were just as likely to report being in a relationship at age 38 as Study members diagnosed at 1–2 waves (91.1% vs. 92.8%, respectively; χ2 = 0.40, p = .528), they rated these relationships as being of higher quality (see Table 3, online supplemental material, for more detail).
Figure 3.
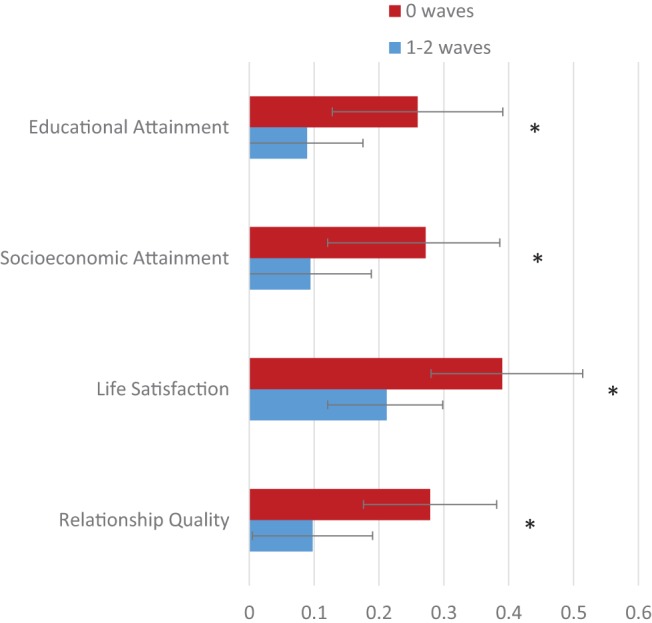
Comparison of midlife outcomes for Dunedin cohort members in the 0 wave versus 1–2 wave mental health history groups. Error bars represent 95% confidence intervals. All outcome variables were standardized on the full cohort to a mean of 0 (representing the mean of the full cohort) and a standard deviation of 1. The means for the persistently diagnosed group are not shown here, but can be found in Table 3 in the online supplemental materials. Asterisks represent the statistical significance of the difference between groups, adjusted for sex. * p < .05.
Discussion
Far from being the aberrant experience of a small, stigmatized subgroup, data from both the Dunedin Study and other longitudinal studies suggest that experiencing a diagnosable mental disorder at some point during the life course is the norm, not the exception. In our cohort, whose members have been repeatedly assessed for common mental disorders by trained professionals over a span of close to three decades, only 17% of repeatedly assessed Study members managed to reach midlife (age 38) without experiencing the psychiatric symptoms and resulting functional impairment necessary to meet criteria for the diagnosis of a mental disorder.
To some, the proportion of Dunedin Study members diagnosed with at least one mental disorder may seem unusually high, raising concerns about the representativeness of our sample. However, we have shown elsewhere that the past-year prevalence rates of mental disorders in the Dunedin cohort are similar to prevalence rates in nationwide surveys of the United States and of New Zealand. This observation indicates that the higher Axis-I-disorder lifetime prevalence rate in our study is due primarily to the advantage of our prospective assessment method rather than to an overabundance of mental disorder in New Zealand, or in our cohort (Moffitt et al., 2010). Similarly, although Axis-I-disorder lifetime prevalence estimates drawn from the Dunedin Study and Christchurch Study are modestly higher than those of other longitudinal studies with similar methodologies (Figure 1), this discrepancy is likely due to differences in study design. To our knowledge, the Dunedin Study is one of the only prospective, longitudinal studies with nearly three decades of mental health assessments that stretch from late childhood (when the earliest cases of most mental disorders first onset) through adolescence and young adulthood (the time of peak onset for many of these same disorders) and into midlife. The Christchurch Study captures a similar period of development with the additional advantage of mental health assessments that cover the full time period between assessments (rather than just counting symptoms experienced within the past 12 months). We anticipate that Axis-I-disorder lifetime prevalence estimates drawn from similar studies of younger cohorts (e.g., Copeland, Shanahan, Costello, & Angold, 2011) will eventually mirror (or exceed) the values obtained from these New Zealand studies as these cohorts are followed forward.
There is an extensive literature linking childhood attributes and experiences to later mental disorder. Usually, it is implicitly assumed that individuals without the disorder (“controls”) represent “normality,” whereas those who do develop the disorder (“cases”) represent “abnormality.” However, data reported here indicate that the statistically “typical” Study member is a person with at least some transient history of diagnosable psychopathology. Consequently, we sought to identify early life variables that differentiated between those with “typical” mental health histories and those with extraordinary histories marked by no episodes of diagnosable mental disorder whatsoever (at least, as far as we know). The utility provided by this type of comparison is that it helps to distinguish between variables that predict enduring mental health and those that predict the onset of severe mental disorders (but perhaps fail to distinguish between individuals on the opposite end of the spectrum). Our finding that relatively few early life measures seem to predict above-average mental health, whereas many predict very poor mental health is perhaps not surprising. Indeed, identifying measures that do distinguish between Study members with enduring mental health and those with typical mental health histories should be significantly more difficult than identifying measures that predict the more severely ill cases given that milder, more transient episodes of disorder are more likely to be attributable to situational, stochastic factors rather than enduring vulnerabilities.
Given the remarkably low prevalence of enduring mental health in the Dunedin cohort, we expected Study members with enduring mental health to come from backgrounds virtually free of each of our 13 well-established predictors. This expectation was strongly supported when we compared Study members with enduring mental health to Study members diagnosed at 3 + waves, but unsupported when comparing Study members with enduring mental health to Study members diagnosed at 1–2 assessment waves (Table 3).
We identified only two childhood factors that clearly differentiated between Study members with enduring mental health and those diagnosed only at 1 or 2 waves: (a) a suite of advantageous personality traits and (b) a relative absence of family psychiatric history. Consistent with research that names a neurotic personality style as a risk factor for multiple different mental disorders (Kendler, Gatz, Gardner, & Pedersen, 2006; Lahey, 2009), we found that Study members who showed little evidence of strong negative emotions in childhood were more likely to experience enduring mental health into their late 30s. Similarly, consistent with research that names abundant social support and sociability as “buffers” against stress (e.g., Ozbay et al., 2007), we also found that Study members with enduring mental health were significantly less socially isolated in childhood than peers with typical histories (or, alternatively, these exceptionally well-adjusted children were more attractive to peers, and thus acquired more childhood friends). In addition, we found that Study members with enduring mental health showed significantly higher levels of childhood self-control, in line with previous reports from this cohort demonstrating that higher self-control in childhood predicts other advantageous adult outcomes such as superior physical health, fewer financial problems, less criminal offending, and lower risk of substance dependence (Israel et al., 2014; Moffitt et al., 2011). Finally, consistent with research indicating substantial familial aggregation of common psychiatric and substance-use disorders (Kendler, Davis, & Kessler, 1997), we found that Study members who experienced enduring mental health had fewer first- and second-degree relatives with mental health issues relative to Study members diagnosed at 1–2 waves.
Our analyses of family factors returned mixed results. We found evidence to indicate that, relative to Study members with typical mental health histories, those with enduring mental health experienced a family environment characterized by less negative discipline and a reduced likelihood of parental loss. Surprisingly, however, the remainder of our childhood predictors did not seem to differ between the two groups. For example, we found that individuals with enduring mental health were not more socioeconomically advantaged than those with typical histories, despite evidence linking low childhood socioeconomic status to multiple mental disorders (Reiss, 2013). In addition, Study members with enduring mental health showed no evidence of fewer perinatal complications or superior physical health in childhood, despite evidence linking perinatal complications and poor health in childhood to multiple mental disorders (Buka & Fan, 1999; Foley, Thacker, Aggen, Neale, & Kendler, 2001; Merikangas et al., 2015). And finally, Study members with enduring mental health were not found to possess higher childhood intelligence than Study members diagnosed at 1–2 waves, even though multiple studies have confirmed low IQ as a risk factor for a wide array of psychiatric conditions (Batty, Mortensen, & Osler, 2005; Gale et al., 2008; Koenen et al., 2009). These observations suggest that although childhood poverty, compromised physical health, and low cognitive ability are robust predictors of persistent mental disorder, their absence is unlikely to guarantee enduring mental health.
The predictive strength of our temperament/personality measures is perhaps unsurprising, given that they capture, in part, behaviors that could be viewed as juvenile manifestations of adult disorders (e.g., our measure of childhood emotional difficulties captures behaviors like frequent worrying, and often appearing sad or tearful). Nevertheless, our finding that these measures are capable of predicting which Study members will reach their late 30s without ever experiencing a diagnosable disorder suggests that the path to enduring mental health begins early in development, as is the case with many mental disorders (Kessler et al., 2005; Kim-Cohen et al., 2003).
The present study is characterized by several limitations. First, although findings about the low prevalence of enduring mental health have appeared across studies, our findings regarding the correlates of enduring mental health were drawn from a single, largely Caucasian, New Zealand cohort born in the 1970s, and thus may not generalize to other populations. Second, assessment of mental disorder in the Dunedin cohort is both left- and right-hand censored, which means we cannot count episodes of disorder that occurred prior to age 11, or future cases that may onset after our most recent assessment at age 38. Third, gaps between the Dunedin Study’s 12-month assessment windows did not allow us to count individuals who experienced an episode of disorder between windows. Although we were able to use life history calendar interviews to reclassify 9 Study members who were not diagnosed by Study staff but reported being diagnosed and treated during these gaps into the “1–2 wave” group, the number of cohort members we classified incorrectly because their only episodes of disorder occurred between Study windows and went untreated is unknown. However, it is worth noting that the Dunedin Study’s Axis-I-disorder lifetime prevalence estimate is very similar to the Axis-I-disorder lifetime prevalence estimate drawn from the Christchurch Study (Figure 1), which asks Study members at each assessment to extend their recall of psychiatric symptoms back to the previous assessment (thus avoiding gaps in assessment windows). This observation suggests that the number of Dunedin Study members who did experience a mental disorder but were “missed” by our eight past-year assessments is likely to be relatively small.
Replication of this study is needed. However, the study of enduring mental health poses a challenge for researchers, since classifying individuals as having experienced “enduring mental health” on the basis of a single clinical interview assessing lifetime psychiatric symptoms may result in substantial misclassification. One possibility suggested by our results is to further refine phenotyping by screening this group to also be free of a family history of psychiatric disorder.
The comparative rarity of the enduring-mental health phenotype has implications for etiological research into mental disorders. Studies of individuals with enduring mental health can complement studies of mental disorders in much the same way studies of centenarians complement studies of age-related disease (e.g., Galioto et al., 2008; Sebastiani & Perls, 2012). One way is by identifying targets for prevention. For example, our study suggests the hypothesis that interventions to promote children’s development of self-control skills might prevent subsequent mental disorder. Nonetheless, a limitation of the Dunedin Study is that it was not originally designed to study predictors of enduring mental health, because no one anticipated that it would be so rare as to be an interesting phenotype. As a result, our investigation was constrained by our set of pre-existing early life risk factors for mental disorder, suggesting that studies with richer sets of early-life, mental-health-promoting factors are needed.
Perhaps unsurprisingly, ours is not the first study to attempt to identify a “completely psychiatrically healthy” group of people. Indeed, control groups consisting of individuals who were screened to be free from any history of either psychiatric diagnosis or treatment were commonly used in early studies of psychiatric genetics, particularly those examining familial aggregation (e.g., Coryell & Zimmerman, 1988; Weissman et al., 1984). The extent to which these earlier studies were successful in screening out all individuals who may have at one point met criteria for a psychiatric diagnosis, however, is unclear, especially given that the pitfalls of retrospective psychiatric assessments did not become clear until a few years later.
Our findings add weight to the suggestion that research psychologists and psychiatrists should be cautious whenever they attempt to define and assemble a “healthy control group,” particularly when participants are categorized solely on the basis of a single retrospective assessment of lifetime psychiatric symptoms (see Streiner, Patten, Anthony, & Cairney, 2009, for a thoughtful review of this issue). Because of the extremely high rates of lifetime disorder, it is likely that any “control group” defined without the use of repeated assessments will contain (a) participants with enduring mental health who have never met criteria for the disorder of interest nor any psychiatric comorbidities, (b) participants who have never met criteria for the disorder of interest, but who have met (or currently do meet) criteria for psychiatric comorbidities, and (c) participants who do not currently meet criteria for the disorder of interest, but did meet criteria in the past and have since forgotten or reframed this experience. The inadvertent inclusion of group (c) into the larger control group could lead to an attenuation of observed case-control differences, potentially reducing power to detect real effects. Conversely, a more stringent assessment process (e.g., repeated assessments of psychiatric status over time), could increase statistical power by bolstering researchers’ ability to correctly categorize study participants.
A final, intriguing question is whether enduring mental health is associated with exceptional psychological “well-being,” in addition to minimal psychological distress. Research in the fields of positive psychiatry and psychology indicates that measures of “mental health” and “mental illness” are at best moderately correlated (Keyes, 2005), and that true well-being or “flourishing” (i.e., feeling good about and functioning well in life) is more than merely the absence of a diagnosable disorder (Jeste, Palmer, Rettew, & Boardman, 2015; Keyes, 2002; Seligman & Csikszentmihalyi, 2000). Our data suggest that Study members with enduring mental health (as defined here) share many similarities with individuals who are described as “flourishing” in other studies, including superior adult functioning (as measured by midlife educational and occupational attainment) as well as greater life satisfaction and higher-quality relationships. This overlap suggests the hypothesis that the absence of disorder may facilitate the acquisition of other desirable psychosocial traits and outcomes across the life course. Nevertheless, it is worth noting that our never-diagnosed Study members were not universally satisfied with life—indeed, approximately one quarter (22.5%) scored below the cohort mean on our measure of life satisfaction. This observation indicates that “enduring mental health” and “flourishing” should not be used interchangeably, and suggests that additional research is needed to clarify the nature of the relationship between these two constructs.
In conclusion, the observations that mental disorder affects the overwhelming majority of persons at some point in life and that its course is often transient suggest a need to alter our conception of what it means to be mentally ill. For many, an episode of mental disorder is like influenza, bronchitis, anemia, kidney stones, or a fractured bone—these conditions are highly prevalent, sufferers experience impaired functioning in social and occupational roles, and many seek medical care, but most recover. Put another way, such research affirms that discussions of “abnormal psychology” should recognize that “normality” refers to the absence of a diagnosable disturbance in emotional or behavioral functioning at the present time—not across the life course. It is our hope that increased public recognition of this fact will reduce the stigma experienced by individuals diagnosed with a mental disorder, perhaps leading to higher rates of treatment uptake as well as better clinical outcomes.
Supplementary Material
Footnotes
Because it is possible that past-year reports separated by 1 to 5 years miss episodes of mental disorder occurring only in gaps between assessments, we reviewed life-history calendar interviews of Study members to ascertain indicators of mental disorder occurring in these gaps, including inpatient treatment, outpatient treatment, or spells taking prescribed psychiatric medication (indicators that are salient and recalled more reliably than individual symptoms). Life-history calendar data indicated that all but 9 Study members who experienced a disorder consequential enough to be associated with treatment (many of whom had a brief postnatal depression) were detected in our net of past-year diagnoses made at ages 11 to 38.
Four of these 171 Study members met symptom criteria for a mental disorder at some point during the Study, but rated their impairment as a 1 out of 5, thus avoiding a diagnosis.
References
- Angst J., Paksarian D., Cui L., Merikangas K. R., Hengartner M. P., Ajdacic-Gross V., & Rössler W. (2015). The epidemiology of common mental disorders from age 20 to 50: Results from the prospective Zurich Cohort Study. Epidemiology and Psychiatric Sciences, FirstView, 1–9. 10.1017/S204579601500027X [DOI] [PMC free article] [PubMed] [Google Scholar]
- American Psychiatric Association (1980). Diagnostic and statistical manual of mental disorders (3rd ed.). Washington, DC: Author. [Google Scholar]
- American Psychiatric Association (1987). Diagnostic and statistical manual of mental disorders (3rd ed.). Washington, DC: Author. [Google Scholar]
- American Psychiatric Association (1994). Diagnostic and statistical manual of mental disorders (4th ed.). Washington, DC: Author. [Google Scholar]
- Batty G. D., Mortensen E. L., & Osler M. (2005). Childhood IQ in relation to later psychiatric disorder: Evidence from a Danish birth cohort study. The British Journal of Psychiatry, 187, 180–181. 10.1192/bjp.187.2.180 [DOI] [PubMed] [Google Scholar]
- Belsky J., Jaffee S., Hsieh K.-H., & Silva P. A. (2001). Child-rearing antecedents of intergenerational relations in young adulthood: A prospective study. Developmental Psychology, 37, 801–813. 10.1037/0012-1649.37.6.801 [DOI] [PubMed] [Google Scholar]
- Buka S. L., & Fan A. P. (1999). Association of prenatal and perinatal complications with subsequent bipolar disorder and schizophrenia. Schizophrenia Research, 39, 113–119. 10.1016/S0920-9964(99)00109-7 [DOI] [PubMed] [Google Scholar]
- Caspi A., Houts R. M., Belsky D. W., Goldman-Mellor S. J., Harrington H., Israel S., et al. Moffitt T. E. (2014). The p factor: One general psychopathology factor in the structure of psychiatric disorders? Clinical Psychological Science, 2, 119–137. 10.1177/2167702613497473 [DOI] [PMC free article] [PubMed] [Google Scholar]
- Caspi A., McClay J., Moffitt T. E., Mill J., Martin J., Craig I. W., et al. Poulton R. (2002, August 2). Role of genotype in the cycle of violence in maltreated children. Science, 297, 851–854. 10.1126/science.1072290 [DOI] [PubMed] [Google Scholar]
- Compton W. M., Thomas Y. F., Stinson F. S., & Grant B. F. (2007). Prevalence, correlates, disability, and comorbidity of DSM–IV drug abuse and dependence in the United States: Results from the national epidemiologic survey on alcohol and related conditions. Archives of General Psychiatry, 64, 566–576. 10.1001/archpsyc.64.5.566 [DOI] [PubMed] [Google Scholar]
- Copeland W., Shanahan L., Costello E. J., & Angold A. (2011). Cumulative prevalence of psychiatric disorders by young adulthood: A prospective cohort analysis from the Great Smoky Mountains Study. Journal of the American Academy of Child and Adolescent Psychiatry, 50, 252–261. 10.1016/j.jaac.2010.12.014 [DOI] [PMC free article] [PubMed] [Google Scholar]
- Coryell W., & Zimmerman M. (1988). The heritability of schizophrenia and schizoaffective disorder. A family study. Archives of General Psychiatry, 45, 323–327. 10.1001/archpsyc.1988.01800280033005 [DOI] [PubMed] [Google Scholar]
- Dunn L. M. (1965). Expanded manual for the Peabody Picture Vocabulary Test. Minneapolis, MN: American Guidance Service. [Google Scholar]
- Elley W. B., & Irving J. C. (1976). Revised Socio-Economic Index for New Zealand. New Zealand Journal of Educational Studies, 11, 25–36. [Google Scholar]
- Farmer R. F., Kosty D. B., Seeley J. R., Olino T. M., & Lewinsohn P. M. (2013). Aggregation of lifetime axis I psychiatric disorders through age 30: Incidence, predictors, and associated psychosocial outcomes. Journal of Abnormal Psychology, 122, 573–586. 10.1037/a0031429 [DOI] [PMC free article] [PubMed] [Google Scholar]
- Foley D. L., Thacker L. R. II, Aggen S. H., Neale M. C., & Kendler K. S. (2001). Pregnancy and perinatal complications associated with risks for common psychiatric disorders in a population-based sample of female twins. American Journal of Medical Genetics, 105, 426–431. 10.1002/ajmg.1402 [DOI] [PubMed] [Google Scholar]
- Gale C. R., Deary I. J., Boyle S. H., Barefoot J., Mortensen L. H., & Batty G. D. (2008). Cognitive ability in early adulthood and risk of 5 specific psychiatric disorders in middle age: The Vietnam Experience Study. Archives of General Psychiatry, 65, 1410–1418. 10.1001/archpsyc.65.12.1410 [DOI] [PMC free article] [PubMed] [Google Scholar]
- Galioto A., Dominguez L. J., Pineo A., Ferlisi A., Putignano E., Belvedere M., et al. Barbagallo M. (2008). Cardiovascular risk factors in centenarians. Experimental Gerontology, 43, 106–113. 10.1016/j.exger.2007.06.009 [DOI] [PubMed] [Google Scholar]
- Haeny A. M., Littlefield A. K., & Sher K. J. (2014). Repeated diagnoses of lifetime alcohol use disorders in a prospective study: Insights into the extent and nature of the reliability and validity problem. Alcoholism: Clinical and Experimental Research, 38, 489–500. 10.1111/acer.12237 [DOI] [PMC free article] [PubMed] [Google Scholar]
- Hasin D. S., Stinson F. S., Ogburn E., & Grant B. F. (2007). Prevalence, correlates, disability, and comorbidity of DSM–IV alcohol abuse and dependence in the United States: Results from the National Epidemiologic Survey on Alcohol and Related Conditions. Archives of General Psychiatry, 64, 830–842. 10.1001/archpsyc.64.7.830 [DOI] [PubMed] [Google Scholar]
- Hayward M., & Moran P. (2008). Comorbidity of personality disorders and mental illnesses. Psychiatry, 7, 102–104. 10.1016/j.mppsy.2008.01.010 [DOI] [Google Scholar]
- Israel S., Moffitt T. E., Belsky D. W., Hancox R. J., Poulton R., Roberts B., et al. Caspi A. (2014). Translating personality psychology to help personalize preventive medicine for young adult patients. Journal of Personality and Social Psychology, 106, 484–498. 10.1037/a0035687 [DOI] [PMC free article] [PubMed] [Google Scholar]
- Jaffee S. R., Moffitt T. E., Caspi A., Fombonne E., Poulton R., & Martin J. (2002). Differences in early childhood risk factors for juvenile-onset and adult-onset depression. Archives of General Psychiatry, 59, 215–222. 10.1001/archpsyc.59.3.215 [DOI] [PubMed] [Google Scholar]
- Jeste D. V., Palmer B. W., Rettew D. C., & Boardman S. (2015). Positive psychiatry: Its time has come. The Journal of Clinical Psychiatry, 76, 675–683. 10.4088/JCP.14nr09599 [DOI] [PMC free article] [PubMed] [Google Scholar]
- Kendler K. S., Davis C. G., & Kessler R. C. (1997). The familial aggregation of common psychiatric and substance use disorders in the National Comorbidity Survey: A family history study. The British Journal of Psychiatry, 170, 541–548. 10.1192/bjp.170.6.541 [DOI] [PubMed] [Google Scholar]
- Kendler K. S., Gatz M., Gardner C. O., & Pedersen N. L. (2006). Personality and major depression: A Swedish longitudinal, population-based twin study. Archives of General Psychiatry, 63, 1113–1120. 10.1001/archpsyc.63.10.1113 [DOI] [PubMed] [Google Scholar]
- Kessler R. C., Berglund P., Demler O., Jin R., Merikangas K. R., & Walters E. E. (2005). Lifetime prevalence and age-of-onset distributions of DSM–IV disorders in the National Comorbidity Survey Replication. Archives of General Psychiatry, 62, 593–602. 10.1001/archpsyc.62.6.593 [DOI] [PubMed] [Google Scholar]
- Kessler R. C., McGonagle K. A., Zhao S., Nelson C. B., Hughes M., Eshleman S., et al. Kendler K. S. (1994). Lifetime and 12-month prevalence of DSM–III–R psychiatric disorders in the United States. Results from the National Comorbidity Survey. Archives of General Psychiatry, 51, 8–19. 10.1001/archpsyc.1994.03950010008002 [DOI] [PubMed] [Google Scholar]
- Keyes C. L. M. (2002). The mental health continuum: From languishing to flourishing in life. Journal of Health and Social Behavior, 43, 207–222. 10.2307/3090197 [DOI] [PubMed] [Google Scholar]
- Keyes C. L. M. (2005). Mental illness and/or mental health? Investigating axioms of the complete state model of health. Journal of Consulting and Clinical Psychology, 73, 539–548. 10.1037/0022-006X.73.3.539 [DOI] [PubMed] [Google Scholar]
- Kim-Cohen J., Caspi A., Moffitt T. E., Harrington H., Milne B. J., & Poulton R. (2003). Prior juvenile diagnoses in adults with mental disorder: Developmental follow-back of a prospective-longitudinal cohort. Archives of General Psychiatry, 60, 709–717. 10.1001/archpsyc.60.7.709 [DOI] [PubMed] [Google Scholar]
- Koenen K. C., Moffitt T. E., Roberts A. L., Martin L. T., Kubzansky L., Harrington H., et al. Caspi A. (2009). Childhood IQ and adult mental disorders: A test of the cognitive reserve hypothesis. The American Journal of Psychiatry, 166, 50–57. 10.1176/appi.ajp.2008.08030343 [DOI] [PMC free article] [PubMed] [Google Scholar]
- Lahey B. B. (2009). Public health significance of neuroticism. American Psychologist, 64, 241–256. 10.1037/a0015309 [DOI] [PMC free article] [PubMed] [Google Scholar]
- Merikangas K. R., Calkins M. E., Burstein M., He J.-P., Chiavacci R., Lateef T., et al. Gur R. E. (2015). Comorbidity of physical and mental disorders in the neurodevelopmental genomics cohort study. Pediatrics, 135(4), e927–e938. 10.1542/peds.2014-1444 [DOI] [PMC free article] [PubMed] [Google Scholar]
- Milne B. J. (2012). New Zealand Socio-economic Index 2006 (NZSEI-06): An introduction for social science researchers. New Zealand Sociology, 27, 117–127. [Google Scholar]
- Milne B. J., Caspi A., Harrington H., Poulton R., Rutter M., & Moffitt T. E. (2009). Predictive value of family history on severity of illness: The case for depression, anxiety, alcohol dependence, and drug dependence. Archives of General Psychiatry, 66, 738–747. 10.1001/archgenpsychiatry.2009.55 [DOI] [PMC free article] [PubMed] [Google Scholar]
- Moffitt T. E., Arseneault L., Belsky D., Dickson N., Hancox R. J., Harrington H., et al. Caspi A. (2011). A gradient of childhood self-control predicts health, wealth, and public safety. Proceedings of the National Academy of Sciences of the United States of America, 108, 2693–2698. 10.1073/pnas.1010076108 [DOI] [PMC free article] [PubMed] [Google Scholar]
- Moffitt T. E., Caspi A., Taylor A., Kokaua J., Milne B. J., Polanczyk G., & Poulton R. (2010). How common are common mental disorders? Evidence that lifetime prevalence rates are doubled by prospective versus retrospective ascertainment. Psychological Medicine, 40, 899–909. 10.1017/S0033291709991036 [DOI] [PMC free article] [PubMed] [Google Scholar]
- Molfese V. J. (2013). Perinatal risks across infancy and early childhood: What are the lingering effects on high and low risk samples? In DiLalla L. F. & Dollinger S. M. C. (Eds.), Assessment of biological mechanisms across the life span (pp. 53–70). Hillsdale, NJ: Erlbaum. [Google Scholar]
- Moos R. H., & Moos B. (1981). Family Environment Scale manual. Palo Alto, CA: Consulting Psychologists Press. [Google Scholar]
- Ozbay F., Johnson D. C., Dimoulas E., Morgan C. A., Charney D., & Southwick S. (2007). Social support and resilience to stress: From neurobiology to clinical practice. Psychiatry, 4, 35–40. [PMC free article] [PubMed] [Google Scholar]
- Pavot W., & Diener E. (1993). Review of the Satisfaction With Life Scale. Psychological Assessment, 5, 164–172. 10.1037/1040-3590.5.2.164 [DOI] [Google Scholar]
- Pedersen C. B., Mors O., Bertelsen A., Waltoft B. L., Agerbo E., McGrath J. J., et al. Eaton W. W. (2014). A comprehensive nationwide study of the incidence rate and lifetime risk for treated mental disorders. Journal of the American Medical Association Psychiatry, 71, 573–581. 10.1001/jamapsychiatry.2014.16 [DOI] [PubMed] [Google Scholar]
- Poulton R., Moffitt T. E., & Silva P. A. (2015). The Dunedin Multidisciplinary Health and Development Study: Overview of the first 40 years, with an eye to the future. Social Psychiatry and Psychiatric Epidemiology, 50, 679–693. 10.1007/s00127-015-1048-8 [DOI] [PMC free article] [PubMed] [Google Scholar]
- Regier D. A., & Robins L. N. (1991). Psychiatric disorders in America: The Epidemiologic Catchment Area Study. New York, NY: Free Press. [Google Scholar]
- Reiss F. (2013). Socioeconomic inequalities and mental health problems in children and adolescents: A systematic review. Social Science & Medicine, 90, 24–31. 10.1016/j.socscimed.2013.04.026 [DOI] [PubMed] [Google Scholar]
- Reynell J. (1969). The Reynell Developmental Language Scales. London, England: National Foundation for Educational Research. [Google Scholar]
- Rutter M., Tizard J., & Whitmore K. (1970). Education, health and behaviour. London, England: Longman Green. [Google Scholar]
- Schaefer J. D., Caspi A., Belsky D. W., Harrington H., Houts R., Israel S., et al. Moffitt T. E. (2016). Early-life intelligence predicts midlife biological age. The Journals of Gerontology, Psychological Sciences and Social Sciences, 71, 968–977. [DOI] [PMC free article] [PubMed] [Google Scholar]
- Sebastiani P., & Perls T. T. (2012). The genetics of extreme longevity: Lessons from the New England centenarian study. Frontiers in Genetics, 3, 277 10.3389/fgene.2012.00277 [DOI] [PMC free article] [PubMed] [Google Scholar]
- Seligman M. E. P., & Csikszentmihalyi M. (2000). Positive psychology. An introduction. American Psychologist, 55, 5–14. 10.1037/0003-066X.55.1.5 [DOI] [PubMed] [Google Scholar]
- Shalev I., Caspi A., Ambler A., Belsky D. W., Chapple S., Cohen H. J., et al. Moffitt T. E. (2014). Perinatal complications and aging indicators by midlife. Pediatrics, 134, e1315–e1323. 10.1542/peds.2014-1669 [DOI] [PMC free article] [PubMed] [Google Scholar]
- Simon G. E., & VonKorff M. (1995). Recall of psychiatric history in cross-sectional surveys: Implications for epidemiologic research. Epidemiologic Reviews, 17, 221–227. [DOI] [PubMed] [Google Scholar]
- Streiner D. L., Patten S. B., Anthony J. C., & Cairney J. (2009). Has ‘lifetime prevalence’ reached the end of its life? An examination of the concept. International Journal of Methods in Psychiatric Research, 18, 221–228. 10.1002/mpr.296 [DOI] [PMC free article] [PubMed] [Google Scholar]
- Takayanagi Y., Spira A. P., Roth K. B., Gallo J. J., Eaton W. W., & Mojtabai R. (2014). Accuracy of reports of lifetime mental and physical disorders: Results from the Baltimore Epidemiological Catchment Area study. Journal of the American Medical Association Psychiatry, 71, 273–280. 10.1001/jamapsychiatry.2013.3579 [DOI] [PMC free article] [PubMed] [Google Scholar]
- Terman L. M., & Merrill M. A. (1960). Stanford-Binet Intelligence Scale: Manual for the third revision form L-M. Boston, MA: Houghton Mifflin. [Google Scholar]
- Walker E., McGee R. E., & Druss B. G. (2015). Mortality in mental disorders and global disease burden implications: A systematic review and meta-analysis. JAMA Psychiatry, 72, 334–341. 10.1001/jamapsychiatry.2014.2502 [DOI] [PMC free article] [PubMed] [Google Scholar]
- Wechsler D. (1974). Manual for the Wechsler Intelligence Scale for Children, Revised. New York, NY: Psychological Corp. [Google Scholar]
- Weissman M. M., Gershon E. S., Kidd K. K., Prusoff B. A., Leckman J. F., Dibble E., et al. Guroff J. J. (1984). Psychiatric disorders in the relatives of probands with affective disorders: The Yale University—National Institute of Mental Health collaborative study. Archives of General Psychiatry, 41, 13–21. 10.1001/archpsyc.1984.01790120015003 [DOI] [PubMed] [Google Scholar]
- Weissman M. M., Wickramaratne P., Adams P., Wolk S., Verdeli H., & Olfson M. (2000). Brief screening for family psychiatric history: The family history screen. Archives of General Psychiatry, 57, 675–682. 10.1001/archpsyc.57.7.675 [DOI] [PubMed] [Google Scholar]
- Whiteford H. A., Degenhardt L., Rehm J., Baxter A. J., Ferrari A. J., Erskine H. E., et al. Vos T. (2013). Global burden of disease attributable to mental and substance use disorders: Findings from the Global Burden of Disease Study 2010. The Lancet, 382, 1575–1586. 10.1016/S0140-6736(13)61611-6 [DOI] [PubMed] [Google Scholar]
- The WHO World Mental Health Survey Consortium (2004). Prevalence, severity, and unmet need for treatment of mental disorders in the World Health Organization World Mental Health Surveys. JAMA: Journal of the American Medical Association, 291, 2581–2590. 10.1001/jama.291.21.2581 [DOI] [PubMed] [Google Scholar]
Associated Data
This section collects any data citations, data availability statements, or supplementary materials included in this article.