

Abstract
Common reports of over-response to food cues, difficulties with calorie restriction, and difficulty adhering to dietary guidelines suggest that eating behaviors could be interrelated in ways that influence weight management efforts. The feasibility of identifying robust eating phenotypes (showing face, content, and criterion validity) was explored based on well-validated individual eating behavior assessments. Adults (n=260; mean age 34 years) completed online questionnaires with measurements of nine eating behaviors including: appetite for palatable foods, binge eating, bitter taste sensitivity, disinhibition, food neophobia, pickiness and satiety responsiveness. Discovery-based visualization procedures that have the combined strengths of heatmaps and hierarchical clustering were used to investigate: 1) how eating behaviors cluster, 2) how participants can be grouped within eating behavior clusters, and 3) whether group clustering is associated with body mass index (BMI) and dietary self-efficacy levels. Two distinct eating behavior clusters and participant groups that aligned within these clusters were identified: one with higher drive to eat and another with food avoidance behaviors. Participants’ BMI (p=.0002) and dietary self-efficacy (p<.0001) were associated with cluster membership. Eating behavior clusters showed content and criterion validity based on their association with BMI (associated, but not entirely overlapping) and dietary self-efficacy. Identifying eating behavior phenotypes appears viable. These efforts could be expanded and ultimately inform tailored weight management interventions.
Keywords: Eating behaviors, Phenotypes, Heatmap, BMI, Self-efficacy
Introduction
Widespread public health efforts have been aimed at increasing the public’s awareness of the importance of maintaining balance in energy intake and expenditure to prevent the development of overweight and obesity (Krebs-Smith, Guenther, Subar, Kirkpatrick, & Dodd, 2010). Yet, population estimates show a lack of adherence to national guidelines for diet and physical activity and steady increase in weight in all age and ethnic groups (Krebs-Smith, et al., 2010). The effectiveness of formal weight loss interventions is also very low, with most participants regaining the weight they lost within 12 months after completing interventions (Dansinger, Tatsioni, Wong, Chung, & Balk, 2007; Stelmach-Mardas, Mardas, Walkowiak, & Boeing, 2014).
Achieving and maintaining weight loss and complying with dietary recommendations are most often undermined by eating behaviors (Swinburn & Egger, 2004). For example, to explain their poor adherence, intervention participants frequently report difficulty in restricting calories, inability to control eating, low palatability of diet-recommended foods, difficulty satisfying their appetite, and strong food cravings (Mattes, 2002; Truby, et al., 2006). Indeed, the validity of these explanations is supported by growing evidence of substantial individual variation in these and other characteristics including: food preferences (usually assessed through a bitter taste sensitivity test), food responsiveness, satiety responsiveness, perceptions of the reinforcing value of food, the experience of taste, and the capacity to voluntarily inhibit eating (French, Epstein, Jeffery, Blundell, & Wardle, 2012). These variations likely have genetic underpinnings and may cluster in individuals or families (Steinle, et al., 2002; Wardle & Carnell, 2009).
Numerous eating-related behaviors have been explored individually and shown to have validity. In their review, French and colleagues (2012) show that studies to date generally have assessed the association of a single eating behavior (e.g., eating in the absence of hunger) with energy intake and body mass index (BMI) (Shomaker, et al., 2010). For instance, a large body of literature has shown that increased disinhibition is associated with higher BMI (Bryant, King, & Blundell, 2008). Moreover, these studies have often been conducted with children and predominantly targeted to white populations. To date, there have been no systematic efforts to characterize whether well-validated eating behaviors may cluster in patterns that could be linked to specific weight or adherence-relevant outcomes. Deeper understanding of such clusters or behavioral “phenotypes” could inform intervention tailoring in ways that align with ongoing hopes for operationalizing precision medicine (Bray, et al., 2016).
To be maximally useful for intervention, so-called eating-related phenotypes should comply with several elements of validity (Van der Staay & Steckler, 2002). To show promise as robust phenotypes, identified clusters arguably should have face validity or conceptual meaning within the field of eating behavior. Clusters also should show content validity, that is, be measuring something beyond weight status (Haynes, Richard, & Kubany, 1995). Eating-related clusters also should show criterion validity, that is, have association with factors shown to be amenable to intervention and successful weight loss. Clusters associated with self-efficacy or the belief that one can accomplish a given behavior (Bandura, 1977) would be very useful for intervention tailoring. Self-efficacy has been shown to distinguish weight re-gainers from those who maintain weight loss (Stelmach-Mardas, et al., 2014) and to be one of the most promising mediators of positive weight outcomes (Teixeira, et al., 2015). Should self-efficacy levels align with specific eating-related phenotypes, intervention strategies could be tailored to these inclinations and evaluated in comparative effectiveness trials for added benefit.
This report describes a pilot study to explore the feasibility of identifying robust eating clusters or phenotypes that can be derived from well-validated individual measures of eating. To do so, a multi-step process was followed. Step 1: Confirmation of the psychometric properties of nine eating scales; Step 2: Applying innovative visual analytic strategies to evaluate whether these scales cluster into identifiable domains with face validity as eating phenotypes; Step 3: Testing the association of such clusters with weight status to assess content validity; and Step 4: To assess criterion validity, assessing the association between the clusters and self-efficacy for eating, a domain that may serve as a bridge between clusters and weight management. The goal of the current pilot research is to consider the viability and feasibility of creating eating behavior phenotypes. In the future, the goal of this program of research would be to guide tailored dietary interventions, and in turn, evaluate whether such interventions improve adherence to dietary recommendations for weight management.
Methods
Study population and procedure
Participants were randomly drawn from the National Institutes of Health’s Clinical Research Volunteer Program database. Participants included English-speaking adults (18 years and older). Participants with mailing and email addresses were sent an email informing them about the study; those who did not contact us to decline participation within one week of receiving the invitation email were mailed a study package. The package included study details, a copy of the consent form, a sealed envelope with a bitter taste strips kit, and an invitation letter offering them access to a password protected website to provide electronic consent and complete study questionnaires. The webpage contained three surveys that the participants could complete. The first survey included assessments of eating habits, and weight (main source of the present study data). The second survey included assessment of participants’ food preferences and bitter taste response (source of bitter taste data). The third survey, assessed participants’ family health history and beliefs about the role of heredity in eating habits and weight (no data from survey three are included here). Participants were incentivized $20 per survey. The study was approved by the National Human Genome Research Institute’s Institutional Review board.
Measures
Appetite for palatable foods
The Power of Food Scale (PFS) was used to measure food reward sensitivity (Appelhans, et al., 2011; Cappelleri, et al., 2009; Lowe, et al., 2009). This 15-item scale measures the appetite for, rather than consumption of, palatable foods and includes three subscales: food available (6 items; e.g., ‘I find myself thinking about food even when I’m not physically hungry’, α=.91); food present (4 items; e.g., ‘If I see or smell a food I like, I get a powerful urge to have some’, α=.90) and food tasted (5 items; e.g., ‘When I eat delicious food I focus a lot on how good it tastes’, α=.82) (Lowe, et al., 2009). The answers were categorized on a 5-point Likert scale.
Binge eating
The frequency of binge eating episodes was assessed using one question: ‘In the last 12 months, how often did you engage in episodes of binge eating?’; An episode of binge eating was defined for participants as ‘eating an unusually large amount of food in one go that resulted in the feeling that your eating was out of control (that is, you could not prevent yourself from overeating, or that you could not stop eating once you had started)’; response categories ranged from 1=’not at all’ to 4=’two or more times a week’ (Madden, Leong, Gray, & Horwath, 2012).
Bitter taste sensitivity
Heightened sensitivity to bitter taste was measured using a strip paper taste test (Zhao, Kirkmeyer, & Tepper, 2003). The test was self-administered by participants with online instructions, and each participant received an envelope with a taste kit as part of the recruitment mailing package. The taste kit was composed of two paper strips previously impregnated with 30 micrograms of PROP/6-n-propylthiouracil. Participants were instructed to put the strip on their tongue and leave it for approximately 10 seconds until it was completely wet with saliva. They then had to check a box on the website indicating if they perceived: ‘no taste’, ‘bitter’ or ‘extremely bitter’; participants could choose not to answer. Results were coded as 1=non-taster, 2=taster, 3=supertasters respectively. PROP test strips were sourced by Supertaster Labs.
Disinhibition
Disinhibition is defined as an individual’s tendency to (over)eat in response to emotional states and social influences. We measured disinhibition with the Three Factor Eating Questionnaire (Stunkard & Messick, 1985). The disinhibition scale included 16-items rated as true or false, ranging from 0–16. Sample items include: ‘When I feel anxious, I find myself eating’; ‘Sometimes when I start eating I just can’t seem to stop’. Coefficient alpha reliability of .80.
Neophobia
The avoidance of -or reluctance to eat new foods (Birch & Fisher, 1998), was measured using the Food Neophobia Scale (Pliner & Hobden, 1992). This 10-item measure was answered on a 7-point Likert scale ranging from 1=’disagree strongly’ to 7=’agree strongly’. Sample items include: ‘I like foods from different countries’; ‘If I don’t know what is in food, I won’t try it’. Coefficient alpha reliability of .88.
Pickiness
Food pickiness was assessed using a single item: ‘I am fussy or picky about what I eat’. Participants answered on a 5-point scale ranging from 1=’strongly disagree’ to 5=’strongly agree’.
Satiety responsiveness
We adapted the Child Eating Behavior Questionnaire (CEBQ) for adults (Wardle, Guthrie, Sanderson, & Rapoport, 2001). Participants completed this 5-item scale that assessed their perceptions of internal satiety cues (e.g., ‘I get full before my meal is finished’). The scale is answered on a 5 point Likert-scale from 1=never to 5=always. Coefficient alpha reliability ranged from .74 to .83.
Adherence-relevant assessment
Dietary self-efficacy (SE) was measured using the Self-efficacy and Eating Habits Survey developed by Sallis and colleagues (1988). This is a 20-item scale answered on a 5-point scale ranging from 1=‘I know I cannot’ to 5=’I know I can’, with a ‘does not apply’ option. Items included questions about individual’s ability to: ‘Stick to your low fat, low salt food when you feel depressed, bored, or tense’; ‘Eat smaller portions of food at a party’.
Other participant characteristics
Each participant self-reported their date of birth (to calculate age), their weight and height [to calculate BMI (kg/m2)], as well as provided information about their income, gender, education and race/ethnicity. Additionally, participants answered a question about their weight management plans: ‘“which of the following best describes you”: I plan to lose weight in the next 30 days, I plan to lose weight in the next 6 months, I plan to increase my weight in the next 6 months, I plan to increase my weight in the next 30 days, I plan to maintain my weight.
Statistical analyses
Power analysis
A reasonably conservative effect difference of d=0.25 between factors was used to estimate the optimal sample size. With alpha=0.05 level and 80% power, a minimum of 224 participants was required to have sufficient power to observe differences between clusters.
Step 1: Descriptive statistics and factor analyses
Analyses were run using SAS version 9.3 (SAS Institute, Cary, NC, USA). Exploratory factor analyses were run on each of the individual eating behaviors scales to confirm their psychometric properties with our sample. This type of analysis is used to show commonalities in the data, and identify meaningful factors that relate to the same concept. Analyses indicated that some of the disinhibition items should be dropped from the scale to improve model fit. Thus, four items were omitted (‘it is not difficult for me to leave something on my plate’; ‘without even thinking about it, I take a long time to eat’; ‘my weight has hardly changed at all in the last ten years’ and ‘do you eat sensibly in front of others and splurge alone?’). Similarly, two items were dropped from the power of food subscale ‘food tasted” (‘just before I taste a favorite food, I feel intense anticipation’ and ‘hearing someone describe a great meal makes me really want to have something to eat’).
Data preparation
Given that each of the scales used different response categories it was necessary to standardize the scales before comparing them to each other in formal comparative analyses. In these cases, generally z-score normalization has been used. However, these techniques base the mean value (0) on the population mean rather than the scale mean. This approach makes it difficult to compare scales when one is more highly skewed than others (which was the case with our data). Thus, quantile normalization was used [normalize.quantiles package in R (Bolstad, Irizarry, Åstrand, & Speed, 2003)]. Unlike the z-score method, this normalization approach sets the median values and variances of the scales to be equal to each other, giving them equal intensity distributions and making it possible to compare values between scales.
Step 2: Face validity based on heatmap and hierarchical clustering
We performed hierarchical clustering to generate eating behavior clusters and heatmaps. Heatmaps are a discovery-based visualization method that allow for simultaneous view of the hierarchical clustering in both the rows (in this case, eating behaviors) and the columns (in this case, individual participants). This is accomplished by providing a color code to each value. For example, if an individual has a high value for a behavior, this is assigned a color intensity of red whereas if an individual has a low value for a behavior, a color intensity of green is assigned. Clustering is performed on the heatmap where eating behaviors (rows) that are similar to each other across all participants are clustered together. Individuals (columns) who are clustered together have similar eating behaviors, as shown in the simulated data of the supplemental figure. Hierarchical clustering can then be used to identify and group behaviors or individuals that are most likely to resemble each other. It provides a tree dendrogram that informs about the strength of the relationship between the behaviors. To determine how robust the clustering is, we performed bootstrapping with the pvclust package in R (Suzuki & Shimodaira, 2006). Bootstrapping was employed with n=1000 sampling-resampling iterations from the dataset. A bootstrapped (n=1000) hierarchical clustering tree or dendrogram was then generated. This method provides Approximately Unbiased (AUs) values that are considered a good approximation to an unbiased p-value, and are computed by multi-scale bootstrap resampling (Suzuki & Shimodaira, 2006, 2013). The AU p-value is given as a percentage, signifying the percentage of times the same cluster is found after multiple sampling/resampling processes. Given the relatively small sample size, AU values higher than .75 were considered, this indicates that a cluster could be replicated 75% of the time. Heatmaps and dendrograms were produced using the gplots (Warnes, et al., 2009), pvclust (Suzuki & Shimodaira, 2006) and pvrect (Suzuki & Shimodaira, 2013) packages in R.
Step 3 & 4: Content and Criterion Validity
Two vectors, one for BMI and one for dietary self-efficacy, were constructed based on the categorical distribution of participants. Each participant’s value for each variable was categorized, e.g., a BMI value >30 kg/m2 was categorized as obese and all participants within that category were assigned the color ‘light blue’ for the vector BMI in our sample. These color-coded values for each variable or vector (i.e., BMI or self-efficacy) were then displayed on the heatmap to determine how well the behaviors matched with the participants by BMI and dietary self-efficacy.
Results
Sample description
Of the 800 participants contacted at random from the database, 273 completed the first survey containing the eating behavior measures (34% response rate). Of these, 10 did not complete the taste test assessment and 3 did not complete self-efficacy measure and were therefore excluded from further analyses. This resulted in a final sample of 260 participants. Participants’ demographic data are presented in Table 1.
Table 1.
Sample Description
|
|
||
|---|---|---|
| n | % | |
| Total | 260 | 100.0 |
|
| ||
| Age (years) [range 18 – 69] | 34.5 ±11.5 | 100.0 |
|
| ||
| BMI (kg/m2) [range 17.7 – 57] | 26.7 ±5.9 | 100.0 |
| - Not overweight/obese (<25) | 118 | 45.4 |
| - Overweight (≥25 – < 30) | 78 | 30.0 |
| - Obese (≥30) | 64 | 24.6 |
|
| ||
| Gender | ||
| - Female | 150 | 57.7 |
| - Male | 110 | 42.3 |
|
| ||
| Education | ||
| - Less than college degree | 44 | 17.0 |
| - More than college degree (1 missing value) | 215 | 83.0 |
|
| ||
| Income | ||
| - $25,000 or less | 77 | 29.6 |
| - $25,001 to $50,000 | 63 | 24.2 |
| - $50,001 to $75,000 | 40 | 15.4 |
| - $75,001 to $100,000 | 40 | 15.4 |
| - More than $100,000 | 40 | 15.4 |
|
| ||
| Latino | ||
| - No | 237 | 92.2 |
| - Yes (3 missing values) | 20 | 7.8 |
|
| ||
| Race | ||
| - African American | 98 | 38.7 |
| - White | 105 | 41.5 |
| - Other (7 missing values) | 50 | 19.8 |
|
| ||
| Weight management plans | ||
| - Plans to lose weight within 30 days | 70 | 28 |
| - Plans to lose weight with 6 months | 84 | 33 |
| - Plans to increase weight within 30 days | 11 | 4 |
| - Plans to increase weight within 6 months | 5 | 2 |
| - Plans to maintain weight (8 missing values) | 82 | 33 |
Eating Behavior Clusters
Descriptive statistics for the eating behaviors of interest are presented in Table 2.
Table 2.
Eating behavior description
| Eating behaviors | Scale range | Mean | Std Dev | Std Error | N | Cronbach Alpha (α) |
|---|---|---|---|---|---|---|
| Disinhibition | 0–12 | 4.30 | 3.38 | 0.21 | 260 | 0.86 |
| Power of Food Scale (PFS) | ||||||
| - Food available | 1–5 | 2.05 | 1.03 | 0.06 | 260 | 0.89 |
| - Food present | 1–5 | 2.74 | 1.16 | 0.07 | 259 | 0.86 |
| - Food tasted | 1–5 | 2.82 | 1.06 | 0.07 | 258 | 0.65 |
| Binge Eating | 1–4 | 1.62 | 0.83 | 0.05 | 256 | - |
| Pickiness | 1–5 | 3.13 | 1.28 | 0.08 | 260 | - |
| Neophobia | 1–7 | 2.97 | 1.34 | 0.08 | 260 | 0.90 |
| Satiety responsiveness | 1–5 | 2.67 | 0.67 | 0.04 | 260 | 0.75 |
| Bitter taster status | Categories | % | N | |||
| - Non-taster | 1 | 16 | - | - | 41 | - |
| - Taster | 2 | 39 | - | - | 101 | - |
| - Supertaster | 3 | 45 | - | - | 118 | - |
In order to evaluate whether the eating behaviors formed clusters that have face validity as potential eating phenotypes (Step 2), used two complementary methods were used: Factor analysis and hierarchical clustering. First, a factor analysis with Varimax rotation (Table 3.) suggested a three factor structure, with Eigenvalues >1, with factor 1 including disinhibited eating, the three subscales of the PFS and binge eating. The second factor included pickiness, food neophobia and satiety responsiveness, while bitter taste loaded on a third factor.
Table 3.
Factor loadings based on factor analysis with Varimax rotation done on the nine eating behaviors of interest
|
|
|||
|---|---|---|---|
| Factor 1 | Factor 2 | Factor 3 | |
| Disinhibition | 0.81 | −0.10 | −0.01 |
| Food available | 0.86 | −0.10 | −0.12 |
| Food present | 0.85 | −0.10 | −0.09 |
| Food tasted | 0.66 | 0.02 | −0.15 |
| Binge Eating | 0.68 | 0.07 | 0.21 |
| Pickiness | −0.02 | 0.83 | −0.14 |
| Neophobia | 0.02 | 0.83 | 0.01 |
| Satiety responsiveness | −0.27 | 0.43 | 0.39 |
| Bitter taste | 0.01 | −0.12 | 0.90 |
Hierarchical clustering was then used to assess the cluster structure, using a dendrogram that displays the strength of the relationship between the eating behaviors (Fig. 1). After applying a multiscale bootstrap resampling, generating B=1000 replications for each sample, clusters with an Approximate Unbiased (AU) p-value higher than 75% confidence, which is a good fit for the data given the sample size, were considered to be supported by the data. The hierarchical clustering analysis replicated two clusters. Cluster 1 comprised the disinhibition scale, the three subscales of the power of food scale and binge eating. Cluster 2 included pickiness, food neophobia and satiety responsiveness. Both of these clusters met the .75 criteria for replication. Bootstrapping results also indicated that bitter taste was found as a cluster only in 63% of the resampling cases, which was below our 75% criteria. Thus, bitter taster status was not similar enough to the other behaviors to fit well in the dendrogram nor was it included as a separate standalone cluster.
Figure 1.
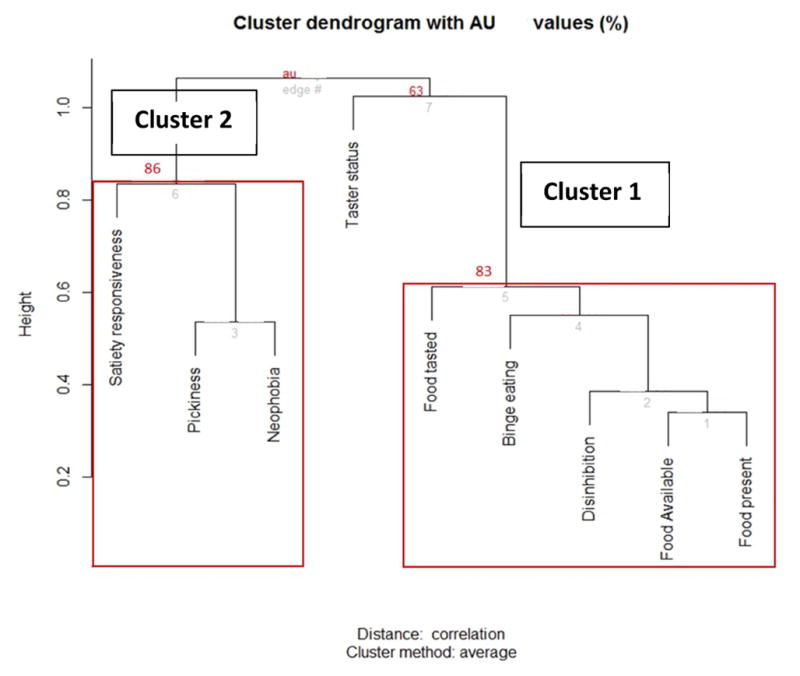
Hierarchical clustering tree of eating behavior measures. Clusters 1 and 2 reflect eating behavior clusters suggested by the tree dendrogram. Red values represent approximately unbiased p-values after bootstrapping and provide a better estimate than the Bootstrap Probability values.
As shown in the dendrogram in Fig. 1, the hierarchical clustering analysis also helps visualize the behaviors’ relationships and closeness to each other within each factor. For instance, pickiness, neophobia and satiety responsiveness belong to the same cluster as shown by factor analysis. However, hierarchical clustering showed additionally that neophobia and pickiness are more similar to each other than to satiety responsiveness. Likewise, food available and food present also were more similar to each other than the other behaviors in Cluster 1.
Participant Clusters
The final step in the cluster assessment process was to use a heatmap visualization method to capture both the participant/individual-level data (hereafter referred to as P-cluster) and the eating behavior-level data (hereafter referred to as EB-cluster) simultaneously to visualize how the behaviors relate to each other (Fig. 2). The heatmap was coded to cluster participants into groups within the EB clusters. Participants were dichotomized on the heatmap into P-cluster 1 and P-cluster 2 based on the two highest-levels of participant clustering (top dendrogram in Fig. 2). The primary difference found was that participants in P-cluster 1 had lower disinhibition, higher rates of binge eating and higher appetite for palatable food in the environment than those in P-cluster 2. This classification was further used to investigate content and criterion validity.
Figure 2.

Heatmap showing the eating behavior clustering (rows; EB-clusters 1 and 2) on the left and the participants clustering (columns; P-clusters 1 and 2) on the top. Two vectors representing participants’ BMI group (underweight and normal weight referred to as the not overweight/obese group, overweight group and obese group), as well as their self-efficacy level (lower, moderate or higher dietary self-efficacy) are shown at the bottom of the participant cluster tree. A visual examination of the heatmap shows two distinct participant clusters as shown at the bottom of the tree: P-cluster 1 with 143 participants and P-cluster 2 with 117 participants.
Step 3: Content validity
The next step explored whether the participants’ cluster membership was associated with, but retained additional variation that was distinct from, their BMI. To do so, a vector indicating each individual’s BMI category was overlaid on the heatmap. Because this is a visualization and exploration tool, the current analysis included four BMI categories in the heatmap: underweight (n=6; <18.5), normal weight (n=112; ≥18.5 – <25), overweight (n=78; ≥25 and <30) and obese (n=64; ≥30). Given the small size of the underweight group, they were combined with the normal weight participants to create a ‘not overweight/obese’ group used in subsequent analyses. BMI was thus divided into 3 main categories: not overweight/obese group (n=118; 45.4%; <25), overweight group (n=78; 30.0%; ≥25 and < 30) and obese group (n=64; 24.6%; ≥30). ≤3.5). The results (Fig. 3. a.) show that individuals in P-cluster 1 had lower BMI (MPcl1=25.5, SD=5.28) than those in P-cluster 2 (MPcl2=28.2, SD=6.34); t (258)= −3.74, p =0.0002. Of the not overweight/obese individuals, 77 (65%) were in P-cluster 1 and 41 (35%) were in P-cluster 2; X2 (1, N = 118) = 10.98, p =0.0009. Of the overweight individuals, 43 (55%) were in P-cluster 1 and 35 (45%) were in P-cluster 2; X2 (1, N = 78) = 0.82, p =0.361. Finally, of obese individuals, 23 (36%) were in P-cluster 1 and 41 (64%) were in P-cluster 2; X2 (1, N = 64) = 5.06, p =0.02. These patterns are qualitatively confirmed by a visual examination of the heatmap, as there is higher representation of obese (light blue) participants in P-cluster 2, for instance. These results show that although there is some association between BMI and participant clusters based on their assignment to specific EB-clusters, a part of the variation is still unaccounted for by BMI. In other words, the participant clusters are not simply a proxy for participant BMI.
Figure 3.

Box plots representing (a) BMI and (b) self-efficacy distributions across participants in P-cluster 1 and those in P-cluster 2. The graphs are representing the frequency of participants in each cluster by (a) BMI and (b) self-efficacy.
Step 4, Criterion validity
We explored whether P-clusters were associated with participants’ dietary self-efficacy. Dietary self-efficacy (SE) (α=0.92; Mean=3.95 ±0.77 SD) was divided into 3 categories: higher SE group (n=76; 29%; ≥4.5), moderate SE group (n=116; 45%; <3.5 and >4.5) and lower SE group (n=68; 26%; ≤3.5). The results (Fig. 3. b.) show that individuals in P-cluster 1 had a higher self-efficacy (MPcl1=4.15, SD=0.78) than those in P-cluster 2 (MPcl2=3.76, SD=0.71); t (255.51) = 4.14, p <.0001. Of individuals with higher self-efficacy, 57 (75%) were in P-cluster 1 and 19 (25%) were in P-cluster 2; X2 (1, N = 76) = 19.00, p <.0001. Of individuals with moderate self-efficacy, 60 (52%) were in P-cluster 1 and 56 (48%) were in P-cluster 2; X2 (1, N = 116) = 0.14, p =0.71. Finally, of individuals with lower self-efficacy, 26 (38%) were in P-cluster 1, and 42 (62%) were in P-cluster 2; X2 (1, N = 68) = 3.76, p =0.05. See Fig. 3. b. These patterns are qualitatively apparent through visual examination of P-clusters 1 and 2 in the heatmap, as there was a higher representation of higher self-efficacy (yellow) participants in P-cluster 1, for example.
Discussion
The current report explored the feasibility of identifying clusters of eating behaviors comprising robust eating phenotypes. The results show that the several eating behaviors did indeed cluster as phenotypes, showing face validity through heatmap and hierarchical clustering, and also showed both content and criterion validity through their association with weight and dietary self-efficacy, respectively.
Face validity was evident through the use of hierarchical clustering. We were able to visualize and evaluate the behaviors based on their similarity. The resulting dendrogram suggested that eight of the nine eating behaviors considered strongly contributed to one of two main clusters. In looking closely at the behaviors, they aligned into factors associated with a drive to eat (i.e., higher appetite for palatable foods, higher rates of binge eating, more disinhibition; i.e., EB-cluster 1), and factors associated with food avoidance (i.e., higher rates of pickiness, increased food neophobia, and lower satiety responsiveness; i.e., EB-cluster2),.
EB-cluster 1 included behaviors related to the drive or proneness to higher food intake or overeating (e.g., binge eating). This cluster is consistent with the broader literature. For instance, disinhibition and binge eating have both been found to correlate with the three Power of Food Scale (PFS) subscales in previous work (Lowe & Butryn, 2007; Witt & Lowe, 2014). In addition, the PFS has been used successfully as a proxy for food reward sensitivity and used to reflect an individual’s response to palatable food in the environment (Appelhans, et al., 2011). The current results confirm and extend these results in a sample of healthy adults. Individuals with such profiles may benefit from programs that emphasize skill building to manage food cravings as well as subsequent food consumption in encounters with food-dense environments. In turn, comparative effectiveness trials could then be conducted to evaluate any benefits or downsides of such tailored approaches. EB-cluster 2 seems to include higher food neophobia, increased pickiness and lower satiety responsiveness. Hierarchical clustering identified food neophobia and pickiness as being quite similar to each other, in line with previous reports (Kauer, Pelchat, Rozin, & Zickgraf, 2015). Other findings have also highlighted the behavioral and etiological distinction between behaviors that, in this analysis, loaded on separate clusters. For example, previous work has distinguished picky eating from disordered eating behaviors such as binge eating (Wildes, Zucker, & Marcus, 2012). The last behavior in the pickiness/neophobia cluster is satiety responsiveness. This behavior indicates internal response to satiety cues that, when low, may lead to a failure in energy intake regulation and potential weight increase (Llewellyn, Trzaskowski, van Jaarsveld, Plomin, & Wardle, 2014). Although on the surface, this behavior may have less in common with pickiness and neophobia, it has been linked in previous work to ‘food avoidance’ behavior (Jani, Mallan, & Daniels, 2015), which shares similar features to these behaviors. Also, in a recent pediatric study, satiety responsiveness was found to belong to a ‘fussy eating behavior’ profile that also included high food fussiness and low responsiveness to food (Tharner, et al., 2014). As such, identifying participants who exhibit this phenotype (i.e., pickiness, food neophobia and low satiety responsiveness) may be a first step toward identifying those who have difficulty adhering to dietary recommendations to increase food variety as well as fruit and vegetable intake. Thus, among these individuals, alternative recommendations or adaptation of the standard recommendations might be warranted.
Bitter taster status was removed from our model due to its poor fit with the other eating behaviors. This might have resulted from conceptual differences between it and other behaviors, and/or the difference in measurement methods used to assess each. While other eating behaviors (except the disinhibition scale) were assessed using Likert-type scales, bitter taste was assessed using a single question about perceived taste after administering the PROP strip (e.g., does not taste, tastes as bitter, or tastes extremely bitter). Conceptually, bitter taster status was initially included due to the compelling evidence that individual differences in sensitivity to bitter taste can be a significant barrier to healthy eating and a risk factor for overweight and obesity (Berthoud & Zheng, 2012; Tepper, Banni, Melis, Crnjar, & Tomassini Barbarossa, 2014). Other measures of bitter taste might have yielded different results such as taste solutions and a gradual evaluation of bitter intensity or bitter preference. However, given the nature of this study (self-administered) such measures were not feasible.
In addition to looking at the associations between the eating behaviors, the current study also investigated content and criterion validity of the clusters through their associations with BMI and self-efficacy vectors. Indeed, the clusters of eating behaviors when examined in relation to participant clusters and the corresponding BMI and self-efficacy of participants within those clusters, provided valuable information about their validity. Participants fell into one of two primary clusters in terms of their similarity at the eating behavior level. These clusters were also found to be associated with BMI, demonstrating content validity.
The participant cluster exhibiting higher levels of disinhibition and binge eating had more participants in the highest BMI category. Thus, as anticipated, participant groups that were identified based on similarity with respect to clustering of eating behaviors also had some overlap with participant BMI. However, there was much variance in each cluster that was unaccounted for by BMI, indicating that these clusters are not simply a BMI proxy and have independent meaning and importance. The clusters also showed evidence of criterion validity. The participant clusters identified were associated with participants’ level of dietary self-efficacy. This important finding indicates that these phenotypes may operate on participants’ weight, in part, through dietary self-efficacy and related motivational factors. Self-efficacy is a key factor in one’s ability to follow recommendations and maintain adherence (Stelmach-Mardas, et al., 2014). In a recent review, self-efficacy was described as the potential “transformational missing link to innovatively address the growing obesity crisis” (Cataldo, John, Chandran, Pati, & Shroyer, 2013).
Efforts to tailor and thus improve the effectiveness of weight management and weight gain prevention interventions may be bolstered through a focus on complex, multi-trait phenotypes, such as the ones described here. Hawkins and Kreuter (2008) conceptualize a continuum of levels of customization ranging from mass audience targeting to highly individualized tailoring. Indeed, emerging knowledge in nutrigenomics suggests individualized tailoring of dietary recommendations based on genotype (Livingstone, et al., 2016). We envision that tailoring based on eating phenotypes might be an additional intermediate alternative upon which weight maintenance recommendations and strategies could be based (e.g., for individuals strong on neophobia and pickiness, such as in cluster 2, recommendations would emphasize ways to expand palatability of new foods that could help stave off hunger). If these phenotypes can be replicated by other research, then formative intervention research could be initiated to operationalize such a tailored approach. In turn, comparative effectiveness trials could then be conducted to evaluate any benefits or downsides of such tailored approaches (McBride, Bryan, Bray, Swan, & Green, 2012). In this way, future research could explore whether tailoring interventions consistent with these or other developed eating behavior phenotypes improves participants’ self-efficacy to adhere to weight management recommendations.
Given these preliminary results, it is worth considering a broader array of eating behaviors (e.g., eating in the absence of hunger). By using the approaches delineated here, researchers may be able to identify clusters of eating behaviors or phenotypes that could be barriers to achieving healthy weight. Eating behavior phenotypes could be examined at the individual or family level. In terms of ongoing scientific efforts, the present findings and methods could also help identify the overlap between scales and / or the items that comprise them, and whether some measures may be omitted or useful as proxies for others. In addition, other measures such as self-control and body image might also be explored in future work aimed at highlighting potential pathways that are sensitive to weight management or weight-loss intervention.
This study has a few limitations. Given that it was a feasibility study, we considered only a limited number of behaviors at a single time point. In addition, although bitter taster status dropped out of our analyses, it may be an important behavior that if measured or considered differently could show important associations. The sample size may also have limited the strength of conclusions on the associations between behaviors, and the associations between behaviors and outcomes. Using a heterogeneous healthy sample of participants with a range of weights, racial/ethnic group memberships, etc. might have increased variability and made it more difficult to see associations. Furthermore, the data used here were self-report rather than behavioral as this is the typical approach for measuring these constructs. In addition, the self-reported nature of weight, might have introduced additional variability, although it provided crucial preliminary data in the context of this feasibility study. Future work using similar approaches with clinical samples or with individuals explicitly seeking weight loss programs could provide a more fine-grained set of results.
Using these discovery-based visualization methods is fairly new to the social and behavioral sciences. Such findings need to be retested, extended and replicated. They should also be considered for more frequent implementation in various areas of the field and with various datasets. For example, a recent paper successfully used heatmaps and clustering to identify multiple risk factors associated with gun possession among youth based on national available data (Ruggles & Rajan, 2014). Discovery-based visualization methods could help researchers understand complex interrelationships among behaviors and help elucidate patterns that would not be clear using more traditional methods.
Efforts to identify robust eating behavior phenotypes could be used to tailor and improve the “fit” of weight management programs. Future studies should extend the search for other eating behaviors and phenotypes as well as other mechanisms associated with weight loss that could be leveraged for a new generation of precision interventions.
Conclusion
Overall, the present work demonstrates the feasibility of identifying eating behavior clusters that have face, content and criterion validity, using discovery-based visualization and exploratory tools. Two main clusters were identified within this study population and the set of pilot measures used. Such approaches could and should be further expanded upon, replicated and leveraged to test their potential practical implications in improving behavioral interventions.
Supplementary Material
Acknowledgments
The authors would like to thank David Kanney and Andy Baxevanis for setting up the study website, Deanna Wilson for assistance with participant follow-up and payments, Christopher Marcum for consults on earlier statistical analyses; Mandy Jawara and Dinora Dominguez for their assistance with the clinical research volunteer database. This work was supported by the Intramural Research Program of the National Human Genome Research Institute [grant number Z01 HG200396-01].
Footnotes
Publisher's Disclaimer: This is a PDF file of an unedited manuscript that has been accepted for publication. As a service to our customers we are providing this early version of the manuscript. The manuscript will undergo copyediting, typesetting, and review of the resulting proof before it is published in its final citable form. Please note that during the production process errors may be discovered which could affect the content, and all legal disclaimers that apply to the journal pertain.
References
- Appelhans BM, Woolf K, Pagoto SL, Schneider KL, Whited MC, Liebman R. Inhibiting food reward: delay discounting, food reward sensitivity, and palatable food intake in overweight and obese women. Obesity (Silver Spring) 2011;19:2175–2182. doi: 10.1038/oby.2011.57. [DOI] [PMC free article] [PubMed] [Google Scholar]
- Bandura A. Self-efficacy: toward a unifying theory of behavioral change. Psychol Rev. 1977;84:191–215. doi: 10.1037//0033-295x.84.2.191. [DOI] [PubMed] [Google Scholar]
- Berthoud HR, Zheng H. Modulation of taste responsiveness and food preference by obesity and weight loss. Physiology & Behavior. 2012;107:527–532. doi: 10.1016/j.physbeh.2012.04.004. [DOI] [PMC free article] [PubMed] [Google Scholar]
- Birch LL, Fisher JO. Development of eating behaviors among children and adolescents. Pediatrics. 1998;101:539–549. [PubMed] [Google Scholar]
- Bolstad BM, Irizarry RA, Åstrand M, Speed TP. A comparison of normalization methods for high density oligonucleotide array data based on variance and bias. Bioinformatics. 2003;19:185–193. doi: 10.1093/bioinformatics/19.2.185. [DOI] [PubMed] [Google Scholar]
- Bray MS, Loos RJF, McCaffery JM, Ling C, Franks PW, Weinstock GM, Snyder MP, Vassy JL, Agurs-Collins T The Conference Working G. NIH working group report—using genomic information to guide weight management: From universal to precision treatment. Obesity. 2016;24:14–22. doi: 10.1002/oby.21381. [DOI] [PMC free article] [PubMed] [Google Scholar]
- Bryant EJ, King NA, Blundell JE. Disinhibition: its effects on appetite and weight regulation. Obesity Reviews. 2008;9:409–419. doi: 10.1111/j.1467-789X.2007.00426.x. [DOI] [PubMed] [Google Scholar]
- Cappelleri JC, Bushmakin AG, Gerber RA, Leidy NK, Sexton CC, Karlsson J, Lowe MR. Evaluating the Power of Food Scale in obese subjects and a general sample of individuals: development and measurement properties. Int J Obes (Lond) 2009;33:913–922. doi: 10.1038/ijo.2009.107. [DOI] [PubMed] [Google Scholar]
- Cataldo R, John J, Chandran L, Pati S, Shroyer AL. Impact of physical activity intervention programs on self-efficacy in youths: a systematic review. ISRN Obes. 2013;2013:586497. doi: 10.1155/2013/586497. [DOI] [PMC free article] [PubMed] [Google Scholar]
- Dansinger ML, Tatsioni A, Wong JB, Chung M, Balk EM. Meta-analysis: the effect of dietary counseling for weight loss. Annals of Internal Medicine. 2007;147:41–50. doi: 10.7326/0003-4819-147-1-200707030-00007. [DOI] [PubMed] [Google Scholar]
- French SA, Epstein LH, Jeffery RW, Blundell JE, Wardle J. Eating behavior dimensions. Associations with energy intake and body weight. A review. Appetite. 2012;59:541–549. doi: 10.1016/j.appet.2012.07.001. [DOI] [PMC free article] [PubMed] [Google Scholar]
- Hawkins RP, Kreuter M, Resnicow K, Fishbein M, Dijkstra A. Understanding tailoring in communicating about health. Health Education Research. 2008;23:454–466. doi: 10.1093/her/cyn004. [DOI] [PMC free article] [PubMed] [Google Scholar]
- Haynes SN, Richard D, Kubany ES. Content validity in psychological assessment: A functional approach to concepts and methods. Psychological assessment. 1995;7:238. [Google Scholar]
- Jani R, Mallan KM, Daniels L. Association between Australian-Indian mothers’ controlling feeding practices and children’s appetite traits. Appetite. 2015;84:188–195. doi: 10.1016/j.appet.2014.10.020. [DOI] [PubMed] [Google Scholar]
- Kauer J, Pelchat ML, Rozin P, Zickgraf HF. Adult picky eating. Phenomenology, taste sensitivity, and psychological correlates. Appetite. 2015;90:219–228. doi: 10.1016/j.appet.2015.03.001. [DOI] [PMC free article] [PubMed] [Google Scholar]
- Krebs-Smith SM, Guenther PM, Subar AF, Kirkpatrick SI, Dodd KW. Americans do not meet federal dietary recommendations. J Nutr. 2010;140:1832–1838. doi: 10.3945/jn.110.124826. [DOI] [PMC free article] [PubMed] [Google Scholar]
- Livingstone KM, Celis-Morales C, Lara J, Woolhead C, O’Donovan CB, Forster H, Marsaux CF, Macready AL, Fallaize R, Navas-Carretero S. Clustering of adherence to personalised dietary recommendations and changes in healthy eating index within the Food4Me study. Public Health Nutrition. 2016:1–10. doi: 10.1017/S1368980016001932. [DOI] [PMC free article] [PubMed] [Google Scholar]
- Llewellyn CH, Trzaskowski M, van Jaarsveld CHM, Plomin R, Wardle J. Satiety Mechanisms in Genetic Risk of Obesity. Jama Pediatrics. 2014;168:338–344. doi: 10.1001/jamapediatrics.2013.4944. [DOI] [PMC free article] [PubMed] [Google Scholar]
- Lowe MR, Butryn ML. Hedonic hunger: A new dimension of appetite? Physiology & Behavior. 2007;91:432–439. doi: 10.1016/j.physbeh.2007.04.006. [DOI] [PubMed] [Google Scholar]
- Lowe MR, Butryn ML, Didie ER, Annunziato RA, Thomas JG, Crerand CE, Ochner CN, Coletta MC, Bellace D, Wallaert M, Halford J. The Power of Food Scale. A new measure of the psychological influence of the food environment. Appetite. 2009;53:114–118. doi: 10.1016/j.appet.2009.05.016. [DOI] [PubMed] [Google Scholar]
- Madden CEL, Leong SL, Gray A, Horwath CC. Eating in response to hunger and satiety signals is related to BMI in a nationwide sample of 1601 mid-age New Zealand women. Public Health Nutrition. 2012;15:2272–2279. doi: 10.1017/S1368980012000882. [DOI] [PMC free article] [PubMed] [Google Scholar]
- Mattes RD. Feeding behaviors and weight loss outcomes over 64 months. Eating Behaviors. 2002;3:191–204. doi: 10.1016/s1471-0153(01)00059-9. [DOI] [PubMed] [Google Scholar]
- McBride CM, Bryan AD, Bray MS, Swan GE, Green ED. Health behavior change: can genomics improve behavioral adherence? Am J Public Health. 2012;102:401–405. doi: 10.2105/AJPH.2011.300513. [DOI] [PMC free article] [PubMed] [Google Scholar]
- Pliner P, Hobden K. Development of a scale to measure the trait of food neophobia in humans. Appetite. 1992;19:105–120. doi: 10.1016/0195-6663(92)90014-w. [DOI] [PubMed] [Google Scholar]
- Ruggles KV, Rajan S. Gun possession among American youth: a discovery-based approach to understand gun violence. PLoS One. 2014;9:e111893. doi: 10.1371/journal.pone.0111893. [DOI] [PMC free article] [PubMed] [Google Scholar]
- Sallis JF, Pinski RB, Grossman RM, Patterson TL, Nader PR. The development of self-efficacy scales for healthrelated diet and exercise behaviors. Health Education Research. 1988;3:283–292. [Google Scholar]
- Shomaker LB, Tanofsky-Kraff M, Zocca JM, Courville A, Kozlosky M, Columbo KM, Wolkoff LE, Brady SM, Crocker MK, Ali AH, Yanovski SZ, Yanovski JA. Eating in the absence of hunger in adolescents: intake after a large-array meal compared with that after a standardized meal. The American Journal of Clinical Nutrition. 2010;92:697–703. doi: 10.3945/ajcn.2010.29812. [DOI] [PMC free article] [PubMed] [Google Scholar]
- Steinle NI, Hsueh WC, Snitker S, Pollin TI, Sakul H, St Jean PL, Bell CJ, Mitchell BD, Shuldiner AR. Eating behavior in the Old Order Amish: heritability analysis and a genome-wide linkage analysis. American Journal of Clinical Nutrition. 2002;75:1098–1106. doi: 10.1093/ajcn/75.6.1098. [DOI] [PubMed] [Google Scholar]
- Stelmach-Mardas M, Mardas M, Walkowiak J, Boeing H. Long-term weight status in regainers after weight loss by lifestyle intervention: status and challenges. Proc Nutr Soc. 2014;73:509–518. doi: 10.1017/S0029665114000718. [DOI] [PubMed] [Google Scholar]
- Stunkard AJ, Messick S. The three-factor eating questionnaire to measure dietary restraint, disinhibition and hunger. Journal of Psychosomatic Research. 1985;29:71–83. doi: 10.1016/0022-3999(85)90010-8. [DOI] [PubMed] [Google Scholar]
- Suzuki R, Shimodaira H. Pvclust: an R package for assessing the uncertainty in hierarchical clustering. Bioinformatics. 2006;22:1540–1542. doi: 10.1093/bioinformatics/btl117. [DOI] [PubMed] [Google Scholar]
- Suzuki R, Shimodaira H. R package. 2013. Hierarchical clustering with P-values via multiscale bootstrap resampling. [Google Scholar]
- Swinburn B, Egger G. The runaway weight gain train: too many accelerators, not enough brakes. BMJ: British Medical Journal. 2004;329:736. doi: 10.1136/bmj.329.7468.736. [DOI] [PMC free article] [PubMed] [Google Scholar]
- Teixeira PJ, Carraca EV, Marques MM, Rutter H, Oppert JM, De Bourdeaudhuij I, Lakerveld J, Brug J. Successful behavior change in obesity interventions in adults: a systematic review of self-regulation mediators. BMC Med. 2015;13:84. doi: 10.1186/s12916-015-0323-6. [DOI] [PMC free article] [PubMed] [Google Scholar]
- Tepper BJ, Banni S, Melis M, Crnjar R, Tomassini Barbarossa I. Genetic sensitivity to the bitter taste of 6-n-propylthiouracil (PROP) and its association with physiological mechanisms controlling body mass index (BMI) Nutrients. 2014;6:3363–3381. doi: 10.3390/nu6093363. [DOI] [PMC free article] [PubMed] [Google Scholar]
- Tharner A, Jansen P, Kiefte-de Jong J, Moll H, van der Ende J, Jaddoe V, Hofman A, Tiemeier H, Franco O. Toward an operative diagnosis of fussy/picky eating: a latent profile approach in a population-based cohort. International Journal of Behavioral Nutrition and Physical Activity. 2014;11:14. doi: 10.1186/1479-5868-11-14. [DOI] [PMC free article] [PubMed] [Google Scholar]
- Truby H, Baic S, deLooy A, Fox KR, Livingstone MBE, Logan CM, Macdonald IA, Morgan LM, Taylor MA, Millward DJ. Randomised controlled trial of four commercial weight loss programmes in the UK: initial findings from the BBC “diet trials”. BMJ (Clinical research ed ) 2006;332:1309–1314. doi: 10.1136/bmj.38833.411204.80. [DOI] [PMC free article] [PubMed] [Google Scholar]
- Van der Staay F, Steckler T. The fallacy of behavioral phenotyping without standardisation. Genes, Brain and Behavior. 2002;1:9–13. doi: 10.1046/j.1601-1848.2001.00007.x. [DOI] [PubMed] [Google Scholar]
- Wardle J, Carnell S. Appetite is a Heritable Phenotype Associated with Adiposity. Annals of Behavioral Medicine. 2009;38:S25–S30. doi: 10.1007/s12160-009-9116-5. [DOI] [PubMed] [Google Scholar]
- Wardle J, Guthrie CA, Sanderson S, Rapoport L. Development of the Children’s Eating Behaviour Questionnaire. J Child Psychol Psychiatry. 2001;42:963–970. doi: 10.1111/1469-7610.00792. [DOI] [PubMed] [Google Scholar]
- Warnes GR, Bolker B, Bonebakker L, Gentleman R, Huber W, Liaw A, Lumley T, Maechler M, Magnusson A, Moeller S. R package version, 2. 2009. gplots: Various R programming tools for plotting data. [Google Scholar]
- Wildes JE, Zucker NL, Marcus MD. Picky eating in adults: Results of a web-based survey. International Journal of Eating Disorders. 2012;45:575–582. doi: 10.1002/eat.20975. [DOI] [PubMed] [Google Scholar]
- Witt AA, Lowe MR. Hedonic hunger and binge eating among women with eating disorders. Int J Eat Disord. 2014;47:273–280. doi: 10.1002/eat.22171. [DOI] [PubMed] [Google Scholar]
- Zhao L, Kirkmeyer SV, Tepper BJ. A paper screening test to assess genetic taste sensitivity to 6-n-propylthiouracil. Physiology & Behavior. 2003;78:625–633. doi: 10.1016/s0031-9384(03)00057-x. [DOI] [PubMed] [Google Scholar]
Associated Data
This section collects any data citations, data availability statements, or supplementary materials included in this article.