

Abstract
Context:
Diabetes mellitus causes atherosclerosis and lipid abnormalities. Hypolipidemic and antioxidative properties of catechin (CTN) have been reported in several studies.
Objective:
This study assesses the possible protective effects of CTN against oxidative damage in the diabetic rats.
Materials and Methods:
The rats were divided into the control, untreated diabetic, and 3 CTN-treated diabetic groups (20, 40, and 80 mg/kg/d, intraperitoneal). The diabetic rats were induced by streptozotocin. Catechin was injected for 4 weeks. At the end of the experimental period, glucose, lipid profile, apoprotein A-I (apo A-I), apoprotein B (apo B), malondialdehyde (MDA) levels, and antioxidant enzymes including glutathione-S-transferase (GST), superoxide dismutase (SOD), and catalase (CAT) activities were determined in serum. Statistical analyses were performed using the InStat 3.0 program.
Results:
Streptozotocin caused an elevation of glucose, MDA, triglycerides (TGs), total cholesterol (TC), low-density lipoprotein cholesterol (LDL-C), and apo B with reduction in high-density lipoprotein cholesterol (HDL-C), apo A-I, SOD, CAT, and GST in the serum (P < .05). The findings showed that the significant elevation in the body weight, glucose, MDA, TG, TC, LDL-C, and apo B and reduction in HDL-C, apo A-I, SOD, CAT, and GST were ameliorated in the CTN-treated diabetic groups versus the untreated group, in a dose-dependent manner (P < .05).
Conclusion:
The present investigation proposes that CTN may ameliorate diabetes and its complications by modification of oxidative stress.
Keywords: green tea, hyperglycemia, oxidative indices, apoprotein, antidiabetic
Introduction
Diabetes mellitus (DM) can be identified as a group of diseases characterized by hyperglycemia and altered insulin action or secretion and metabolism of proteins, carbohydrates, and lipids. Dyslipidemia due to uncontrolled insulin resistance and hyperglycemia in diabetic condition are the major risk factors for coronary artery disease including atherosclerosis.1 Recently, oxidative stress has been considered as an important mechanism in the pathogenesis of diabetes and its complications.2
Mechanisms that contribute to the generation of oxidative stress in DM may consist of free radicals especially reactive oxygen species (ROS), nonenzymatic protein glycosylation, glucose autoxidation, altered glutathione (GSH) metabolism, modification in antioxidant enzymes, and lipid peroxide generation.3
It was indicated that oxidative stress alters protein, lipid, and carbohydrate metabolism4 and increases in patients with DM and proposes to induce endothelial cell dysfunction and trigger the development of atherosclerosis. Because of the enhanced risk of cardiovascular abnormalities in diabetic patients, the preventive medication design of normal blood lipids and reduction in oxidative stress should be studied.5 Several ethno-pharmacological studies have indicated the beneficial effects of medicinal plants on the management of diabetes and its complications. Recently, attention has been focused on the relationship between natural antioxidants and the inhibition of the DM progression.6-9 Green tea is used as one of the most popular traditional tea, dietary supplement, and beverage in worldwide.10 Green tea contains various amounts of catechins (CTNs), and several investigations have indicated that the antioxidant properties of green tea come from the flavonoids.11 Flavonoids are a group of polyphenol compounds detected in considerable quantities in plant foods especially in tea, onions, berries, and some medicinal plants. The health raising properties of flavonoids are commonly related to their redox antioxidant capacity rather than to the other molecular activities.12 Flavonoids are potent antioxidant detected in considerable quantities in the human diet.13,14 Catechin is one of the most flavonoids with relatively high antioxidant content.15 Some experimental studies reported antidiabetic, hypolipidemic, and antioxidative properties of CTN; however, the mechanism by which CTN is effective for controlling the diabetes has still been unclear.16,17 Therefore, the present study was planned to investigate the effects of CTN on blood glucose, serum levels of malondialdehyde (MDA, nmol/mL), glutathione-S-transferase (GST, U/mL), superoxide dismutase (SOD, U/mL), catalase (CAT, U/mL) activities, triglycerides (TGs, mg/dL), total cholesterol (TC, mg/dL), low-density lipoprotein cholesterol (LDL-C, mg/dL), high-density lipoprotein cholesterol (HDL-C, mg/dL), apoprotein B (apo B, mg/dL), and apoprotein A-I (apo A-I, mg/dL) in the streptozotocin (STZ)-diabetic rats.
Materials and Methods
Reagents
All purified enzymes, coenzymes, substrates, standards, buffers, kits, and also CTN and other chemicals were purchased from Sigma-Aldrich Chemical (St Louis, Missouri) and Pars Azmoon (IRI, Tehran) companies.
Animals
Wistar albino rats (2 months; 200 ± 13 g) were bred at the university experimental animal care center. Animals were maintained under standard environmental conditions and had free access to standard rodent feed and water.
Study Design
A total of 40 male Wistar albino rats were randomly allotted to 5 experimental groups (n = 8 per group) as follows—group 1, control (C); group 2, diabetic (D); group 3, diabetic and CTN treated (20 mg/kg/d; D + CTN20); group 4, diabetic and CTN treated (40 mg/kg/d; D + CTN40); and group 5, diabetic with CTN treated (80 mg/kg/d; D + CTN80). Rats were kept in their own cages at constant room temperature (21°C ± 2°C) under a normal 12 hours light/dark cycle with free access to food and water at Mashhad University of Medical Sciences. The animals were housed according to the regulations for the welfare of experimented animals. The study was conducted in the Experimental Animal Research Laboratory of Mashhad Medical University. Protocols were approved by the ethical committee (The Ethical Research Committee of Mashhad University of Medical Sciences). On the first day of the study, the diabetic groups were given STZ in a single intraperitoneal (IP) injection at a dose of 60 mg/kg for the induction of diabetes. Blood was extracted from the tail vein for glucose analysis 72 hours after STZ injection. Rats with blood glucose levels higher than 250 mg/dL were accepted as being diabetic. In the control groups (C), physiological saline (IP) was injected as a vehicle. Catechin was injected (IP) to the treatment groups from 3 days after STZ administration for 4 weeks. Blood glucose level and body weights were recorded at weekly intervals. After 4 weeks, animals were anesthetized by ether, and blood was subsequently collected from the retro orbital sinus. Blood and sera were separated by centrifugation at 3000 rpm for 10 minutes for glucose, MDA, GST, SOD, CAT, TG, TC, LDL-C, HDL-C, apo B, and apo A-I.
Measurement of Blood Glucose
Glucose concentrations were measured with the Ames One Touch glucometer (One-Touch Basic; Lifescan, Johnson and Johnson, New Brunswick, New Jersey) in rat tail vein blood. Blood glucose was estimated using the diagnostic kits (Pars Azmoon kit, IRI) on an automatic analyzer (Abbott, model Alcyon 300, Illinois, USA).
Measurement of Serum Lipid Profile, Apo A-I, and Apo B
The concentrations of TG, TC, LDL-C, and HDL-C in serum were estimated using diagnostic kits (Pars Azmoon kit, IRI) on an automatic analyzer (Abbott, model Alcyon 300). Apo B and apo A-I were also assayed by a turbidimetric immunoassay method using Pars Azmoon kit, IRI.
Measurements of Enzymes
Superoxide dismutase activity assay
Superoxide dismutase activity was assayed according to the method of Sun et al.18 In this method, xanthine–xanthine oxidase system was used to generate a superoxide flux, and nitroblue tetrazolium (NBT) was used as an indicator of superoxide production. Superoxide dismutase activity was then measured by the degree of inhibition of the reaction unit of enzyme, which provides 50% inhibition of NBT reduction. The production of formazan is determined at 560 nm. Results are expressed as U/mL.
Glutathione-S-transferase activity assay
Glutathione-S-transferase activity was spectrophotometrically measured at a wavelength of 340 nm according to the method defined by Habig et al.19 Under standard conditions, the amount of enzyme conjugating 1 µmol of 1-chloro-2, 4-dinitrobenzene (CDNB) with GSH in 1 minute was defined as one unit activity (U/mL).
Catalase activity assay
Catalase activity was made by spectrophotometric measurement of decreasing H2O2 quantity at a wavelength of 240 nm, defined by Beers and Sizer.20 One unit of activity was defined as an enzyme activity (U/mL) degrading 1 µmol of H2O2 in 1 minute under standard conditions.
Measurement of Lipid Peroxidation
Lipid peroxidation products were measured as an index of MDA production in serum by the method of Yoshioka et al.21 In this reaction, MDA reacts with thiobarbituric acid reagent under acidic conditions to generate a pink-colored product and was determined at 532 nm. The results are given as nmol MDA/mL.
Protein Estimation
Protein was estimated in serum by the method of Bradford22 using bovine serum albumin as standard. Protein solution containing 10 to 100 μg protein in a volume up to 0.1 mL was pipetted into 12 mm × 100 mm test tubes. The volume in the test tube was adjusted to 0.1 mL with appropriate buffer. Five milliliters of protein reagent was added to the test tube and the contents mixed either by inversion or by vortexing. The absorbance at 595 nm was measured after 2 minutes and before 1 hour in 3 mL cuvettes against a reagent blank prepared from 0.1 mL of the appropriate buffer and 5 mL of protein reagent. The weight of protein was plotted against the corresponding absorbance resulting in a standard curve, which was used to determine the protein in unknown samples.
Statistical Analysis
All experiments were carried out at least in duplicate. Each group consisted of 8 rats. One-way analysis of variance was performed, and Tukey post hoc test was used for multiple comparisons. Statistical analyses were performed using the InStat 3.0 program. The results are expressed as mean ± standard error of the mean. The results were originated from the analysis of serum. Linear correlation tests were also performed. Differences of P < .05 were considered significant.
Results
Weight loss was observed in the untreated diabetic rats compared to the normal healthy rats (control) during 4 weeks (P < .001). However, after 4 weeks, body weight of CTN-treated diabetic rats significantly increased versus the untreated diabetic rats in a dose-dependent manner (P < .001), but the elevated body weight in the CTN-treated diabetic groups were significantly lower than the control group (P < .001; Table 1).
Table 1.
Effect of CTN on Body Weight in STZ-Treated Diabetic Rats.a
| Day | 0 | 7 | 14 | 21 | 28 |
|---|---|---|---|---|---|
| C | 179.86 ± 7.07 | 219.00 ± 4.85 | 221.40 ± 3.88 | 234.00 ± 5.30 | 252.66 ± 4.59 |
| D | 168.00 ± 5.03 | 162.00 ± 3.63b | 150.33 ± 4.59b | 121.55 ± 3.68b | 102.00 ± 4.96b |
| D + CTN20 | 170.10 ± 4.48 | 172.36 ± 4.79b | 165.12 ± 4.96b | 137.09 ± 5.65b | 143.10 ± 3.91b,c |
| D + CTN40 | 173.50 ± 5.65 | 183.11 ± 4.14b,d | 179.00 ± 3.53b,c | 160.00 ± 3.53b,c,d | 164.00 ± 5.30b,c,e |
| D + CTN60 | 177.02 ± 3.88 | 195.00 ± 3.78c,f,g | 194.72 ± 2.82c,h,i | 181.00 ± 4.59b,c,i,j | 206.09 ± 4.25b,c,i,k |
Abbreviations: CTN, catechin; SEM, standard error of the mean; STZ, streptozotocin.
aControl (C), untreated diabetic rats (D), CTN (20 mg/kg/d)-treated diabetic rats (D + CTN20), CTN (40 mg/kg/d)-treated diabetic rats (D + CTN40), and CTN (80 mg/kg/d)-treated diabetic rats (D + CTN80) during 4 weeks of study. Each measurement was done at least in triplicate, and the values are the means ± SEM for 8 rats in each group.
b P < .001, significantly different from normal control (group C) rats.
c P < .001, significantly different from STZ-treated (group D) rats.
d P < .05, significantly different from STZ-treated (group D) rats.
e P < .05, significant difference between D + CTN20 group versus D + CTN40 and D + CTN80 groups.
f P < .01, significantly different from normal control (group C) rats.
g P < .01, significant difference between D + CTN20 group versus D + CTN40 and D + CTN80 groups.
h P < .05, significantly different from normal control (group C) rats.
i P < .001, significant difference between D + CTN20 group versus D + CTN40 and D + CTN80 groups.
j P < .05, significant difference between D + CTN40 groups versus D + CTN80 group.
k P < .001, significant difference between D + CTN40 groups versus D + CTN80 group.
Streptozotocin-diabetic rats showed considerable (P < .001) hyperglycemia compared to the control rats (Figure 1). After the end of experimental period, the CTN dose dependently decreased blood glucose levels in the diabetic rats versus the untreated diabetic rats (P < .05; Figure 1). Catechin (20 and 40 mg/kg/d) significantly decreased glucose in STZ-diabetic rats only at the fourth week of the study (P < .05, P < .01, respectively), whereas at the highest dose of CTN (80 mg/kg/d), serum glucose of diabetic rats was significantly reduced in the beginning of the first week of treatment (P < .05, P < .001; Figure 1).
Figure 1.
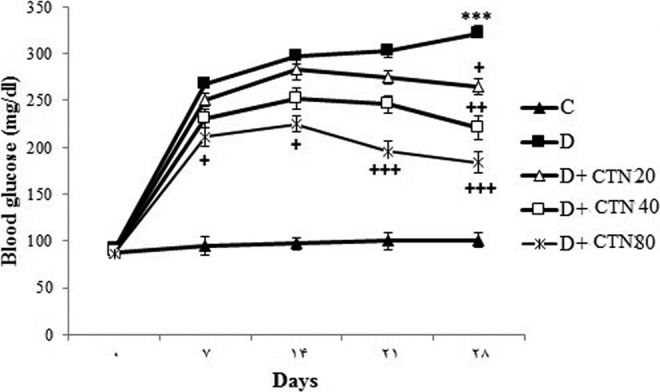
Effect of CTN on blood glucose level (mg/dL). Control (C), untreated diabetic rats (D), CTN (20 mg/kg/d)-treated diabetic rats (D + CTN20), CTN (40 mg/kg/d)-treated diabetic rats (D + CTN40), and CTN (80 mg/kg/d)-treated diabetic rats (D + CTN80) during 4 weeks of study (n = 8, for each group). Values are the means ± SEM for 8 rats in each group. Significantly different from normal control (group C) rats (***P < .001). Significantly different from STZ-treated (group D) rats (+P < .05, ++P < .05, +++P < .001). CTN indicates catechin; SEM, standard error of the mean; STZ, streptozotocin.
Streptozotocin-injected rats exhibited a significant elevation in the serum levels of TC, TG, LDL-C, as well as apo B and significantly decreased in the HDL-C and apo A-I levels versus the control group (P < .01; Table 2). Catechin dose dependently reduced the serum levels of TC, TG, LDL-C, and apo B and increased the serum levels of HDL-C and apo A-I during the experimental period (P < .05). At the highest CTN dose (80 mg/kg/d), there was no significant difference in TC, TG, LDL-C, apo B, HDL-C, and apo A-I levels between the STZ-treated rats and the control rats (Table 2). In addition, at the CTN dose (40 mg/kg/d), there was no significant difference in LDL-C, HDL-C, apo B, and apo A-I levels between the STZ-treated rats and the control rats (Table 2).
Table 2.
Effect of CTN on Serum Lipid Profiles (mg/dL).a
| C | D | D + CTN20 | D + CTN40 | D + CTN60 | |
|---|---|---|---|---|---|
| TC | 45.11 ± 2.47 | 79.86 ± 1.76b | 74.66 ± 3.18b | 57.45 ± 1.06c,d,e | 44.13 ± 2.22d,e,f |
| TG | 36.13 ± 2.47 | 85.10 ± 2.12b | 74.01 ± 3.18b,g | 61.25 ± 2.82b,d,h | 42.15 ± 2.47d,e,i |
| LDL-C | 18.16 ± 1.76 | 39.24 ± 2.83b | 33.17 ± 3.18c | 27.00 ± 2.47g | 22.11 ± 2.82d,h |
| HDL-C | 27.09 ± 2.47 | 12.50 ± 2.12c | 15 ± 2.82j | 18.00 ± 1.76 | 23.34 ± 3.18g |
| Apo A-I | 110.50 ± 7.03 | 69.21 ± 6.01c | 75.11 ± 9.14c,d | 89.13 ± 5.30 | 104.23 ± 6.61h,k |
| Apo B | 67.13 ± 4.50 | 98.79 ± 6.30c | 92.20 ± 7.10j | 82.14 ± 5.90 | 70.87 ± 3.90g |
Abbreviations: apo A-I, apoprotein A-I; apo B, apoprotein B; CTN, catechin; HDL-C, high-density lipoprotein cholesterol; LDL-C, low-density lipoprotein cholesterol; TC, total cholesterol; TG, triglycerides.
aTC, TG, LDL-C, HDL-C, apo A-I, and apo B in control (C), untreated diabetic rats (D), CTN (20 mg/kg/d)-treated diabetic rats (D + CTN20), CTN (40 mg/kg/d)-treated diabetic rats (D + CTN40), and CTN (80 mg/kg/d)-treated diabetic rats (D + CTN80) during 4 weeks of study (n = 8, for each group).
b P < .001, significantly different from normal control (group C) rats.
c P < .01, significantly different from normal control (group C) rats.
d P < .001, significantly different from streptozotocin (STZ)-treated (group D) rats.
e P < .001, significant difference between D + CTN20 group versus D + CTN40 and D + CTN80 groups.
f P < .01, significant difference between D + CTN40 groups versus D + CTN80 group.
g P < .05, significantly different from STZ-treated (group D) rats.
h P < .05, significant difference between D + CTN20 group versus D + CTN40 and D + CTN80 groups.
i P < .001, significant difference between D + CTN40 groups versus D + CTN80 group.
j P < .05, significantly different from normal control (group C) rats.
k P < .05, significantly different from STZ-treated (group D) rats.
Streptozotocin injection produced significant changes in oxidative stress parameters in the serum of diabetic rats 4 weeks after diabetes induction, as shown by increased lipid peroxidation product (MDA) and decreased SOD, GST, and CAT activities versus the control group (P < .001; Table 3). Catechin dose dependently decreased the serum level of MDA and increased SOD, GST and CAT activities versus the untreated diabetic group (P < .05). At the highest CTN concentration (80 mg/kg/d), there was no significant difference in the MDA level, SOD, GST, and CAT activities between the STZ-treated rats and the control rats (Table 3). In addition, at the CTN dose (40 mg/kg/d), there was no significant difference in SOD and CAT activities between the STZ-treated rats and the control rats. The serum protein content did not show significant changes in diabetes and CTN treatment. There was no significant difference in the total protein during 4 weeks after diabetes induction. Catechin treatment also showed no significant modulation in the total protein versus the untreated diabetic group (Table 3).
Table 3.
Effect of CTN on Liver MDA (nmol/mL), SOD (U/mL), CAT (U/mL), GST (U/mL), and Total Protein (mg/mL) in Control (C), Untreated Diabetic Rats (D), CTN (20 mg/kg/d)-Treated Diabetic Rats (D + CTN20), CTN (40 mg/kg/d)-Treated Diabetic Rats (D + CTN40), and CTN (80 mg/kg/d)-Treated Diabetic Rats (D + CTN80) During 4 Weeks of Study (n = 8, for Each Group).
| C | D | D + CTN20 | D + CTN40 | D + CTN60 | |
|---|---|---|---|---|---|
| MDA | 0.55 ± 0.09 | 1.89 ± 0.4a | 1.58 ± 0.2a,b | 1.11 ± 0.15b,c,d | 0.88 ± 0.18b,d,e |
| SOD | 3.10 ± 0.43 | 0.46 ± 0.22a | 0.97 ± 0.35c | 1.56 ± 0.56 | 2.67 ± 0.42f,g |
| CAT | 2.84 ± 0.32 | 1.06 ± 0.14a | 1.40 ± 0.20a | 1.97 ± 0.5h | 2.39 ± 0.31f,g |
| GST | 1.95 ± 0.19 | 0.67 ± 0.08a | 0.91 ± 0.09a | 1.13 ± 0.15i | 1.42 ± 0.21f |
| Total protein | 16.43 ± 3.12 | 7.15 ± 2.41 | 8.01 ± 2.03 | 10.04 ± 1.97 | 12.85 ± 2.50 |
Abbreviations: CAT, catalase; CTN, catechin; GST, glutathione-S-transferase; MDA, malondialdehyde; SOD, superoxide dismutase; STZ, streptozotocin.
a P < .001, significantly different from normal control (group C) rats.
b P < .001, significantly different from STZ-treated (group D) rats.
c P < .01, significantly different from normal control (group C) rats.
d P < .001, significant difference between D + CTN20 group versus D + CTN40 and D + CTN80 group.
e P < .05, significant difference between D + CTN40 groups versus D + CTN80 group.
f P < .05, significantly different from STZ-treated (group D) rats.
g P < .05, significant difference between D + CTN20 group versus D + CTN40 and D + CTN80 group.
h P < .05, significantly different from STZ-treated (group D) rats.
i P < .05, significantly different from normal control (group C) rats.
Discussion
The findings of this investigation show that the IP injection of CTN significantly recovered the adverse metabolic effects in the serum of animals treated with STZ in a dose-dependent manner. Catechin injection after STZ treatment caused lower serum glucose level and ameliorated lipid profile as well as body weight versus the rats treated with STZ alone. Moreover, CTN treatment of diabetic rats ameliorated decreased activities of the SOD, CAT, GST, and also HDL-C and apo A-I levels as well as increase in the lipid profiles, apo B, and MDA. The present results confirm the previous findings reported by other investigators using CTN, which improved STZ damage in rats.16,17,23,24 The current study also indicates the amelioration of oxidative stress in the STZ-diabetic rats after CTN treatment. The results are similar to the previous studies indicated by other researchers using STZ to cause diabetes in rats, accompanied by an increase in the susceptibility to lipid peroxidation.25,26 Oxidative stress has an important effect on the progression of diabetes and its complications. Hyperglycemia caused overgeneration of oxygen-free radicals, which lead to the development of diabetes and its complications.26 According to the present literatures, STZ causes imbalance between plasma oxidant and antioxidant content and accelerates the progression of DM and its complications. Streptozotocin reduces insulin secretion after entering to the pancreatic β-cell through the low-affinity glucose protein-2 transporter and making the selective damage of the insulin-producing islet β cells. Thus, development of diabetes after the damage of the pancreatic islets is related to the locally and systemically induction of oxidative stress. In addition, insulin resistance inhibits adipocyte function and the release of free acid into the plasma.27 Increase in circulating free fatty acids enhances hepatic TGs production. The raised hepatic TG content leads to an elevation in the production of more atherogenic small, dense LDL. These are the important mechanisms involved in STZ-induced diabetes and its complications.28 In this study, it was observed that STZ injection caused a considerable reduction in plasma SOD, GST, and CAT activities as well as HDL-C and apo A-I with a significant elevation in MDA, apo B, and lipid profile in rats. The improvement of STZ effects in rats after CTN injection might indicate a protective effect of CTN against STZ function due to prevention of oxygen-free radicals production. Catechin injection to the diabetic rats improved SOD, GST, and CAT activities and may be related to a decrease in free radicals generation by CTN and also increase in antioxidant content. In the present investigation, SOD, GST, and CAT activities were increased in CTN-treated diabetic rats versus to the untreated diabetic rats. However, our data showed that CTN-treated diabetic group decreased the MDA level compared to the untreated diabetic group. Catechin may also reduce lipid peroxidation by enhancing the SOD, GST, and CAT activities.29
The present data completely confirm to those of Mehra et al30 who demonstrated hypoglycemic and antioxidant activity of CTN in rats. Their data illustrated that CTN treatment to rats treated with high sucrose may be effective by decreasing blood glucose, via decreasing oxidative stress in diabetes. Chennasamudram et al24 have postulated that CTN may be effective to regulate glycaemia and kidney damage in the STZ-induced diabetic rat by reducing lipid peroxidation.
Epidemiological studies indicated that persons who drink more than 2 cups of green tea per day have lower concentration of TC and LDL-C, which is also demonstrated by the results of meta-analysis of randomized clinical trials.30 Moreover, this was reported that CTN treatment prevented DM-induced vascular endothelial dysfunction through reduction in high glucose, vascular oxidative stress, and lipid peroxidation.31
Similar to previous investigations, our study demonstrated that CTN is also useful to reduce the cardiovascular risk in diabetic models via keeping TC, TG, LDL-C, HDL-C, apo B, and apo A-I at safe levels. The major mechanism for the hypolipidemic effect of flavonoids may be related to its inhibitory effects on the oxygen-free radical generation. Diabetes mellitus often caused lipid abnormalities that these abnormalities may be deteriorated by the formation of oxidizing agents such as oxidized LDLs.32
Apoprotein A-I as the important apoprotein of HDL-C structure is the serum level indicative of HDL-C. Several investigations observed a potent proportion between the increase in plasma HDL-C and apo A-I and the modification in plasma apo A-I concentration demonstrating almost half (approximately 48%) of the variation in HDL-C concentration during the intermediacy period. As well as, apo B as the major apoprotein of LDL-C structure is the serum level indicative of LDL-C, and reduction in apo B demonstrates that small, dense LDL-C was significantly less than control group. However, apo B and apo A-I can be better than LDL-C and HDL-C, respectively, in prognosis cardiovascular risk in type 2 diabetes.33
In our investigation, pro-oxidant–antioxidant balance was assessed by measuring MDA content and enzymatic antioxidants in the serum of the diabetic rats. Elevated MDA and reduced SOD, GST, and CAT activities remarked that the balance changed toward pro-oxidation in STZ-diabetic rats. Catechin treatment of diabetic rats recovered SOD, GST, and CAT activities, which is related to a reduction in free radical generation and elevated antioxidant defenses by CTN. Antioxidant activity of green tea has been demonstrated in several studies.34-36 Green tea is a major source of components having physiological effects, such as polyphenols, certain minerals, and caffeine.37 Flavonoids are belonging to a group of phenolic compounds with its hydrogen-donating antioxidant activity and a scavenger of free radicals. Catechin exhibits its antioxidant effect through hydrogen-donating antioxidant activity and a scavenger of free radicals in vivo and in vitro.38
Catechin adjusts oxygen radical generation, which may be responsible at least in part for the improved hyperglycemia, hyperlipidemia, and oxidative stress in STZ-diabetic rats. In addition, increased SOD, GST, and CAT activities after CTN injection may exert an additional effect in modulating oxidative stress. The present study demonstrated that the antihyperglycemia and hypolipidemic of CTN are related to increased antioxidant enzymes (SOD, GST, and CAT) and lipid peroxidation levels in the serum of STZ-diabetic rat model. In conclusion, the present data indicate that CTN treatment exhibits a protective effect in the STZ model of diabetes and its complications via controlling of oxidative stress. Although more studies are needed for the assessing of the exact protective mechanism of CTN against diabetic complications in animal models and humans, present data show that CTN exerts antidiabetic effects in the diabetic model via enhancing the antioxidant defense system. This study confirms the potential efficacy of CTN for diabetes management.
Acknowledgments
The authors would like to thank Research Affairs of Neyshabur University of Medical Sciences for financially supporting this work.
Footnotes
Declaration of Conflicting Interests: The author(s) declared no potential conflicts of interest with respect to the research, authorship, and/or publication of this article.
Funding: The author(s) received no financial support for the research, authorship, and/or publication of this article.
References
- 1. Chaiyasut C, Kusirisin W, Lailerd N, Lerttrakarnnon P, Suttajit M, Srichairatanakool S. Effects of phenolic compounds of fermented Thai indigenous plants on oxidative stress in streptozotocin-induced diabetic rats. Evid Based Complement Alternat Med. 2011;2011:749307. [DOI] [PMC free article] [PubMed] [Google Scholar]
- 2. Samarghandian S, Azimi-Nezhad M, Farkhondeh T. Crocin attenuate tumor necrosis factor-alpha (TNF-α) and interleukin-6 (IL-6) in streptozotocin-induced diabetic rat aorta. Cytokine. 2016;88:20–28. [DOI] [PubMed] [Google Scholar]
- 3. Strain JJ. Disturbances of micronutrient and antioxidant status in diabetes. Proc Nutr Soc. 1991;50(3):591–604. [DOI] [PubMed] [Google Scholar]
- 4. Shanmugam KR, Ramakrishana CH, Mallikarjuna K, Reddy KS. The impact of ginger on kidney carbohydrate metabolic profiles in STZ induced diabetic rats. Asian J Exp Sci. 2009;23(1):127–134. [Google Scholar]
- 5. Al-Azhary DB. Ginger enhances antioxidant activity and attenuates atherogenesis in diabetic cholesterol-fed rats. Aust J Basic Appl Sci. 2011;5(12):2150–2158. [Google Scholar]
- 6. Samarghandian S, Hadjzadeh MA, Amin Nya F, Davoodi S. Antihyperglycemic and antihyperlipidemic effects of guar gum on streptozotocin-induced diabetes in male rats. Pharmacogn Mag. 2012;8(29):65–72. [DOI] [PMC free article] [PubMed] [Google Scholar]
- 7. Samarghandian S, Borji A, Delkhosh MB, Samini F. Safranal treatment improves hyperglycemia, hyperlipidemia and oxidative stress in streptozotocin-induced diabetic rats. J Pharm Pharm Sci. 2013;16(2):352–362. [DOI] [PubMed] [Google Scholar]
- 8. Samarghandian S, Borji A, Tabasi SH. Effects of Cichorium intybus linn on blood glucose, lipid constituents and selected oxidative stress parameters in streptozotocin-induced diabetic rats. Cardiovasc Hematol Disord Drug Targets. 2013;13(3):231–236. [DOI] [PubMed] [Google Scholar]
- 9. Samarghandian S, Azimi-Nezhad M, Samini F. Ameliorative effect of saffron aqueous extract on hyperglycemia, hyperlipidemia, and oxidative stress on diabetic encephalopathy in streptozotocin induced experimental diabetes mellitus. Biomed Res Int. 2014;2014:920857. [DOI] [PMC free article] [PubMed] [Google Scholar]
- 10. Anderson RA, Polansky MM. Tea enhances insulin activity. J Agric Food Chem. 2002;50(24):7182–7186. [DOI] [PubMed] [Google Scholar]
- 11. Collins QF, Liu HY, Pi J, Liu Z, Quon MJ, Cao W. Epigallocatechin-3-gallate (EGCG), a green tea polyphenol, suppresses hepatic gluconeogenesis through 5′-AMP-activated protein kinase. J Biol Chem. 2007;282(41):30143–30149. [DOI] [PMC free article] [PubMed] [Google Scholar]
- 12. Park JB. Flavonoids are potential inhibitors of glucose uptake in U937 cells. Biochem Biophys Res Commun. 1999;260(2):568–574. [DOI] [PubMed] [Google Scholar]
- 13. Vera JC, Reyes AM, Velasquez FV, et al. Direct inhibition of the hexose transporter GLUT1 by tyrosine kinase inhibitors. Biochemistry. 2001;40(3):777–790. [DOI] [PubMed] [Google Scholar]
- 14. Spence JP, Abd-el-Mohsen MM, Rice-Evans C. Cellular uptake and metabolism of flavonoids and their metabolites: implications for their bioactivity. Arch Biochem Biophys. 2004;423(1):148–161. [DOI] [PubMed] [Google Scholar]
- 15. Lin YS, Tsai YJ, Tsay JS, Lin JK. Factors affecting the levels of tea polyphenols and caffeine in tea leaves. J Agric Food Chem. 2003;51(7):1864–1873. [DOI] [PubMed] [Google Scholar]
- 16. Zhu D, Wang L, Zhou Q, et al. (+)-Catechin ameliorates diabetic nephropathy by trapping methylglyoxal in type 2 diabetic mice. Mol Nutr Food Res. 2014;58(12):2249–2260. [DOI] [PubMed] [Google Scholar]
- 17. Ertürküner SP, Başar M, Tunçdemir M, Seçkin İ. The comparative effects of perindopril and catechin on mesangial matrix and podocytes in the streptozotocin induced diabetic rats. Pharmacol Rep. 2014;66(2):279–287. [DOI] [PubMed] [Google Scholar]
- 18. Sun Y, Oberley LW, Li Y. A simple method for clinical assay of superoxide dismutase. Clin Chem. 1988;34(3):497–500. [PubMed] [Google Scholar]
- 19. Habig WH, Pabst MJ, Jacob WB. Glutathione S-transferase. The first enzymatic step in mercapturic acid formation. J Biol Chem. 1974;249(22):7130–7139. [PubMed] [Google Scholar]
- 20. Beers RF, Jr, Sizer IW. A spectrophotometric method for measuring the breakdown of hydrogen peroxide by catalase. J Biol Chem. 1952;195(1):133–140. [PubMed] [Google Scholar]
- 21. Yoshioka T, Kawada K, Shimada T, Mori M. Lipid peroxidation in maternal and cord blood and protective mechanisms against activated oxygen toxicity in the blood. Am J Obstet Gynecol. 1979;135(3):372–376. [DOI] [PubMed] [Google Scholar]
- 22. Bradford MM. A rapid and sensitive method for the quantitation of microgram quantities of protein utilizing the 500 principle of protein dye binding. Anal Biochem. 1976;72:248–254. [DOI] [PubMed] [Google Scholar]
- 23. Bhardwaj P, Khanna D, Balakumar P. Catechin averts experimental diabetes mellitus-induced vascular endothelial structural and functional abnormalities. Cardiovasc Toxicol. 2014;14(1):41–51. [DOI] [PubMed] [Google Scholar]
- 24. Chennasamudram SP, Kudugunti S, Boreddy PR, Moridani MY, Vasylyeva TL. Renoprotective effects of (+)-catechin in streptozotocin-induced diabetic rat model. Nutr Res. 2012;32(5):347–356. [DOI] [PubMed] [Google Scholar]
- 25. Budin S, Othman F, Louis SR, Bakar MA, Das S, Mohamed J. The effects of palm oil to cotrienolrich fraction supplementation on biochemical parameters, oxidative stress and the vascular wall of streptozotocin-induced diabetic rats. Clinics. 2009;64(3):235–244. [DOI] [PMC free article] [PubMed] [Google Scholar]
- 26. Yazdanparast R, Ardestani A, Jamshidi S. Experimental diabetes treated with Achillea santolina: effect on pancreatic oxidative parameters. J Ethnopharmacol. 2007;112(1):13–18. [DOI] [PubMed] [Google Scholar]
- 27. Chatzigeorgiou A, Halapas A, Kalafatakis K, Kamper E. The use of animal models in the study of diabetes mellitus. In Vivo. 2009;23(2):245–258. [PubMed] [Google Scholar]
- 28. Shahady E. Hyperlipidemia in diabetes-etiology, consequences and treatment. Adapted from Libby P. Circulation. 1995;91(11):2844–2850. [DOI] [PubMed] [Google Scholar]
- 29. Hariri AT, Moallem SA, Mahmoudi M, Memar B, Hosseinzadeh H. Sub-acute effects of diazinon on biochemical indices and specific biomarkers in rats: protective effects of crocin and safranal. Food Chem Toxicol. 2010;48(10):2803–2808. [DOI] [PubMed] [Google Scholar]
- 30. Mehra P, Garg M, Koul A, Bansal DD. Effect of (+)-catechin hydrate on oxidative stress induced by high sucrose and high fat diet in male Wistar rats. Indian J Exp Biol. 2013;51(10):823–827. [PubMed] [Google Scholar]
- 31. Zheng XX, Xu YL, Li SH, Liu XX, Hui R, Huang XH. Green tea intake lowers fasting serum total and LDL cholesterol in adults: a meta-analysis of 14 randomized controlled trials. Am J Clin Nutr. 2011;94(2):601–610. [DOI] [PubMed] [Google Scholar]
- 32. Xiang M, Yang M, Zhou C, Liu J, Li W, Qian Z. Crocetin prevents AGEs-induced vascular endothelial cell apoptosis. Pharmacol Res. 2006;54(4):268–274. [DOI] [PubMed] [Google Scholar]
- 33. Shidfar F, Heydari I, Hajimiresmaiel SJ, Hosseini Sh, Shidfar Sh, Amiri F. The effects of cranberry juice on serum glucose, apoB, apoA-I, Lp (a), and paraoxonase-1 activity in type 2 diabetic male patients. J Res Med Sci. 2012;17(4):355–360. [PMC free article] [PubMed] [Google Scholar]
- 34. Deng Y, Xu Z, Xu B, Liu W, Feng S, Yang T. Antioxidative effects of schidandrin B and green tea polyphenols against mercuric chloride-induced hepatotoxicity in rats. J Environ Pathol Toxicol Oncol. 2014;33(4):349–361. [DOI] [PubMed] [Google Scholar]
- 35. Wang D, Wang Y, Wan X, Yang CS, Zhang J. Green tea polyphenol (−)-epigallocatechin-3-gallate triggered hepatotoxicity in mice: responses of major antioxidant enzymes and the Nrf2 rescue pathway. Toxicol Appl Pharmacol. 2015;283(1):65–74. [DOI] [PubMed] [Google Scholar]
- 36. Narotzki B, Reznick AZ, Mitki T, Aizenbud D, Levy Y. Green tea drinking improves erythrocytes and saliva oxidative status in the elderly. Adv Exp Med Biol. 2015;832:25–33. [DOI] [PubMed] [Google Scholar]
- 37. Hernández Figueroa TT, Rodríguez-Rodríguez E, Sánchez-Muniz FJ. The green tea, a good choice for cardiovascular disease prevention? [in Spanish]. Arch Latinoam Nutr. 2004;54(4):380–394. [PubMed] [Google Scholar]
- 38. Knekt P, Kumpulainen J, Jarvinen R, et al. Flavonoid intake and risk of chronic diseases. Am J Clin Nutr. 2002;76(3):560–568. [DOI] [PubMed] [Google Scholar]