
Figure 4. The NTR contacts Lobe 2 of the ATPase domain.
(A) Surface representation of the Chd1 crystal structure (PDB code 3MWY) (Hauk et al., 2010). ATPase Lobe 1 and 2 are colored dark and light grey, respectively, and the N-terminal chromo domains cyan. (B) Homology model of the ISWI ATPase domain (Forné et al., 2012). Cyan: hypothetical binding interface of the ISWI NTR (see main text), red: position of Bpa substitution (H483). (C–E) Mass spectrometric validation of the crosslink XL1 (Table 1) formed between Bpa at position 483 and an NTR peptide. (C) Isotopic distribution of the crosslinked peptide. (D) UV-dependent increase of the signal for the crosslinked peptide. Extracted ion chromatograms of the ions were used for the quantification. (E) High resolution, high accuracy MS2 fragmentation spectrum. Top right: summary of observed product ions mapped onto the sequence of the crosslinked peptide. B: Bpa. (F) Predicted docking interface of AcidicN (blue and dark blue), AutoN (cyan and dark blue) and overlapping regions (dark blue) in the structural model of ISWI. The predicted interface for AcidicN overlaps with the interface for the acidic helix of the N-terminal chromo domains of Chd1 (orange) (Hauk et al., 2010).

Figure 4—figure supplement 1. The effect of the H483B mutation on chromatin remodeling.
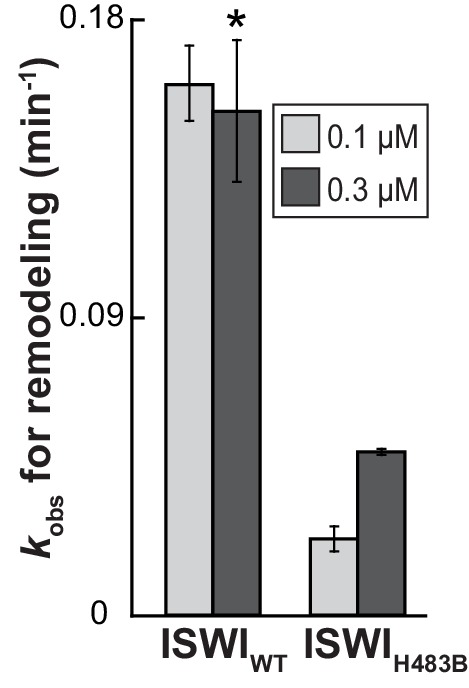
Figure 4—figure supplement 2. Validation of additional crosslinks detected in the ISWIH483B dataset.

Figure 4—figure supplement 3. Structural predictions of NTR elements.
