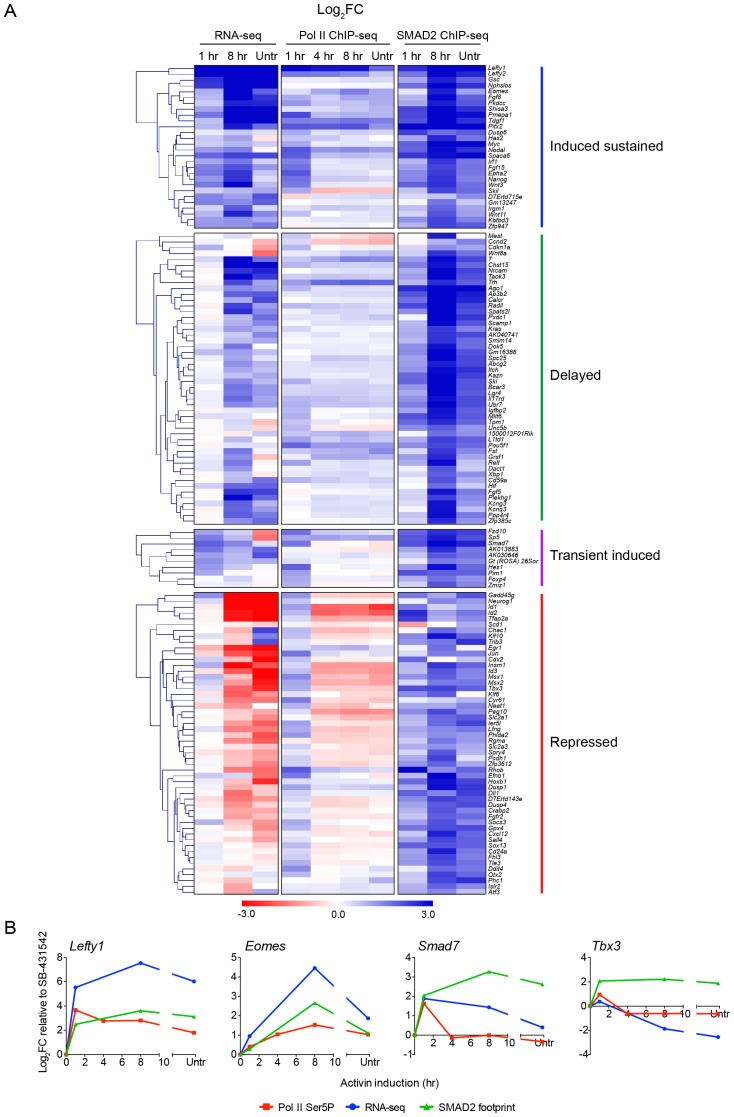
Figure 4. Localized SMAD2 chromatin binding does not directly correlate with transcription.
(A) Hierarchically-clustered heatmaps for each of the four different kinetic groups of target genes showing log2FC values relative to SB-431542 for gene expression as determined by RNA-seq (left), mean normalized read depth for Pol II Ser5P (middle) and SMAD2 footprint (right). Untr, untreated. (B) Transcriptional dynamics of different target genes (Lefty1, Eomes, Smad7, Tbx3). (For IGV browser displays, see Figure 2A and Figure 4—figure supplement 1). Plotted are quantifications of transcript levels obtained by RNA-seq, Pol II Ser5P occupancy expressed as mean normalized read depth, and SMAD2 footprint, all depicted as log2FC relative to SB-431542. Untr, untreated.


