

In resting and activated B-cells, IgM and IgG B-cell receptors (BCRs) reside in highly heterogeneous protein islands that vary in size and number of BCRs but intrinsically maintain a high frequency of BCR monomers. IgG BCRs are more clustered than IgM BCRs on resting cells and form larger protein islands after antigen activation.
Abstract
B-cell activation is initiated by the binding of antigen to the B-cell receptor (BCR). Here we used dSTORM superresolution imaging to characterize the nanoscale spatial organization of immunoglobulin M (IgM) and IgG BCRs on the surfaces of resting and antigen-activated human peripheral blood B-cells. We provide insights into both the fundamental process of antigen-driven BCR clustering and differences in the spatial organization of IgM and IgG BCRs that may contribute to the characteristic differences in the responses of naive and memory B-cells to antigen. We provide evidence that although both IgM and IgG BCRs reside in highly heterogeneous protein islands that vary in size and number of BCR single-molecule localizations, both resting and activated B-cells intrinsically maintain a high frequency of single isolated BCR localizations, which likely represent BCR monomers. IgG BCRs are more clustered than IgM BCRs on resting cells and form larger protein islands after antigen activation. Small, dense BCR clusters likely formed via protein–protein interactions are present on the surface of resting cells, and antigen activation induces these to come together to form less dense, larger islands, a process likely governed, at least in part, by protein–lipid interactions.
INTRODUCTION
B-cell antibody responses are initiated by the binding of antigen to surface-expressed B-cell receptors (BCRs), which induces intracellular signals that are critical for translating extracellular environmental cues into cellular behavior and activation (Packard and Cambier, 2013). Although antigen-induced BCR signaling is a fundamental process in B-cell biology, our understanding of the mechanisms by which antigens trigger signaling is incomplete. Critical to understanding the mechanisms underlying the initiation of BCR signaling is knowledge of the spatial organization of BCRs on the surfaces of both resting and antigen-activated B-cells at the nanoscale level of individual BCRs.
A variety of studies have provided evidence at the resolution of diffraction-limited light microscopy that is consistent with the existence of BCRs as predominantly monomers or small oligomers that are relatively evenly dispersed over the cell surface in resting cells (Harwood and Batista, 2010; Pierce and Liu, 2010). The diffusion behavior of BCRs on resting cells is also consistent with the majority of BCRs existing in a monomeric state (Tolar et al., 2009), and intermolecular interactions between BCRs, as would be predicted of BCR multimers, were not detected by Förster resonance energy transfer (FRET) in resting B-cells (Tolar et al., 2005). On antigen binding, BCRs form signaling-active microclusters that ultimately condense into well-ordered immune synapses (Batista et al., 2001; Fleire et al., 2006). However, evidence that BCRs exist as oligomers in resting cells was provided by biochemical methods showing that BCRs isolated from detergent-solubilized B-cells were in large aggregates (Schamel and Reth, 2000). In addition, results of quantitative bifluorescence complementation assays were also consistent with BCRs existing as oligomers on resting B-cell surfaces (Yang and Reth, 2010). These different results have distinct implications for the mechanisms by which BCR signaling is initiated. Indeed, two current models for the triggering of BCR signaling are predicated on either BCRs existing as monomers on the cell surface that are clustered by antigen (Pierce and Liu, 2010; Treanor and Batista, 2010) or BCRs existing as clusters on the resting B-cell surface that are disrupted by antigen (Yang and Reth, 2010). An explanation for the differences in results that support these models is lacking.
The application of point localization–based superresolution fluorescence microscopy techniques (Betzig et al., 2006; Hess et al., 2006; Rust et al., 2006; Folling et al., 2008) is a promising approach to gain an understanding of the nanoscale spatial organization of BCRs in the plasma membrane on the level of individual BCRs. One widely used method, direct stochastic optical reconstruction microscopy (dSTORM), is a subdiffraction resolution fluorescence imaging technique that uses single-marker switching to resolve nanoscale structures (Heilemann et al., 2008). This method produces superresolution images with a ∼20-nm localization precision by mathematically localizing individual fluorescent molecules stochastically activated over time. However, there are technical limitations in precisely characterizing the nanoscale organization of receptors on cell surfaces from data collected from any superresolution fluorescence imaging due to several factors. Key among these are imprecise localization and blinking of the fluorophores, which can lead to difficulties in drawing conclusions about the number and density of receptors on the cell surface, and limitations in statistical approaches used to characterize the data sets (Sengupta et al., 2011). Here we imaged BCRs expressed by human peripheral blood B-cells using dSTORM (Heilemann et al., 2008) and applied a novel combination of computational tools to overcome or at least minimize these limitations to allow for precise characterization of the spatial organization of cell surface BCRs.
We used these tools to investigate an important feature of B-cell biology, namely, the nanoscale organization of immunoglobulin M (IgM) and IgG BCRs expressed by naive and memory human peripheral blood B-cells. Immune individuals acquire antibody memory characterized by rapid, high-affinity recall responses to antigen that are dominated by antibodies of the IgG isotype. Antibody memory is encoded, in part, in long-lived memory B-cells that are the differentiated product of germinal center (GC) reactions in which naive B-cells undergo somatic hypermutation and antigen selection (Kurosaki et al., 2015). Naive B-cells that give rise to primary antibody responses upon the first encounter with antigen express IgM and IgD BCRs. In contrast, although there is considerable diversity among memory B-cells (Tarlinton and Good-Jacobson, 2013), many memory B-cells in human peripheral blood express IgG BCRs. BCRs are composed of a membrane-bound form of the immunoglobulin (mIg), which associates in a 1:1 molar ratio with a heterodimer of Igα and Igβ, which contain in their cytoplasmic domains key motifs that are essential to initiate signaling (Reth, 1992). The signaling capacities and the outcome of signaling through IgM versus IgG BCRs are not identical, and it has been proposed that differences in signaling through IgM versus IgG BCRs might account for the accelerated, high-titered antibody responses characteristic of B-cell memory (Wakabayashi et al., 2002; Horikawa et al., 2007; Waisman et al., 2007). Because all BCRs share identical Igα and Igβ heterodimers (Venkitaraman et al., 1991), it is assumed that functional differences between the IgG and IgM BCRs are encoded, at least in part, by the mIgG and mIgM themselves or dictated by the differentiated state of the B-cell in which the BCRs are expressed. For example, several studies provided evidence that the cytoplasmic domain of the IgG BCR was essential for enhanced BCR clustering, immune synapse formation, and downstream signaling of IgG-expressing B-cells as compared with IgM-expressing B-cells (Engels et al., 2009, 2014; Liu et al., 2010a, b, 2012). A second, unexplored contribution to the signaling capacities of IgM and IgG BCRs is the spatial organization of these receptors on B-cell surfaces. It is possible that B-cell– or BCR-intrinsic differences in the spatial organizations of IgG versus IgM BCRs on cell surfaces contribute to the accelerated and elevated antibody responses of memory B-cells compared with naive B-cells.
The present results of our analysis of the nanoscale spatial organization of BCRs on B-cell surfaces provide insights into both the fundamental process of antigen-driven BCR clustering and differences in the spatial organization of IgM and IgG BCRs that may contribute to the characteristic differences in the responses of naive and memory B-cells to antigen.
RESULTS
dSTORM images of resting and activated IgM- and IgG-expressing human B-cells
The B-cells from two healthy donors were purified from peripheral blood by negative selection and labeled with F(ab) of antibodies specific for human IgM or IgG conjugated to Alexa Fluor 647 (Alexa Fluor 647–Fab anti-IgM or -IgG) at saturating concentrations (300 nM). To rule out the possibility that the detecting reagents themselves activated B-cells, we measured an early event in BCR-mediated B-cell activation, namely Ca2+ influx, in unlabeled B-cells and in B-cells labeled with either Alexa Fluor 647–Fab anti-IgM or –Fab anti-IgG. Neither monovalent Fab reagent induced Ca2+ influxes in B-cells, in contrast to F(ab′)2 anti-Ig, which activated the B-cells (Supplemental Figure S1). Labeled B-cells were placed in chambers on supported fluid planar lipid bilayers (PLBs) that contained streptavidin-biotin–tethered F(ab′)2 of κ light chain–specific antibodies (anti-κ) to mimic antigen presented to the B-cells on a cell surface. Although the result of engaging the BCRs by anti-κ may not be identical to that of engaging the BCRs by antigens that bind within the antigen-combining site of the BCR, anti-Igs have proven to be a useful surrogate for antigen, particularly in studies of human B-cells, in which the frequency of B-cells specific for any given antigen is so small as to preclude studies of antigen-specific cells. Thus we refer to anti-κ as the antigen in these studies. For imaging of resting B-cells, cells were placed on PLBs that did not contain anti-κ. After 10 min of incubation at 37°C on the bilayers, the cells were fixed, and dSTORM images were acquired. To do so, the entire population of fluorophores was brought to a nonfluorescent, reversible dark (“off”) state by irradiation, and then only a sparse subset of fluorophores was reactivated and imaged at a time. Repetitive photoactivation and localization of single fluorescent dye molecules in an image sequence of 20,000 frames containing only a sparsely distributed subset of labeled BCRs in each frame were performed to reconstruct a superresolved image. In each image frame of a stack, the positions of spatially well separated, activated fluorophores were precisely determined by fitting a point spread function (PSF) to the measured photon distributions to localize individual BCR peaks. Subsequently all of the fitted localizations of BCRs in all frames were summed into a superresolution image. Approximately 20–30 B-cells were analyzed for each condition, acquiring 20,000 frames per B-cell. We show both the composite total internal reflection fluorescence (TIRF) images and dSTORM images of representative resting and activated IgM- and IgG-expressing B-cells (Figure 1A). Several features of the images are of interest. Although both the size of the contact area with the PLB (Figure 1B) and the number of BCR single molecule (SM) localizations in the contact area (Figure 1C) were similar for resting IgM- and IgG-BCR–expressing B-cells, IgG BCRs appear to be more clustered than IgM BCRs in both TIRF and dSTORM images (Figure 1A). After 10 min of antigen activation, the contact area of IgM B-cells with the PLB expanded significantly (Figure 1B), and the number of BCR SM-localizations in the contact area increased nearly 10-fold (Figure 1C). The area of contact with the PLB also increased for IgG-BCR–expressing B-cells 10 min after antigen activation but slightly less so than for IgM B-cells (Figure 1B), and the number of receptor localizations in the contact area also showed a large, sixfold increase (Figure 1C). By live-cell TIRF imaging, the smaller contact areas of antigen-activated IgG B-cells compared with IgM B-cells appeared to be due to more active contraction after maximal spreading after 100 s of image acquisition (Figure 1, D and E). However, it is not possible to directly compare the time frame in these live-cell images with each other or with the 10-min time frame of the fixed cell images because the exact times the B-cells contacted the PLB cannot be determined precisely. Somewhat unexpectedly, we also observed polarization of the BCRs in ∼50% of antigen-activated IgM B-cells (Figure 1F) and 60% of IgG B-cells (Figure 1G). Comparing the size of the contact areas in polarized and unpolarized cells, it appeared that for IgG-expressing B-cells, polarized cells had significantly larger contact areas (Figure 1H), indicating that polarization may precede contraction. A similar trend was observed for IgM-expressing cells. To our knowledge, polarization of BCRs engaging antigen on a surface is a novel observation. It may be that polarization is a unique feature of human peripheral blood B-cells and could possibly reflect a requirement for peripheral blood B-cells to move toward antigen or some other factor once B-cells enter lymphoid tissues and BCR signaling is initiated.
FIGURE 1:

dSTORM imaging of resting and anti-κ activated IgM- and IgG-expressing human B-cells. Human peripheral blood B-cells were labeled with Alexa Fluor 647–Fab anti-IgM or -IgG. Labeled cells were placed on PLB with (+ anti-κ) or without (resting) streptavidin-biotin tethered anti-κ. (A) Representative pseudo-TIRFM images of unprocessed maximum projection of all acquired frames (left) and corresponding dSTORM images (middle), along with magnified regions in dashed white boxes (right). Scale bar, 1 μm. (B, C) Quantification of the contact area (B) and total number of receptor localizations in the contact area (C) of IgM- and IgG-expressing B-cells under each condition. Black line, mean. (D, E) Selected time-stamp images of live-cell TIRF imaging of (D) IgM-expressing cells and (E) IgG-expressing cells on PLB with anti-κ appearing after 440 s for IgM- and 220 s for IgG-expressing cells after acquisition start. Scale bar, 5 μm. (F, G) Representative images of IgM- (F) and IgG- (G) expressing polarized and unpolarized B-cells (left). White line depicts the boundary of the cell. Graph (middle) of intensity line profile (dashed line) through each cell and quantification of polarized and unpolarized population of IgM- and IgG-expressing cells (right). (H) Quantification of the contact area of polarized and unpolarized cells on activating bilayers. Red line, mean. Data were compared by two-tailed Mann–Whitney U test. ****p < 0.0001, **p < 0.01, *p < 0.05.
Strategy for analysis of dSTORM images to determine the nanoscale organization of individual BCRs on the surfaces of B-cells
Having obtained superresolution images of BCRs on the surface of IgM- and IgG-expressing human B-cells, we wanted to analyze the images to obtain information on the spatial organization of individual BCRs. Single-BCR information can be extracted from these images, but doing so requires rigorous quantitative and spatial analysis that distinguishes single labeled BCRs that fluoresce over multiple contiguous frames from actual BCR clusters. Single labeled BCRs that fluoresce across multiple contiguous frames before being irreversibly photobleached appear as clusters of BCRs in the summed frames of the reconstructed image, as depicted in Figure 2A, because the localized position of the BCR in each frame varies slightly due to differences in the number of photons emitted in each frame and the uncertainty in position determination (Sengupta et al., 2011). To correct for this, we developed an analysis algorithm that used the spatial distribution and temporal signature of multiple peaks arising from a single molecule to calculate the contribution of such clusters to observed protein spatial organization (see Materials and Methods). This analysis showed that ∼60% of the localized peaks arose from spreading of fluorescence from single molecules across contiguous frames. Clusters of peaks arising from such spread of single-molecule fluorescence across continuous frames were grouped and collapsed into a single peak in the data set. All further analyses were performed with SM localizations derived from this grouping procedure.
FIGURE 2:

Strategy for identifying protein islands. (A, B) Human peripheral blood B-cells were labeled with Alexa Fluor 647–Fab anti-IgM or -IgG at a low concentration (10 nM) to ensure spatially and temporally well separated detection of single BCRs within the imaging area (2.4 μm × 2.4 μm) and dSTORM images were acquired. (A) Example of a single fluorophore detected in consecutive frames when the fluorescence emission from a single fluorophore is interrupted by the acquisition time. Frames in the sequence with no signal represent times when the molecule is in the dark state. (B) A second example, showing a single fluorophore detected in multiple frames by irregular intervals. Multiple appearances of a single fluorophore in both cases result in clusters of peaks originating from a single molecule. (C) Frequency of appearances of Alexa Fluor 647–Fab anti-IgM and -IgG under the foregoing conditions. (D) Representative diagram showing spatially isolated assemblies of proteins containing single and multiple receptors defined by the Hoshen–Kopelman algorithm–based cluster analysis detailed in Materials and Methods. Red arrowed line denotes 60-nm radius. (E) Radius (left) and density (right) of spatially isolated assemblies of appearances (protein island) plotted as a function of protein islands containing 3–10 appearances. Protein islands containing two appearances are excluded from these graphs because two appearances cannot define an area.
Interpretation of images is also complicated by the fact that many fluorophores transition to reversible “off” states at unpredictable times with irregular intervals during data acquisition, as depicted in Figure 2B. This phenomenon is termed blinking and results in a single labeled BCR appearing as a cluster of localized peaks in the composite superresolution image, even after the multiple appearances due to single labeled BCRs fluorescing across successive frames have been corrected by a grouping procedure. This blinking property of fluorescent dyes is not completely intrinsic to the dye but is also highly dependent on its nanoenvironment and thus can only be determined experimentally (Sauer, 2013). The effect of the environment on the blinking behaviors of the fluorophores may be particularly complex because images are acquired at the interface of the B-cell surface and the PLB. To determine the contribution of multiple blinking to the BCR images, B-cells were sparsely labeled with either Alexa Fluor 647–Fab anti-IgG or Alexa Fluor 647–Fab anti-IgM and placed on PLB, and dSTORM images were acquired. Because the average localization precision of single molecules in our dSTORM experiments ranged between 15 and 20 nm, the two-dimensional Gaussian PSF would have a maximum 3σ value of ∼60 nm. A molecule has 99.7% probability of residing within an area with radius equivalent to 3σ of the PSF. The sparse labeling predicts that the spatial separation between any two Alexa Fluor 647–Fab anti-IgG or –Fab anti-IgM molecules would be significantly larger than the PSF of our dSTORM experiments (i.e., >60 nm). If so, the localizations confined within a spatially isolated area with radius equivalent to the PSF would represent localizations arising from a single Alexa Fluor 647–Fab anti-Ig molecule. Such spatially isolated localizations from a single molecule would allow the counting of the number of reappearances, if any, from each isolated dye molecule. The results showed that the majority (∼80%) of labeled BCRs appeared once in the superresolution dSTORM image but that a fraction appeared more than once (Figure 2C). The number of multiple occurrences was largest for two appearances, and the number of multiple occurrences decreased to nearly undetectable levels for 10 occurrences. Because the distribution of multiple appearances was nonnormal without a defined mean, it was difficult to computationally correct for the phenomenon. Thus at least a fraction of localization clusters in the final dSTORM image are likely to represent a single BCR.
To quantify the distribution of BCR SM localizations in the dSTORM images of IgM- and IgG-expressing B-cells that were resting or activated with antigen, we used a modified Hoshen–Kopelman cluster analysis (Hoshen and Kopelman, 1976). A modified Ripley’s K function analysis and a pair correlation analysis–based technique have been used for quantification of superresolution images, with the pair correlation technique being better suited to quantifying images that are subject to overcounting and prone to overestimations of clustering (Sengupta et al., 2011; Veatch et al., 2012). Both of these techniques treat the superresolution image in its entirety and calculate average values of clustering parameters for the whole image by evaluating increased clustering of molecules in the image compared with random distributions. Consequently these methods do not provide spatial information at the single-cluster level. These methods, when applied to analyze the spatial distribution of BCR localizations, compute a single average value to describe the complex spatial clustering pattern, masking the heterogeneities in clustering properties of BCRs. Thus information concerning important biological parameters such as the size and number of BCR localizations per cluster would be obscured using either pair correlation– or Ripley-based methods. To capture the details of BCR spatial organization, we instead used a modified Hoshen–Kopelman–based cluster analysis (Hoshen and Kopelman, 1976) that identifies and visualizes individual clusters of molecules and isolated individual molecules in the composite superresolution image. We refer to each spatially isolated protein assembly (i.e., a group of SM localizations separated from all other SM localizations by a distance of >60 nm, the size of the PSF), identified by this analysis as a protein island, with the minimal island containing only one spatially isolated BCR SM localization, as depicted in Figure 2D and shown for dSTORM data (Supplemental Figure S2). Identification of individual protein islands allowed us to count the exact number of BCR SM localizations present in each protein island and generate a statistical distribution of island occupancy. Note the number of BCR SM localizations detected in protein islands under saturating conditions of the Alexa Fluor 647–Fab anti-IgG or –Fab anti-IgM Alexa may not be equal to the absolute number of BCRs in the islands but will likely provide an overestimate because of blinking-induced reappearances described earlier that we could not correct for. It is also possible that under saturating conditions, more than one Alexa Fluor 647–Fab anti-IgG or –Fab anti-IgM could bind to a single BCR, which would also contribute to overcounting. However, the island occupancies (i.e., number of BCR SM localizations within the island) can be used to estimate the relative changes in the number of BCRs under different experimental conditions. We also estimated the size (radius) of the protein islands and density of BCR SM localizations within islands by calculating the convex hull or smallest convex set for the set of BCR SM localizations that formed an island. By this definition, densities could not be defined for islands with a single localization (a point) or two localizations (a line). Overcounting will not affect the evaluation of various important nanoscopic aspects of the spatial organization of BCRs such as the size and shape of the protein islands and the relative changes in density of protein islands using this clustering analysis. Overall, this strategy enables the generation of statistical distributions of characteristic cluster parameters without averaging out the underlying details of the heterogeneous distribution and thereby provides an accurate description of the spatial properties of the protein organization.
Using Hoshen–Kopelman analysis to confirm presence of isolated Alexa 647–labeled IgM and IgG BCRs in sparsely labeled cells
The modified Hoshen–Kopelman–based cluster analysis was used to confirm that the individual SM localizations in sparsely labeled IgM- and IgG-expressing cells were in fact from individual BCRs (Figure 2E). The analysis showed that the radii of the protein islands in sparsely labeled cells, irrespective of the number of SM localizations within each protein island, were ≤60 nm, indicating that the localizations of an individual protein island were always distributed within an area equivalent to the PSF of our dSTORM experiments. This supports our assumption that the Alexa Fluor 647 molecules in the sparsely labeled data sets were separated by distances larger than the PSF and that each cluster of localizations confined within an area equal to the PSF represented multiple appearances from a single dye molecule. The density of SM localizations within the islands increased linearly with occupancy (i.e., number of SM localizations) within protein islands, and islands with same number of localizations had the same density, consistent with each island having the same area (equivalent to the PSF). Alexa Fluor 647–Fab anti-IgG and –Fab anti-IgM behaved nearly identically in these analyses (Figure 2, C and E), indicating that using two different Fab antibodies would not introduce biases in counting BCR SM localizations in IgG- and IgM-expressing cells. We also characterized the multiple appearances of spatially isolated IgG and IgM immobilized on glass coverslips and labeled with a saturating amount of Alexa 647–labeled Fab antibodies. Under these conditions, the labeled IgG and IgM exhibited similar blinking behavior (Supplemental Figure S3B), which indicated that IgG and IgM are labeled similarly by the Alexa 647–labeled Fab anti-IgM and -IgG, further confirming that the IgG and IgM localizations on resting and stimulated B-cell surfaces can be used to compare their spatial distribution in those situations.
The spatial distribution of IgM and IgG BCRs on resting and antigen-activated human B-cells
Using the strategy described, we found that BCR islands on both IgM- and IgG-expressing cells were highly heterogeneous, varying in both size and number of receptor SM localizations per island. For resting IgM BCR–expressing B-cells, 27% of total BCR SM localizations were present as spatially isolated single localizations (Figure 3A), accounting for >60% of the protein islands on B-cell surfaces (Figure 3B). The observation that at saturating conditions of Alexa Fluor 647–Fab anti-IgM labeling, 27% of the BCR localizations were present as single, isolated localization addresses the issue of multiple binding of Alexa Fluor 647–Fab anti-IgM to individual BCRs and suggests that such events would be infrequent. The remaining 73% of BCR localizations were in islands that were highly heterogeneous in the number of receptor SM localizations they contained (Figure 3A). The number of BCR SM localizations in islands containing >10 BCR SM localizations ranged from 11 to >200 BCR SM-localizations per island (Figure 3C), with a median of 16 BCR SM localizations per island. Antigen activation of IgM-expressing B-cells resulted in a large increase in the total number of BCR SM localizations in the contact area between the B-cell and the PLB (Figure 1C), and although spatially isolated single BCR localizations decreased to 15% of total localizations, the percentage of protein islands that contained only a single BCR localization did not change significantly and accounted for 58% of islands. However, there was a large increase in the percentage of BCR SM localizations that were in islands that contained larger numbers of BCR SM localizations (Figure 3, A and B). Strikingly, the islands that contained >10 BCR SM localizations had significantly more BCR SM localizations in antigen-activated IgM B-cells than in resting cells, ranging from 11 to >500 BCR SM localizations per island, with a median of 18 BCR SM localizations per island (Figure 3C). The distribution of IgM BCR SM localizations in discrete islands and the effect of antigen engagement on that distribution are graphically represented in Figure 4.
FIGURE 3:

Quantitative analysis of the distribution of IgM and IgG BCRs on resting and activated B-cells. (A) Percentage of total BCR peaks that reside in protein islands containing 1–10 or >10 BCRs. (B) Frequency of spatially isolated BCR protein islands that contained 1–10 BCR localizations or >10 BCR localizations. (C) Distribution of the number of BCR localizations per protein island for islands that contained >10 BCR localizations. Each dot represents a single protein island. Black line, median number of receptor localizations per protein island. Data were from 21–30 cells for each condition from two or three independent experiments and compared by two-tailed Mann–Whitney U test. ****p < 0.0001, ***p < 0.001. (D) Percentage of BCR protein islands containing monomers (filled bars) and dimers (open bars) in each individual cell expressing the total given number of BCRs.
FIGURE 4:
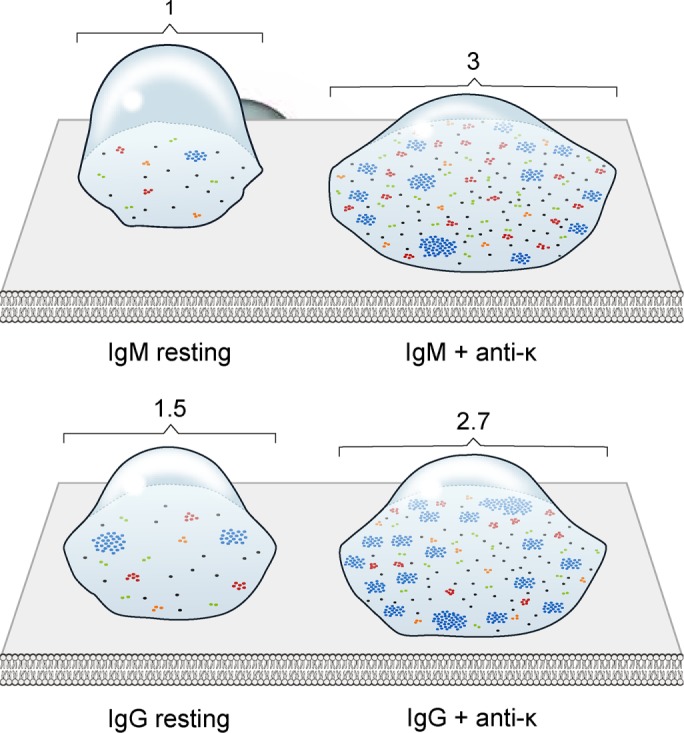
The nanoscale organization of IgM and IgG BCRs on resting and activated B-cells. Schematic representation of the distribution of IgM and IgG BCRs on the contact area of IgM- and IgG-expressing human B-cells on PLB. Monomers (black dots), dimers (green dots), trimmers (orange dots), protein islands containing 4–10 receptors (red dots), and protein islands containing >10 receptors (blue dots) are drawn under each condition reflecting the dSTORM data. The numbers on top of each cell denote the relative size of the contact area of the cell.
The distribution of IgG BCR SM localizations on resting B-cells differed from that of IgM BCR localizations. Of note, the percentage of spatially isolated, single IgG BCR SM localizations (15%) was nearly half of that for IgM BCR localizations (Figure 3A), even though the frequency of protein islands that contained only a single BCR SM localization was similar to that of IgM-expressing resting cells, ∼60% (Figure 3B). Greater than 50% of the IgG BCR SM localizations were in islands containing >10 BCR SM localizations (Figure 3A). The average number of IgG BCR SM localizations in islands containing >10 BCR SM localizations had a wider distribution than that for IgM BCRs (11 to 4 × 10³ BCR SM localizations per island, with a median number of receptor localizations per island of 18; Figure 3C). In antigen-activated B-cells, <10% of the IgG BCR SM localizations were present as spatially isolated single localizations (Figure 3A) even though the frequency of protein islands that contained only a single BCR localization did not change, accounting for ∼60% of all islands (Figure 3B). There was a large increase in the percentage of total BCR SM localizations that were in islands that contained >10 BCR localizations (Figure 3, A and B), and the number of IgG BCR SM localizations in these islands ranged from 11 to 1 × 10⁴ BCR localizations per island, with a median value of 22 BCR localizations per island (Figure 3C). The distribution of IgG BCR SM localizations on resting and antigen-activated B-cells is graphically represented in Figure 4. These results indicate that IgG BCRs in resting cells are present in larger clusters than in IgM BCRs, which may facilitate the antigen-driven increase in the frequency of BCR clusters that contain larger numbers of BCR and may also be related to the rapid growth of IgG BCR clusters after antigen engagement, as previously described (Liu et al., 2010b).
We were interested in the relationship between small BCR islands containing either single SM localizations (which likely represent BCR monomers) or two SM localizations (a fraction of which possibly represent BCR monomers, with the rest representing BCR dimers) and larger BCR islands with multiple SM localizations on both resting and antigen-activated cells. We asked whether the frequency of the smaller islands (with one or two SM localizations) correlated with the total number of BCR SM localizations in the contact area with the PLB for each of the 21 IgM-expressing and 30 IgG-expressing B-cells analyzed. The total number of IgM BCR SM localizations per cell varied up to 48-fold, and yet the frequency of BCR islands with single or two SM localizations remained relatively constant for both resting and antigen-activated B-cells (Figure 3D). A similar phenomenon was observed for IgG-expressing B-cells. These data indicate that B-cells intrinsically maintain a high frequency of small BCR islands with a single or two SM localizations (i.e., islands that likely represent BCR monomers or dimers) independently of the total number of BCR localizations in the contact area of the B-cell and the PLB, suggesting an important function for these structures. Given that the analysis of multiple blinking indicated that ∼20% of dye molecules appear more than once in the final dSTORM image (Figure 2C), these data suggest that cells maintain an even higher frequency of monomeric BCRs on the surfaces of both resting and activated cells.
Together these data describe the spatial organization of BCRs on the surface of resting B-cells as highly heterogeneous protein islands that contain a wide range of numbers of BCRs but with a predominance of monomers (as indicated by a large fraction of islands containing only one or two BCR SM localizations), as depicted in Figure 4. The spatial organization of IgM and IgG BCRs can be distinguished by dSTORM and suggests that preclustering of IgG BCRs may be a mechanism to amplify antigen-driven clustering in IgG-expressing B-cells. For both IgM and IgG BCRs, after antigen engagement, the percentage of total BCR localizations that were present as spatially isolated single localizations decreased, but islands with single localizations still represented the predominant BCR islands, and the percentage of BCR SM localizations in islands containing >10 BCR localizations increased. Of note, there is no evidence in these data that antigen engagement increased the frequency of islands that contained fewer of either IgM or IgG BCR localizations, at least at the 10-min time point after antigen stimulation.
BCR cluster size, density, and interisland distance
From dSTORM data, it is also possible to calculate additional important parameters of the nanoscale organization of BCRs on B-cell surfaces, including size (radius) of the BCR islands, density of the BCR SM localizations within islands, and distance between islands.
The average radius of IgM-BCR islands on resting B-cells was similar to that of IgG BCR islands on resting B-cells (r ≤ 60 nm for the majority of islands, with BCR localizations confined within an area equal to the PSF; Figure 5A). Because the size of protein islands <∼60 nm (i.e., smaller than the PSF) cannot be accurately measured, we set 60 nm as the smallest radius of protein islands for our analysis. Both IgM and IgG BCR islands with radii ≥200 nm were infrequent, and the average radii and the range of the radii of these larger clusters were similar (Figure 5B). After antigen engagement, although the radii of both IgM BCR and IgG BCR islands increased, the increase for the IgG BCR was larger, and the IgG BCR islands were more heterogeneous in size, ranging in radius to >1 μm (Figure 5B). However, in all cases, namely, IgM BCRs and IgG BCRs for both antigen-stimulated and unstimulated cells, the radii of the protein islands correlated with the number of BCR SM localizations per island (correlation factors of 0.9719 for resting and 0.9224 for activated IgG-BCR islands and correlation factors of 0.8690 for resting and 0.9159 for activated IgM-BCR islands; Figure 5C).
FIGURE 5:

Size of IgM and IgG BCR protein islands in B-cells on nonactivating and activating bilayers. (A) Distribution of protein island radius. Protein islands with <60 and >200 nm radius are categorized separately. (B) Distribution of protein island radius >200 nm. Each dot represents a single protein island. Black line, median protein island radius with r ≥ 200 nm. Data were acquired from two or three independent experiments with a minimum of 10 cells/ experiment for each condition and compared by two-tailed Mann-Whitney U test. ****p < 0.0001, ***p < 0.001; ns, nonsignificant. (C) Number of receptor localizations per protein island plotted as a function of island radius for IgM and IgG BCRs under resting and activating conditions. IgM and IgG BCR protein islands in resting (left) and anti-κ activated (right) cells. ρ is Spearman’s rank correlation coefficient. Protein islands containing dimers are excluded from these graphs because two receptors cannot define an area.
Remarkably, in contrast to the positive correlation between the number of BCR SM localizations per island and the size (radius) of the islands, the density of BCR SM localizations within islands did not show a positive correlation with the number of receptor SM localizations per island (Figure 6). Overall, the distribution of BCR SM-localization densities was similar for IgM and IgG islands (Figure 6A). The average densities of the densest IgM and IgG BCR islands were also similar (Figure 6B). However, there appeared to be no positive correlation between density and number of BCR SM localizations in any of the experimental conditions (Figure 6C). In fact, the majority of islands that contained many BCR SM localizations were less dense than islands containing fewer BCR SM localizations. This suggests that the larger, less dense islands may be composed of assemblies of smaller, highly dense islands.
FIGURE 6:

Quantitative analysis showing densities of IgM and IgG BCR protein islands on resting and activated B-cells. (A) Frequency of receptor density per nanometer squared in protein islands. Protein islands with a density <5 × 10⁻⁴ and >1 × 10⁻² receptor localizations/nm2 are categorized separately. (B) Distribution of the protein islands with a density >5 × 10⁻² receptor localizations/nm2. Each dot represents a single protein island. Data were compared by two-tailed Mann–Whitney U test. ****p < 0.0001; ns, nonsignificant. Black line, median density of protein islands with density ≥5 × 10⁻² receptors/nm2. Data were acquired from 21–30 cells from two or three independent experiments for each condition. (C) Island density per nanometer squared plotted as a function of number of receptor localizations per protein island. (D) Island radius (left) and density (right) plotted as a function of protein islands containing 3–10 BCR localizations. Protein islands containing dimers are excluded from these graphs because two receptors cannot define an area.
Next we compared the scaling of the radius and density of protein islands with the number of IgG and IgM BCRs per protein island in data sets from stimulated and unstimulated cells. The analysis showed that protein islands with fewer than five BCR SM-localizations have a radius of 60 nm (i.e., they are confined within an area equivalent to the PSF), but protein islands with five or more BCR SM localizations have a wide range of radii (ranging from 60 to >120 nm), with many being larger than the PSF (i.e., with radius >60 nm). As discussed earlier (Figure 2E), localizations arising from the same BCR molecule are confined within an area equal to the PSF of our experiments (i.e., 60-nm radius). This indicates that the protein islands containing five or more BCR localizations and having a radius >60 nm (Figure 6D) represent SM localizations arising from multiple Alexa Fluor 647–labeled BCR molecules. Consistent with this, the density of the protein islands with more than five localizations, unlike those in the sparsely labeled data (Figure 2E), do not scale linearly with the number of localizations. Instead, the islands have a wide range of densities, further confirming that the multiple localizations in these islands do not arise from multiple appearances of a single Alexa Fluor 647 molecule. Instead, the protein islands with five or more localizations should represent assemblies of multiple IgG or IgM BCR molecules. Thus, from these results, we can conclude that the smallest oligomers contain at the most five BCRs. This would be the case if all five localizations represent unique BCR molecules. However, because some of the Alexa Fluor 647 molecules are likely to appear more than once, as discussed earlier, due to multiple appearances of ∼20% of Alexa Fluor 647 molecules (Figure 2C), the smallest oligomers are likely to comprise fewer than five BCR molecules.
The change in density of BCR SM localizations with the number of BCR localizations per island can be used to distinguish two possibilities concerning the molecular basis of BCR clustering. The first is that antigen-engaged BCRs cluster due to BCR protein–protein interactions, in which case the receptor assemblies should have a very high density. In this model, regardless of the number of BCRs per structure, structures of similar densities form as long as the mode of protein–protein interaction remains the same. In the second model, antigen-engaged BCRs partition into and cluster within areas on the plasma membrane defined by heterogeneity in lipid or protein composition. In this case, if the area of the protein island remains the same and the number of receptors within the protein island increases, the average density of receptors in the island will increase. Our results show that islands with few receptor SM localizations often have higher density than islands with more BCR SM localizations (Figure 6C). This indicates that protein–protein interactions are more likely to mediate the formation of small BCR clusters, whereas such interactions are unlikely to be involved in the clustering of BCRs into less dense, larger protein islands. We also find that the areas of protein islands scale with occupancy, with more receptors present in islands with larger areas. This indicates that the larger clusters are not formed by partitioning of receptors into preexisting membrane domains of fixed size. However, the observed clustering pattern can still be governed, at least at some level, by membrane lipid–mediated interactions through interactions of activated receptors with membrane heterogeneities and further expansion of such heterogeneities.
The average distance between the centroids of protein islands are similar in resting IgG BCR–expressing B-cells and resting IgM BCR–expressing B-cells (Figure 7). As shown earlier, the total number of BCR SM-localizations at the contact area of the B-cell with the planar lipid bilayer increased with BCR stimulation (Figure 1C). The increased BCR localizations can be accommodated in preexisting protein islands, leading to alteration in island occupancy (i.e., number of SM localization per island) and possible changes in size and density. In such a scenario, the average intercentroid distance would be expected to stay the same. Alternatively, new protein islands might form upon activation, which are populated by some of these BCRs. This will change the average interisland distance. After antigen activation, the interisland distance decreased by a similar extent for IgM BCR– and IgG BCR–expressing B-cells (Figure 7A). Concomitantly, the number of isolated protein islands also increased after antigen activation. Together these data indicate that antigen activation induces the formation of new protein islands, leading to greater crowding of islands on the plasma membrane.
FIGURE 7:

IgM and IgG BCR protein islands get closer after anti-κ activation. (A) Minimum interisland distance of IgM and IgG BCR protein islands on resting and activated B-cells were quantified, and means and SDs are plotted (n = 21 for IgM resting, IgM + anti-κ, IgG resting; n = 31 for IgG + anti-κ). (B) Distribution of minimum interisland distance. Black line, median. Two-tailed Mann–Whitney U test was performed comparing the minimum interisland distances of resting cells vs. anti-κ activated cells. ****p < 0.0001. (C) Circularity of IgM and IgG protein islands plotted as a function of number of receptor localizations per protein island under resting and activating conditions. The circularity value ranges between 0 and 1, with 1 being a perfect circle and values closer to 1 showing smaller deviation from a circular shape. Each dot represents a single protein island.
We also analyzed the circularity of the protein islands. The tendency of protein assemblages in membranes to form circular structures indicates a possible role of membrane lipid–driven liquid–liquid phase separation in formation of such assemblies (Dietrich et al., 2001). Our analysis showed that the large islands tend to have circular shapes, indicating that such lipid-mediated phase partitioning likely determines the shapes of these islands (Figure 7C).
DISCUSSION
We have only a partial understanding of the spatial organization of BCRs on B-cell surfaces and how antigens affect this organization. The recent development of superresolution fluorescence microscopy methods that allow lateral resolution of up to ∼20 nm offers a promising approach to gain an understanding of the nanoscale spatial organization of BCRs in the plasma membrane. Here we used dSTORM superresolution imaging in conjunction with a novel combination of analytical tools to characterize the spatial organization of IgM and IgG BCRs on the surfaces of resting and antigen-activated human peripheral blood B-cells. These analyses provided evidence that both IgM and IgG BCRs reside in highly heterogeneous protein islands on resting B-cells that vary in size and number of BCR localizations. IgG BCRs are more clustered than IgM BCRs on resting cells and form larger protein islands after antigen activation. Even though a portion of both IgM and IgG BCRs reside in large protein islands, the presence of a large number of spatially isolated, single BCR localizations in the dSTORM images suggest that both resting and activated B-cells intrinsically maintain a high frequency of BCR monomers. Antigen activation induces the formation of new protein islands, and protein–protein interactions likely mediate the formation of small, highly dense BCR oligomers that come together to form larger, less dense, islands, a process governed at least in part by membrane lipid interactions.
A critical feature of the combination of analytical tools we used in this study is that they accounted for multiple appearances of single fluorescent receptors in contiguous frames. Overcounting is a common but an underappreciated problem in point localization–based superresolution microscopy methods, and studies have shown that distinguishing a single receptor with multiple appearances from clusters of receptors is challenging without particular attention to this phenomenon (Sengupta et al., 2011; Veatch et al., 2012). To address overcounting in our data, we developed an analysis algorithm to correct for multiple appearances of a single receptor in contiguous frames. This analysis determined that ∼60% of localized peaks arise from the spreading of fluorescence from a single molecule over several contiguous frames. We could not completely eliminate multiple localizations originating from a single receptor because multiple random blinking of Alexa Fluor 647 that occurred in discontiguous frames showed nonnormal distribution without a defined mean in our system. Our analysis of sparsely labeled receptors shows that ∼20% of receptors appear more than once in the final processed dSTORM image under our imaging conditions, with nearly all of these appearing only twice. Thus it is likely that a portion of dimers identified by our cluster analysis represent single BCRs. Even accounting for this possibility, our data provided novel insight into the fundamental process of antigen-driven BCR clustering, as well as into differences in the spatial organization of IgM and IgG BCRs that might contribute to the characteristic differences in the response of naive and memory B-cells to antigens.
The nanoscale data presented here fill a critical gap in our knowledge of the process of BCR clustering and synapse formation by providing evidence that the basic BCR signaling unit is an oligomer that contains five or fewer BCRs and that these oligomers do not come into molecular proximity with one another as they form larger BCR islands. The key finding that supports this conclusion is that the density of BCR islands does not increase with the number of BCR localizations per island. In fact, the densest islands contained few BCR localizations, whereas there was a significant decrease in density in most of the larger islands. The drop in density for islands containing a larger number of BCR localizations indicates that BCR oligomers do not come into close molecular proximity in larger structures but maintain the structural characteristics of smaller oligomers.
We also determined that even on resting B-cell surfaces, even though most islands contained only a single BCR localization, accounting for 15–30% of all BCR localizations, BCRs existed in a wide array of islands that differed in size and the number of BCR localizations per island. This observation raises a question about the relationships between these different structures on resting and antigen-activated B-cells. In earlier studies, we used FRET between fluorescent proteins expressed in the cytoplasmic domains of Igα and Igβ to measure interactions between BCRs and observed little or no FRET in resting B-cells, leading us to conclude that most BCRs were monomers (Tolar et al., 2005). FRET was detected upon BCR antigen engagement, indicating clustering; however, the FRET between the cytoplasmic domains of antigen-engaged BCRs was highly transient. Because the loss of FRET was dependent on the phosphorylation of the Igα and Igβ cytoplasmic domains by the Src family kinase Lyn, we interpreted the loss of FRET as the “opening” of the BCR cytoplasmic domains. We concluded that the initiation of BCR signaling involved oligomerization of BCRs bringing the BCR cytoplasmic domains into close molecular proximity, followed by the recruitment of Lyn and the opening of the BCR’s cytoplasmic domains to allow the further assembly of a signaling complex. In related studies, we also observed that as BCR clusters grew in size, as measured by fluorescence intensity of labeled BCRs, the FRET between BCRs did not continue to increase. This observation suggested that the cytoplasmic domains of antigen-clustered BCRs remained in an open (no-FRET) conformation as they formed larger structures and, moreover, that the BCRs forming larger structures did not come into the same molecular proximity as did the BCRs in structures that first formed upon antigen engagement (Sohn et al., 2008). Relating these findings to the present dSTORM data suggests that the observed monomers may form signaling-active oligomers that contain five or fewer BCRs that remain in an open conformation as they come together to form larger structures. If this is the case, at any given time in resting B-cells, the FRET signal would be low or undetectable not because BCRs were not in close molecular proximity in oligomers, but because those oligomers were in an open conformation.
What, then, is the function of BCR oligomers on resting and activated cells and their relationship to the larger structures observed? We speculate that oligomers may form spontaneously on resting BCR surfaces and that, once formed, the oligomers come together to form larger structures. The function of the oligomers could be for tonic signaling. Our earlier studies provided evidence for a mechanism of spontaneous BCR oligomerization describing a change in the membrane-proximal domains of IgG (γ3) and IgM (µ4) that occurred with the binding of BCRs to monovalent antigens on an opposing membrane (Tolar et al., 2009). The γ3 and µ4 domains were necessary for BCR clustering and, when expressed on the surface of B-cells alone, spontaneously clustered and signaled. We hypothesized that BCR spontaneously undergo this “conformational” change at some low rate and that, upon random bumping with other BCRs that had undergone a conformational change, form signaling-active oligomers. In such a model, the process of oligomerization and the coming together of oligomers into larger structures would be similar in resting and activated B-cells, with the process greatly accelerated by antigen binding.
Description of the dynamics of BCR movement in the B-cell membrane using single-molecule tracking in TIRF microscopy (TIRFM) may also lend insights into the interpretation of these dSTORM data (Tolar et al., 2009). These studies showed that most receptors on the surface of resting B-cells are freely diffusing. These data suggest that the BCRs on resting cells observed in the present studies to be in large structures may be freely diffusing within a confined area. The single-molecule tracking results also showed that diffusion of BCRs after antigen engagement dropped markedly, indicating that these were immobilized. Taken together with the results presented here, these data suggest that the BCRs in large structures on resting B-cells are freely diffusing and BCRs in larger structures on antigen-activated cells are immobilized. If this is indeed the case, then large BCR islands on resting versus activated B-cells are qualitatively different.
Concerning differences between the nanoscale organization of IgM and IgG BCRs, we determined that the organization of IgG BCRs was distinct from that of IgM BCRs. On resting B-cells, a smaller fraction of IgG BCR localizations appear as spatially isolated monomers than do IgM BCRs. In addition, there were more islands with >10 IgG BCR localizations on the surfaces than in IgM BCR cells. Thus there appears to be an inherently distinctive nanoorganization of BCRs on B-cell surfaces according to receptor isotypes or possibly the differentiated state of the B-cell expressing the receptors. For both IgM and IgG BCRs, activation on membrane-bound antigen resulted in the formation of larger islands containing tens to thousands of BCR localizations. Compared with IgM BCRs, the frequency of larger islands was higher for IgG BCRs, with the IgG BCR islands having a larger average number of BCR localizations per island, as well as a wider range in the number of BCR localizations. These observations from dSTORM images are consistent with results from TIRFM images, in which we observed that IgG BCRs clustered more rapidly and formed larger structures than did IgM BCRs (Liu et al., 2010b). The nanoscale organization of the IgG BCRs, which shows more clusters even in resting cells, may facilitate rapid growth of IgG BCR clusters into larger islands.
Three recent studies also used superresolution microscopy to characterize BCRs on the plasma membranes of B-cells. Mattila et al. (2013) pioneered the use of dSTORM to determine the nanoscale organization of IgM and IgD BCRs on the surfaces of naive resting mouse splenic B-cells as part of a study to determine the contribution of actin and tetraspanin networks to the cell surface organization of BCRs. They showed that both IgM and IgD BCRs were nonrandomly distributed and organized into small nanoclusters on resting primary mouse B-cells. They observed that ∼38% of IgM BCRs were in nanoclusters of 80 nm radius that contained ∼20–50 molecules per cluster. However, they did not report on the frequency of BCRs in monomers. For IgD BCRs, 70% were in clusters of 80 nm radius in resting cells that contained ∼30–120 BCRs. They also found that IgD nanoclusters were more densely packed than IgM clusters. Thus IgM and IgD had different nanoscale spatial organizations on resting splenic B-cells. Because both receptor types were expressed in the same cellular context, the differences in organizations were presumably BCR intrinsic. Both IgM and IgD BCRs showed marked increases toward larger clusters upon activation with soluble antigen. Although it is not possible to directly compare details of the results from their study and ours, primarily because of differences in data analysis, the overall picture is similar, namely that BCR of different isotypes have distinct nanoscale organizations on B-cell surfaces and that antigen drives BCRs toward larger clusters. It is of interest that the organization of IgM and IgD BCRs did not change upon treatment with latrunculin A, suggesting that these organizations are independent of actin cytoskeleton.
Similar results to those presented here were obtained by Avalos et al. (2014), who used dSTORM to analyze the spatial organization of IgG1 BCRs on ovalbumin (OVA)-specific B-cells from mice generated by somatic cell nuclear transfer using the nucleus of an OVA-specific B-cell as a donor. These mice provided a unique opportunity to investigate the behavior of isotype-switched BCRs in the context of naive B-cells. They demonstrated that >90% of IgG1 BCRs were monomers or dimers on resting cells. They also observed a significant increase of the percentage of clusters with more than three BCRs after monovalent antigen engagement. The predominant organization of BCRs into small clusters, monomers and dimers, and the antigen-induced formation of clusters containing larger numbers of BCRs are similar to the observations reported here for both IgM and IgG BCRs on the surface of human B-cells. This is of particular interest because the IgG1 BCRs were expressed on naive B-cells rather than on differentiated memory B-cells as in our studies, suggesting the possibility that the nanoscale organization of IgG BCRs may be BCR intrinsic and not influenced by the differentiated state of the B-cell in which they are expressed.
Maity et al. (2015) used dSTORM to study triply deficient (RAG, λ5, and SLP65) mouse B-cell lines expressing single-chain IgM BCRs and IgD BCRs. They normalized overcounting in some of the analyses by using a pair autocorrelation function. However, they calculated the blinking properties of their fluorophore by measuring blinking on poly-l-lysine surfaces and showed better and more predictable behavior of the fluorophores than that observed here. They showed a heterogeneous, wide range of BCRs per protein island, with a median of 30 IgM BCRs per island and 48 IgD BCRs per island. The median radius for the IgM and IgD BCR islands was 218 and 290 nm, respectively. However, no information was provided on the percentage of BCRs that occupied these islands. Nonetheless, these data are consistent with the conclusion that BCRs of different isotypes have distinctive nanoscale organization on cell surfaces. Strikingly, both IgM and IgD BCRs were found in dissociated monomers upon stimulation. In contrast, our data provided no evidence for an increase in BCR monomers or dimers after antigen activation, at least not at 10 min after antigen exposure. It may be a limitation to the interpretation of results of Maity et al. (2015) that only ∼10% of the total number of surface BCRs was imaged by dSTORM, reconstructed from 6000 frames. The data in our study were reconstructed from 20,000 frames to map most of the receptors present on the contact surfaces because 10,000 frames were not enough to fully capture the stochastic activation and consequent localization of BCRs in our cells. These authors also report that latrunculin A treatment reduced the number of BCRs per island, in contrast to the findings of Mattila et al. (2013) showing that the nanoscale organization of BCRs was not dependent on the actin network. This finding raises the possibility that the transfected cell lines may differ from naive B-cells in their molecular requirement for nanoscale organization. Such differences could account for the differential effect of antigen activation on BCR organization.
Clearly, much more remains to be learned about the nanoscale organization of immunoreceptors and the effect of antigen engagement on this organization. The application of new combinations of analysis of dSTORM data that allowed for the resolution and quantitation of individual BCRs presented here provide a new means to gain insight into the mechanisms underlying the initiation of BCR signaling in the future.
MATERIALS AND METHODS
Sample preparation
Primary human B-cells were isolated from the peripheral blood of healthy donors by negative selection with a magnetic bead–based human B-cell isolation kit (Stemcell Technologies) according to the manufacturer’s instructions. Cells were labeled with Alexa Fluor 647–conjugated F(ab) of antibodies specific for IgM or IgG (Jackson ImmunoReseach) at 300 nM for 10 min on ice and washed with phosphate-buffered saline (PBS). The fluorophore-to-F(ab) ratio was 1.57 and 1.67 for IgM and IgG, respectively. The purity of the F(ab) preparations was >99% (tested by immunoelectrophoresis and double immunodiffusion assay vs. anti–Fc-specific antibodies). Cells were allowed to settle on fluid planar lipid bilayer with or without anti-human κ light chain at 37°C for 10 min. The samples were then fixed in 4% paraformaldehyde at 37°C for 10 min and imaged in PBS with 100 mM 2-mercaptoethylamine (MEA) and an oxygen scavenger system consisting of 0.5 mg/ml glucose oxidase (Sigma-Aldrich), 40 μg/ml catalase (Sigma-Aldrich), and 5% (wt/vol) d-glucose. For live-cell, time-lapse TIRF imaging, cells were labeled with Alexa Fluor 647–conjugated F(ab) of antibodies specific for IgM or IgG at 300 nM concentration each, washed twice, and added to the fluid planar lipid bilayer containing anti–human κ light chain at 37°C.
Preparation of fluid planar lipid bilayer
Fluid planar lipid bilayers were prepared as described previously (Davey et al., 2012). Briefly, the manufacturer’s coverslip was removed from LabTek I eight-well chambers (Thermo Fisher Scientific) and new #1.5 glass coverslips were cleaned with NanoStrip (Cyantek), rinsed, and glued to the chamber bottom. Biotin-containing lipid bilayers were then prepared by fusing unilamellar vesicles of 99% 1,2-dioleoyl-sn-glycero-3-phosphocoline and 1% 1,2-dioleoyl-sn-glycero-3-phosphoethanolamine-cap-biotin (Avanti Polar Lipids) to the coverslips and then incubated with 50 nM streptavidin (Invitrogen) for 10 min. For stimulating conditions, bilayers were further incubated with 10 nM biotin-F(ab′)2 anti–human κ light chain for 20 min.
Microscopy
For dSTORM, cells were imaged with an Olympus IX-81 inverted microscope equipped with a TIRF port, an oil-immersion 100× objective (TIRF 1.1, numerical aperture 1.45), an autofocus system (CRISP; Applied Scientific Imaging), and an electron-multiplying charge-coupled device camera (Evolve Delta; Photometrics), typically following a published protocol for dSTORM imaging (Kechkar et al., 2013). Excitation of Alexa Fluor 647 was accomplished using a 647-nm diode laser (OBIS). For each cell, 20,000 frames were acquired with an exposure time of 33 ms using MetaMorph software (Molecular Devices). For live-cell time-lapse imaging, objective lens and heated stage were maintained at 37°C with 5% CO2, and TIRF images were acquired at 2-s intervals with an exposure time of 33 ms after addition of cells to chambers containing bilayers.
dSTORM data analysis
Single-molecule localizations in dSTORM images were accomplished with the superresolution module in MetaMorph software (Molecular Devices) after correction of the drift using fiduciary markers (TetraSpeck microspheres, 100 nm; Life Technologies). The contact area of the B-cells and gray value intensity for polarized and unpolarized cells were measured using ImageJ software (National Institutes of Health, Bethesda, MD).
The fluorescence signal of single Alexa Fluor 647 molecules often lasts longer than the exposure time of a single image in a time series and thus spreads across consecutive images until it either blinks off or is irreversibly photobleached. When such peaks are fitted and displayed, an artifactual cluster of peaks results. Typically, these peaks spread within an area equivalent to the PSF of the imaging system, which is a two-dimensional Gaussian with a σ of ∼20 nm. To correct for such artifactual clustering arising from interruption of the single-molecule signal by frame transition, all peaks appearing in consecutive frames within a radius of 3σ (equivalent to an area representing 99.7% of probability density) were grouped together and substituted with a single peak whose position coordinates were calculated as a weighted average of the position coordinates and localization precision of the individual peaks comprising the group. Next a composite superresolution image was generated by combining all the grouped peaks from the entire image series. The single-molecule localizations in this composite image were organized in a heterogeneous pattern composed of single, isolated localizations and clusters with varying size and number of localizations. The commonly used pair correlation– and Ripley’s function–based cluster analysis methods (Sengupta et al., 2011; Veatch et al., 2012) compute average estimates of cluster parameters (e.g., size, density, and occupancy number) over the entire image and thus are not able to provide an appropriate quantitative description of the heterogeneous spatial patterning of the BCRs. To quantify the heterogeneous spatial distribution of the BCRs in the composite dSTORM images, we instead used a modified Hoshen–Kopelman (Hoshen and Kopelman, 1976)–based cluster analysis that uses an iterative spatial clustering analysis to identify and visualize individual clusters of molecules and spatially isolated single molecules within the superresolution image.
The localization precision of the single molecules was used as a metric for assigning the molecules to individual protein islands, which are defined as spatially isolated assemblies of proteins. Briefly, an iterative grouping process was used to identify all neighboring single molecules within a distance of 60 nm (∼3σ of the PSF of the imaging system) and assigned them to the same protein island. By performing this operation over the composite superresolution image, we could evaluate the spatial location of individual protein islands and the distribution of proteins within the islands. This enabled the computation of cluster parameters such as size, shape, density, and protein numbers of each individual protein island. Because at least three points are required to define a two-dimensional space, the size and shape analyses of protein islands were performed on islands containing at least three protein peaks. The space occupied by each protein island was demarcated by calculating the convex hull (the smallest convex set) for the set of molecules comprising the protein island. The lines joining the vertices of the convex hull served to circumscribe the protein islands. The area of the convex hull was used as an estimate of the area of the cluster. The radius of a circle of same area as the convex hull gave an estimate of the cluster radius. The cluster density was calculated as the density of molecules within the convex hull. The shape of the protein islands was assessed by evaluating the circularity of the islands. The circularity of each protein island was calculated from the ratio of its area to its perimeter (circularity = 4π × area/perimeter2). The circularity value range was [1, 0], with 1 representing a perfect circle and lower values representing greater deviation from a circle. Combining the cluster parameter values of all the protein islands generated statistical distributions of the different cluster parameters, which provided an accurate quantitative description of the heterogeneous BCR organization in the dSTORM composite images. Thus the Hoshen–Kopelman algorithm–based cluster analysis of the superresolution data set provided an objective measure of the physical properties of the heterogeneous ensemble of receptor clusters on the surface of B-cells.
Supplementary Material
Acknowledgments
This work was supported by the Intramural Research Program of the National Institutes of Health, National Institute of Allergy and Infectious Diseases, Eunice Kennedy Shriver National Institute of Child Health and Human Development, and Howard Hughes Medical Institute.
Abbreviations used:
- dSTORM
direct stochastic optical reconstruction microscopy
- FRET
Förster resonance energy transfer
- PLB
planar lipid bilayer
- TIRF
total internal reflection fluorescence.
Footnotes
This article was published online ahead of print in MBoC in Press (http://www.molbiolcell.org/cgi/doi/10.1091/mbc.E16-06-0452) on December 14, 2016.
REFERENCES
- Avalos AM, Bilate AM, Witte MD, Tai AK, He J, Frushicheva MP, Thill PD, Meyer-Wentrup F, Theile CS, Chakraborty AK, et al. Monovalent engagement of the BCR activates ovalbumin-specific transnuclear B-cells. J Exp Med. 2014;211:365–379. doi: 10.1084/jem.20131603. [DOI] [PMC free article] [PubMed] [Google Scholar]
- Batista FD, Iber D, Neuberger MS. B-cells acquire antigen from target cells after synapse formation. Nature. 2001;411:489–494. doi: 10.1038/35078099. [DOI] [PubMed] [Google Scholar]
- Betzig E, Patterson GH, Sougrat R, Lindwasser OW, Olenych S, Bonifacino JS, Davidson MW, Lippincott-Schwartz J, Hess HF. Imaging intracellular fluorescent proteins at nanometer resolution. Science. 2006;313:1642–1645. doi: 10.1126/science.1127344. [DOI] [PubMed] [Google Scholar]
- Davey AM, Liu W, Sohn HW, Brzostowski J, Pierce SK. Understanding the initiation of B-cell signaling through live cell imaging. Methods Enzymol. 2012;506:265–290. doi: 10.1016/B978-0-12-391856-7.00038-X. [DOI] [PMC free article] [PubMed] [Google Scholar]
- Dietrich C, Bagatolli LA, Volovyk ZN, Thompson NL, Levi M, Jacobson K, Gratton E. Lipid rafts reconstituted in model membranes. Biophys J. 2001;80:1417–1428. doi: 10.1016/S0006-3495(01)76114-0. [DOI] [PMC free article] [PubMed] [Google Scholar]
- Engels N, Konig LM, Heemann C, Lutz J, Tsubata T, Griep S, Schrader V, Wienands J. Recruitment of the cytoplasmic adaptor Grb2 to surface IgG and IgE provides antigen receptor-intrinsic costimulation to class-switched B-cells. Nat Immunol. 2009;10:1018–1025. doi: 10.1038/ni.1764. [DOI] [PubMed] [Google Scholar]
- Engels N, Konig LM, Schulze W, Radtke D, Vanshylla K, Lutz J, Winkler TH, Nitschke L, Wienands J. The immunoglobulin tail tyrosine motif upgrades memory-type BCRs by incorporating a Grb2-Btk signalling module. Nat Commun. 2014;5:5456. doi: 10.1038/ncomms6456. [DOI] [PMC free article] [PubMed] [Google Scholar]
- Fleire SJ, Goldman JP, Carrasco YR, Weber M, Bray D, Batista FD. B-cell ligand discrimination through a spreading and contraction response. Science. 2006;312:738–741. doi: 10.1126/science.1123940. [DOI] [PubMed] [Google Scholar]
- Folling J, Bossi M, Bock H, Medda R, Wurm CA, Hein B, Jakobs S, Eggeling C, Hell SW. Fluorescence nanoscopy by ground-state depletion and single-molecule return. Nat Methods. 2008;5:943–945. doi: 10.1038/nmeth.1257. [DOI] [PubMed] [Google Scholar]
- Harwood NE, Batista FD. Early events in B-cell activation. Annu Rev Immunol. 2010;28:185–210. doi: 10.1146/annurev-immunol-030409-101216. [DOI] [PubMed] [Google Scholar]
- Heilemann M, van de Linde S, Schuttpelz M, Kasper R, Seefeldt B, Mukherjee A, Tinnefeld P, Sauer M. Subdiffraction-resolution fluorescence imaging with conventional fluorescent probes. Angew Chem Int Ed Engl. 2008;47:6172–6176. doi: 10.1002/anie.200802376. [DOI] [PubMed] [Google Scholar]
- Hess ST, Girirajan TP, Mason MD. Ultra-high resolution imaging by fluorescence photoactivation localization microscopy. Biophys J. 2006;91:4258–4272. doi: 10.1529/biophysj.106.091116. [DOI] [PMC free article] [PubMed] [Google Scholar]
- Horikawa K, Martin SW, Pogue SL, Silver K, Peng K, Takatsu K, Goodnow CC. Enhancement and suppression of signaling by the conserved tail of IgG memory-type B-cell antigen receptors. J Exp Med. 2007;204:759–769. doi: 10.1084/jem.20061923. [DOI] [PMC free article] [PubMed] [Google Scholar]
- Hoshen J, Kopelman R. Percolation and cluster distribution. I. Cluster multiple labeling technique and critical concentration algorithm. Phys Rev B. 1976;14:3438–3445. [Google Scholar]
- Kechkar A, Nair D, Heilemann M, Choquet D, Sibarita JB. Real-time analysis and visualization for single-molecule based super-resolution microscopy. PLoS One. 2013;8:e62918. doi: 10.1371/journal.pone.0062918. [DOI] [PMC free article] [PubMed] [Google Scholar]
- Kurosaki T, Kometani K, Ise W. Memory B-cells. Nat Rev Immunol. 2015;15:149–159. doi: 10.1038/nri3802. [DOI] [PubMed] [Google Scholar]
- Liu W, Chen E, Zhao XW, Wan ZP, Gao YR, Davey A, Huang E, Zhang L, Crocetti J, Sandoval G, Joyce MG, et al. The scaffolding protein synapse-associated protein 97 is required for enhanced signaling through isotype-switched IgG memory B-cell receptors. Sci Signal. 2012;5:ra54. doi: 10.1126/scisignal.2002820. [DOI] [PMC free article] [PubMed] [Google Scholar]
- Liu W, Meckel T, Tolar P, Sohn HW, Pierce SK. Antigen affinity discrimination is an intrinsic function of the B-cell receptor. J Exp Med. 2010a;207:1095–1111. doi: 10.1084/jem.20092123. [DOI] [PMC free article] [PubMed] [Google Scholar]
- Liu W, Meckel T, Tolar P, Sohn HW, Pierce SK. Intrinsic properties of immunoglobulin IgG1 isotype-switched B-cell receptors promote microclustering and the initiation of signaling. Immunity. 2010b;32:778–789. doi: 10.1016/j.immuni.2010.06.006. [DOI] [PMC free article] [PubMed] [Google Scholar]
- Maity PC, Blount A, Jumaa H, Ronneberger O, Lillemeier BF, Reth M. B-cell antigen receptors of the IgM and IgD classes are clustered in different protein islands that are altered during B-cell activation. Sci Signal. 2015;8:ra93. doi: 10.1126/scisignal.2005887. [DOI] [PubMed] [Google Scholar]
- Mattila PK, Feest C, Depoil D, Treanor B, Montaner B, Otipoby KL, Carter R, Justement LB, Bruckbauer A, Batista FD. The actin and tetraspanin networks organize receptor nanoclusters to regulate B-cell receptor-mediated signaling. Immunity. 2013;38:461–474. doi: 10.1016/j.immuni.2012.11.019. [DOI] [PubMed] [Google Scholar]
- Packard TA, Cambier JC. B lymphocyte antigen receptor signaling: initiation, amplification, and regulation. F1000Prime Rep. 2013;5:40. doi: 10.12703/P5-40. [DOI] [PMC free article] [PubMed] [Google Scholar]
- Pierce S, Liu W. The tipping points in the initiation of B-cell signalling: how small changes make big differences. Nat Rev Immunol. 2010;10:767–777. doi: 10.1038/nri2853. [DOI] [PMC free article] [PubMed] [Google Scholar]
- Reth M. Antigen receptors on B lymphocytes. Annu Rev Immunol. 1992;10:97–121. doi: 10.1146/annurev.iy.10.040192.000525. [DOI] [PubMed] [Google Scholar]
- Rust MJ, Bates M, Zhuang X. Sub-diffraction-limit imaging by stochastic optical reconstruction microscopy (STORM) Nat Methods. 2006;3:793–795. doi: 10.1038/nmeth929. [DOI] [PMC free article] [PubMed] [Google Scholar]
- Sauer M. Localization microscopy coming of age: from concepts to biological impact. J Cell Sci. 2013;126:3505–3513. doi: 10.1242/jcs.123612. [DOI] [PubMed] [Google Scholar]
- Schamel WW, Reth M. Monomeric and oligomeric complexes of the B-cell antigen receptor. Immunity. 2000;13:5–14. doi: 10.1016/s1074-7613(00)00003-0. [DOI] [PubMed] [Google Scholar]
- Sengupta P, Jovanovic-Talisman T, Skoko D, Renz M, Veatch SL, Lippincott-Schwartz J. Probing protein heterogeneity sin the plasma membrane using PALM and pair correlation analysis. Nat Methods. 2011;8:969–975. doi: 10.1038/nmeth.1704. [DOI] [PMC free article] [PubMed] [Google Scholar]
- Sohn HW, Tolar P, Pierce SK. Membrane heterogeneities in the formation of B-cell receptor-Lyn kinase microclusters and the immune synapse. J Cell Biol. 2008;182:367–379. doi: 10.1083/jcb.200802007. [DOI] [PMC free article] [PubMed] [Google Scholar]
- Tarlinton D, Good-Jacobson K. Diversity among memory B-cells: origin, consequences, and utility. Science. 2013;341:1205–1211. doi: 10.1126/science.1241146. [DOI] [PubMed] [Google Scholar]
- Tolar P, Hanna J, Krueger PD, Pierce SK. The constant region of the membrane immunoglobulin mediates B-cell-receptor clustering and signaling in response to membrane antigens. Immunity. 2009;30:44–55. doi: 10.1016/j.immuni.2008.11.007. [DOI] [PMC free article] [PubMed] [Google Scholar]
- Tolar P, Sohn HW, Pierce SK. The initiation of antigen-induced B-cell antigen receptor signaling viewed in living cells by fluorescence resonance energy transfer. Nat Immunol. 2005;6:1168–1176. doi: 10.1038/ni1262. [DOI] [PubMed] [Google Scholar]
- Treanor B, Batista FD. Organisation and dynamics of antigen receptors: implications for lymphocyte signalling. Curr Opin Immunol. 2010;22:299–307. doi: 10.1016/j.coi.2010.03.009. [DOI] [PubMed] [Google Scholar]
- Veatch SL, Machta BB, Shelby SA, Chiang EN, Holowka DA, Baird BA. Correlation functions quantify super-resolution images and estimate apparent clustering due to over-counting. PLoS One. 2012;7:e31457. doi: 10.1371/journal.pone.0031457. [DOI] [PMC free article] [PubMed] [Google Scholar]
- Venkitaraman AR, Williams GT, Dariavach P, Neuberger MS. The B-cell antigen receptor of the five immunoglobulin classes. Nature. 1991;352:777–781. doi: 10.1038/352777a0. [DOI] [PubMed] [Google Scholar]
- Waisman A, Kraus M, Seagal J, Ghosh S, Melamed D, Song J, Sasaki Y, Classen S, Lutz C, Brombacher F, et al. IgG1 B-cell receptor signaling is inhibited by CD22 and promotes the development of B-cells whose survival is less dependent on Ig alpha/beta. J Exp Med. 2007;204:747–758. doi: 10.1084/jem.20062024. [DOI] [PMC free article] [PubMed] [Google Scholar]
- Wakabayashi C, Adachi T, Wienands J, Tsubata T. A distinct signaling pathway used by the IgG-containing B-cell antigen receptor. Science. 2002;298:2392–2395. doi: 10.1126/science.1076963. [DOI] [PubMed] [Google Scholar]
- Yang J, Reth M. Oligomeric organization of the B-cell antigen receptor on resting cells. Nature. 2010;467:465–469. doi: 10.1038/nature09357. [DOI] [PubMed] [Google Scholar]
Associated Data
This section collects any data citations, data availability statements, or supplementary materials included in this article.