

Abstract
Background
Anorexia nervosa (AN) and body dysmorphic disorder (BDD) frequently co-occur, and have several overlapping phenomenological features. Little is known about their shared neurobiology.
Aims
To compare modular organization of brain structural connectivity.
Methods
We acquired diffusion-weighted magnetic resonance imaging data on unmedicated individuals with BDD (n=29), weight-restored AN (n=24), and healthy controls (HC) (n=31). We constructed connectivity matrices using whole-brain white matter tractography, and compared modular structures across groups.
Results
AN showed abnormal modularity involving frontal, basal ganglia, and posterior cingulate nodes. There was a trend in BDD for similar abnormalities, but no significant differences compared with AN. In AN, poor insight correlated with longer path length in right caudal anterior cingulate and right posterior cingulate.
Conclusions
Abnormal network organization patterns in AN, partially shared with BDD, may have implications for understanding integration between reward and habit/ritual formation, as well as conflict monitoring/error detection.
Keywords: connectome, white matter, diffusion tensor imaging, graph theory, anorexia nervosa, body dysmorphic disorder
Introduction
Anorexia nervosa (AN) and body dysmorphic disorder (BDD) are possibly related psychiatric disorders that both involve distorted body image, obsessive thoughts and compulsive behaviors, and poor insight. Individuals with BDD are preoccupied with misperceived defects or flaws related to their physical appearance. In response, they engage in repetitive, compulsive-like behaviors to check, fix, or mentally compare themselves to others (American Psychiatric Association, 2013). Individuals with anorexia nervosa (AN) also experience distorted perception of appearance, mainly related to the conviction of being overweight despite extreme thinness (American Psychiatric Association, 2000). In addition, they experience obsessive thoughts about weight, food, calories, and body shape and size (Perpina et al. 2011; Garcia-Soriano et al. 2014; Belloch et al. 2012; Cooper et al. 2006). AN and BDD both have a peak age of onset during adolescence, and have similar diagnostic comorbidities (Phillips and Kaye 2007; Kollei et al. 2012; Swinbourne and Touyz 2007). AN and BDD often co-occur – 32% of patients with BDD patients report a lifetime eating disorder (Ruffolo 2006), and 25 to 39% of those with AN meet criteria for BDD (Grant et al. 2002; Rabe-Jablonska and Sobow 2000). On the other hand, there are important differences; notably in gender distribution, which is far less skewed toward females in BDD (Buhlmann et al. 2010; Koran et al. 2008; Rief et al. 2006). Specifically, while AN is associated with a gender distribution of 90% females, BDD is associated with approximately equal gender distribution (Rief et al. 2006; Koran et al. 2008; Buhlmann et al. 2010). Another shared phenomenological feature in BDD and AN is poor insight, and, in the extreme form, delusionality. In those with BDD, the distorted nature of their perceptions and beliefs results in typically low insight, with 27–60% holding delusional beliefs (Eisen et al. 2004; Mancuso et al. 2010). Individuals with AN also often have poor insight, and many experience delusionality regarding shape concerns and drive for thinness (Hartmann et al. 2013).
The similarities in phenomenology raise the possibility that AN and BDD may experience partially shared pathophysiological features (Cororve and Gleaves 2001). Three recent studies have compared their neurobiology related to brain activation and connectivity in response to visual stimuli (Li et al. 2015a; Li et al. 2015b; Moody et al. 2015), but none have investigated their brain structural connectome using state-of-the-art analytics of modularity analysis. To explore similarities and differences in brain connectivity, we analyzed whole-brain tractography-derived networks (i.e., structural connectomes) using graph theory, which quantifies complex networks or “graphs” to provide information about their organizational properties. Connectomes in the human brain exhibit “modular” structure; that is, brain regions form communities (“modules”) such that regions in the same module are highly interconnected (but less so among regions in different modules) (Bullmore and Sporns 2009; Bullmore and Bassett 2011). Originally developed for social networks, the Modularity metric Q (Newman and Girvan 2004) quantifies the degree to which a graph may be subdivided into such clearly delineated modules. Our group proposed an alternative formulation that may be advantageous over Q in that it further probes the hierarchical property of a connectome’s modularity (Gadelkarim et al. 2014). The balance between segregation of specialized systems (modules) and their integration is essential for efficient information processing and rapid transfer within and between these specialized systems (Sporns 2010; Das et al. 2014). Previous studies in obsessive-compulsive disorder (OCD), as well as other psychiatric populations such as schizophrenia, have found abnormal patterns of network modularity (Liu et al. 2008; Alexander-Bloch et al. 2010; Lynall et al. 2010; van den Heuvel et al. 2010; Peng et al. 2014), although this has never been tested in AN or BDD. The objective of this first-of-its-kind study was thus to test for abnormal modular connectivity patterns in AN and BDD compared with healthy controls (HCs). We predicted that AN and BDD would demonstrate similar modular abnormalities compared with HC – given the overlapping phenomenological features of distorted body image, obsessive thoughts and compulsive behaviors, and poor insight – which would be additionally associated with their shared clinical symptoms.
Methods
Patient Recruitment
Eighty-four unmedicated individuals, between 13 to 38 years of age, participated: BDD (n=29), weight-restored AN (n=24), and HC (n=31). Recruitment was from local specialized treatment centers, advertisements in the community, the Internet, and campus flyers. The UCLA Institutional Review Board approved the protocol and all participants provided written informed consent.
Clinical evaluations of BDD participants were performed by J.D.F. and of AN participants by S.K. or M.S., all of whom have clinical experience with these populations. We screened for primary or comorbid diagnoses with the Mini-International Neuropsychiatric Interview (MINI v. 6.0) (Sheehan et al. 1998). We administered the Hamilton Anxiety Rating Scale (HAMA) (Hamilton 1959) and the Montgomery-Åsberg Depression Rating Scale (MADRS) (Montgomery and Asberg 1979), which are widely used and well-validated clinician-rated scales for measuring anxiety and depression, respectively. We also administered the Brown Assessment of Beliefs scale (BABS), to measure insight and delusionality, which is a clinician-rated scale that has been tested in BDD and eating disorders populations (Eisen et al. 1998; Steinglass et al. 2007). BDD participants received the BDD version of the Yale–Brown Obsessive–Compulsive Scale (BDD-YBOCS) (Philips et al. 1997), and AN participants received the Eating Disorder Examination (EDE, edition 16.0D) (Fairburn et al. 2008).
All were free from psychoactive medications for 8 weeks prior to entering the study. Exclusion criteria included other concurrent Axis I disorders besides major depressive disorder, dysthymia, panic disorder, social phobia, or generalized anxiety disorder. Comorbid OCD was excluded. Depressive and anxiety disorders are frequently comorbid in these patient populations and thus were not excluded, to achieve a representative sample. All were right-handed, per the Edinburgh Handedness Inventory (Oldfield 1971).
BDD inclusion/exclusion criteria
Individuals were eligible who met DSM-IV criteria for BDD using the BDD Diagnostic Module (Philips et al. 1995) and had a score of ≥20 on the BDD-YBOCS. BDD individuals were excluded if they met past or current criteria for AN or bulimia nervosa.
AN inclusion/exclusion criteria
Individuals with AN were weight-restored; having previously met full DSM-IV criteria for AN. A body mass index (BMI) of ≥18.5 at the time of evaluation was required. We chose to study weight-restored AN individuals to avoid confounds of starvation state on brain activity. Eligible participants otherwise met all criteria currently except amenorrhea for AN on the MINI. AN participants were excluded if they met criteria for past or current comorbid BDD, as evaluated using the BDD Diagnostic Module (Philips et al. 1995).
HC exclusion criteria
HC participants could not meet any criteria for Axis I disorders as determined by the MINI.
Image Acquisition
All brain MRI data were acquired using a Siemens Trio 3T scanner and a 12-channel head coil. Diffusion-weighted images were acquired along 64 gradient directions with b=1000s/mm2 and one minimally diffusion-weighted scan (the b0 image). In addition, high-resolution T1-weighted images were acquired with MPRAGE (Magnetization Prepared Rapid Acquisition Gradient Echo) sequence.
Fiber Tracts Generation
Diffusion weighted images (64 gradient directions) were coregistered onto the b0 images using the automatic image registration (AIR) algorithm (http://bishopw.loni.ucla.edu/air5/). (Further pre-processing details provided in the Online data supplement). We used DTIStudio software (www.mristudio.org) for diffusion tensor calculation and fiber tracking, the latter with the fiber assignment by continuous tractography (FACT) method.
Label maps Generation and Registration
Based on each participant’s high-resolution MPRAGE images, the brain was parcellated into 87 cortical and subcortical structures using FreeSurfer software (Martinos Center for Biomedical Imaging, Charlestown, Massachusetts) (see Online data supplement for region labels). In order to obtain the label map in the diffusion-weighted imaging space, the label map and skull-stripped brain mask in FreeSurfer space were first converted to subject MPRAGE space. The b0 images were then co-registered onto brain mask in MPRAGE space using affine transformation. The inverse of the transformation matrix was applied onto the label map in subject space to obtain the label map in the diffusion-weighted imaging space.
Network Construction
We used the registered labels and fibers to generate network matrices for each participant. For each participant a corresponding tractography-based 87 × 87 brain connectivity matrix (i.e., a “connectome”), weighted by fiber counts, was constructed by defining both the (i, j) and (j, i) components of the matrix to be the number of streamlines (i.e., the computed “fiber tracts”) connecting regions i and j. For details of this procedure please see our previously published studies (Gadelkarim et al. 2014; Leow et al. 2012).
Modularity Metrics
To extract the modular configuration of these connectomes, we used the standard modularity metric Q implemented in the Brain Connectivity Toolbox (http://www.brain-connectivity-toolbox.net) as well as the Path Length Associated Community Estimation technique (PLACE), an in-house developed method for reconstructing hierarchical modularity of brain connectomes using top-down bifurcating trees that has been previously shown to be advantageous when compared to standard modularity (Gadelkarim et al. 2014). In order to extract community structures, at each level, nodes were randomly assigned to one of two communities, and the optimal assignment was determined by maximizing a new metric that measures the difference between the mean inter-modular and the mean intra-modular path lengths using the simulated annealing (SA) algorithm (Gadelkarim et al. 2014). The SA process is repeated at each level until the optimal dendrogram is reached. To quantify node level community differences, we utilized the scaled inclusivity metric V. V quantifies nodal modular abnormality between two networks and ranges from 0 to 1; 0 indicates no modular pattern is shared at this node while 1 indicates a complete match (Gadelkarim et al. 2014). Using the healthy control group as a reference group, we tested for group modular differences using two-sample Hotelling T-squared test, Bonferroni corrected for multiple comparisons. For the nodes found to have abnormal modular patterns relative to HC, we calculated Pearson’s correlation coefficients between disorder symptom severity (BDD-YBOCS for BDD; EDE for AN), anxiety, and degree of insight (BABS) with nodal path length (the principal determinant of modular affiliations under PLACE) and the scaled inclusivity metric V. For comparison, we also computed Q-based modularity, by finding the modular structure that maximizes the Q modularity metric.
Other Network Metrics
Using these weighted tractography-derived networks, we performed additional exploratory analyses of global graph-theoretical metrics including mean clustering coefficient, path length, mean nodal strength, nodal betweenness centrality, and global efficiency. Network segregation was measured by calculating gamma, the normalized clustering coefficient (Creal/Crand). Creal is the clustering coefficient of the actual network and Crand represents clustering coefficient of random networks of equal size and density to the actual network. Network integration was measured by calculating lambda, the normalized path length (Lreal/Lrand). Lreal is the average shortest path length for all node pairs in the network and Lrand is the average shortest path length in a random network of equal size and density. These measures as well as strength, nodal betweenness centrality, and global efficiency were calculated using the Brain Connectivity Toolbox.
Statistical Analyses
All statistical analyses were performed in SPSS (version 22, Somers, NY). Clinical and demographic differences were analyzed using a one-way analysis of variance (ANOVA) for continuous variables and Pearson Chi-Square for categorical variables. ANOVA were used to assess group differences in all global network measures among AN, BDD, and HC. Hotelling’s T-squared test was performed on the community modularity results, Bonferroni corrected for multiple comparisons. Exploratory post hoc correlation analyses between clinical measures and the path length and the scaled inclusivity V were then performed for the regions in the community exhibiting significant group differences, within the significant group. Due to the exploratory nature of these post hoc correlation analyses, they were not further corrected for multiple comparisons.
RESULTS
Demographics and Psychometrics
Demographics and psychometric scores are described in Table 1.
Table 1. Demographics and psychometrics.
Demographics and psychometrics for anorexia nervosa (AN), body dysmorphic disorder (BDD) and healthy control (HC) participants.
| Demographics | Anorexia Nervosa (AN) | Body Dysmorphic Disorder (BDD) | Healthy Control (HC) | Statistical values |
|---|---|---|---|---|
| Total Participants (N) | 24 | 29 | 31 | |
| Gender (F/M) | 23/1 | 25/4 | 25/6 | X2=2.76, p=.25 |
| Age | 21.33±4.54 | 23.17±4.98 | 20.90±3.91 | F=2.11, p=.13 |
| Years of Education | 13.57±3.07 | 14.93±3.43 | 13.53±2.51 | F=1.95, p=.15 |
| EDE Score | 2.89±1.39 | N/A | N/A | |
| AN type (restricting/binge-purging) | 23/1 | N/A | N/A | |
| BDD-YBOCS Score | N/A | 29.38±5.83 | N/A | |
| BABS Score | 10.25±6.92 | 14.86±3.19 | N/A | t=9.39, p=.004 |
| HAMA Score | 8.25±6.67a | 10.79±6.80a | 1.84±1.44b | F=21.72, p<.0001 |
| MADRS Score | 12.42±10.06a | 16.17±7.96b | 1.00±1.61c | F=36.21, p<.0001 |
| BMI | 20.13±1.51a | 21.84±2.79b | 21.99±3.02b | F=4.13, p=.020 |
| Lowest BMI1 | 15.88±1.61 | N/A | N/A | |
| Duration of illness (mo.)2 | 72.17±63.03 | 116.77±69.87 | N/A | t=2.35, p=.023 |
Letter superscripts that are different from each other across each row indicate significant pairwise differences from post hoc t-test at p<.05.
Lowest lifetime BMI from the onset of AN, per self-report. Data not available for 2 participants.
Duration from onset of significant symptoms until the time of the study, per self-report. Data not available for 1 AN and 3 BDD participants.
EDE - Eating Disorder Examination, Edition 16.0D
BDD-YBOCS - Yale Brown Obsessive Compulsive Scale Modified for Body Dysmorphic Disorder
BABS - Brown Assessment of Beliefs Scale
HAMA - Hamilton Anxiety Rating Scale
MADRS - Montgomery–Åsberg Depression Rating Scale
Modularity Results
There were no significant differences in mean total fiber count between groups: 84,584±11,431; 81,769±6,959; and 83,633±7,427 for HC, AN, and BDD groups, respectively (F=.67, p=.52, df=2).
There were no significant group differences in modularity using the standard metric Q. Using PLACE, one module or “community” was significantly different between AN and HC (p<0.01, corrected). The effect size for this significant module was 1.6935, using the Mahalanobis Distance. This community in HC consisted of the right caudate, right pallidum, right accumbens, right caudal anterior cingulate cortex (ACC), right posterior cingulate cortex (PCC), and right rostral ACC. In AN, while this community shared with the HC counterpart inclusion of the right caudate, right accumbens, and right rostral ACC, it excluded the right pallidum, right caudal ACC, and right PCC. Instead, in AN the right lateral orbitofrontal, right medial orbitofrontal, and right frontal pole were included (Table 2; Figures 1, 2, 3). Similarly, the BDD group demonstrated a trend for abnormality in the same module (p=0.051, corrected). While this module in the BDD group was similar to HC in that it included the right caudate, right pallidum, right PCC, and right rostral ACC, it differed from HC in that it excluded the right accumbens. Moreover, differing from HC but similar to AN, it included the right medial orbitofrontal cortex and excluded the right caudal ACC. The direct comparison of AN to BDD, using either BDD or AN as the reference group, revealed no significant differences.
Table 2. Module membership of the module that differed significantly between AN and HC.
Membership of regions within the module that differed significantly between AN and HC. The corresponding module in BDD, although not significant, is shown for reference.
| HC | AN* | BDD† |
|---|---|---|
| Right Caudate | Right Caudate | Right Caudate |
| Right Pallidum | -- | Right Pallidum |
| Right Accumbens Area | Right Accumbens Area | -- |
| Right Rostral ACC | Right Rostral ACC | Right Rostral ACC |
| Right Posterior Cingulate | -- | Right Posterior Cingulate |
| Right Caudal ACC | -- | -- |
| -- | Right Lateral OFC | -- |
| -- | Right Medial OFC | Right Medial OFC |
| -- | Right Frontal Pole | -- |
The AN module differed signficantly from the HC module (p=0.01).
There was a trend for differences between the BDD and the HC module (p=0.051).
There were no significant differences in modular structure between AN and BDD.
Figure 1.

Four-level hierarchical dendrogram representing 16 communities constructured from the mean network of the 31 healthy control (HC) participants (A), 24 anorexia nervosa (AN) participants (B), and 29 body dysmorphic disorder (BDD) participants. The x axis indicates the bifurcation level. “rh” and “lh” stand for right and left hemisphere respectively. The communities shown in the box in the left dendrogram (HC group) significantly differed from the corresponding community in the AN group shown in the box in the right dendrogram (p<0.01, corrected). Although not reaching statistical significance, a similar trend of differences was present (p=0.051) in the BDD group relative to HC; the community exhibiting this trend is shown in the box in (C). This suggests that the BDD group may have a similar, although not identical, abnormality in modular structure. By contrast, a direct post hoc comparison between AN and BDD, controlling for MADRS, showed that the communities highlighted using dashed lines exhibited a significant difference (p=0.0016) between the two patient groups. Interestingly, in the healthy group the corresponding module consisted of exactly the same nodes as in the BDD group.
Figure 2.

Visual representations of the community (highlighted regions) that differed among (A) healthy control (HC), (B) body dysmorphic disorder (BDD), and (C) anorexia nervosa (AN) groups (see also Figure 1). This community significantly differed between the HC (reference) group and the AN group (p<0.01, corrected). In HC this community consisted of the right caudate, right pallidum, right accumbens, right caudal anterior cingulate cortex (ACC), right posterior cingulate cortex (PCC), and right rostral ACC. In AN, this community included the right caudate, right accumbens, right rostral ACC, right lateral orbitofrontal, right medial orbitofrontal, and right frontal pole. The BDD group demonstrated a trend for abnormality in the same module (p=0.051, corrected). The BDD module included the right caudate, right pallidum, right PCC, right rostral ACC, and right medial orbitofrontal cortex. This suggests that BDD may represent an intermediate phenotype between HC and AN in regards to abnormal community structure.
Figure 3.
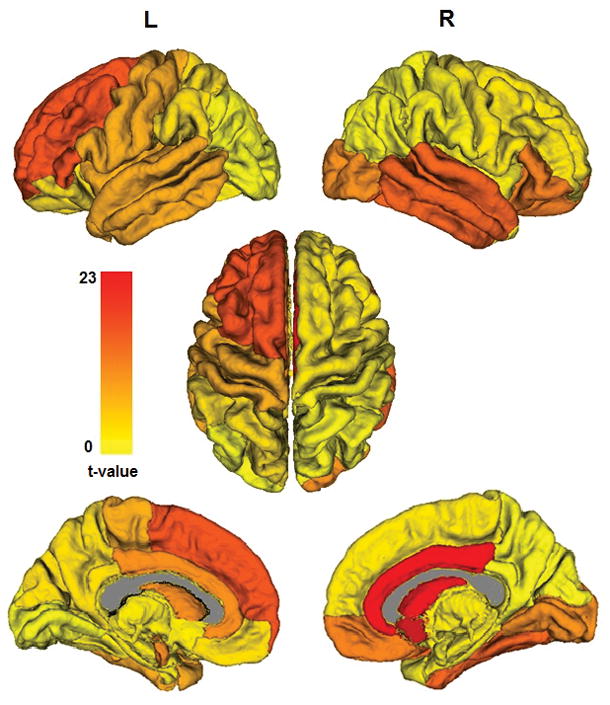
Hotelling’s T-squared statistics comparing community structure of AN relative to HC are overlaid on the 16 communities of the mean healthy control trees, showing the degree of community-level group differences. (Note that as a white matter structure the corpus callosum is depicted in gray, while structures below ventral diencephalon have been removed for better visualization of the subcortical structures-of-interest.) The only significant group differences after multiple comparisons correction is in the community consisting of right caudate, pallidum, nucleus accumbens, rostral and caudal ACC, and posterior cingulate (p<0.01, corrected). (Note in this view the pallidum is entirely obstructed by the thalamus.)
To explore if other co-occurring symptoms in the AN and BDD group such as anxiety or depression contributed to the findings, we conducted post hoc analyses for the AN vs. BDD comparison, controlling for depression and anxiety scores, separately (HAMA and MADRS were highly correlated – r=.85 – thus we chose to control for them separately to avoid collinearity). (This covariate analysis could not be conducted for the comparisons with HC, since the latter group’s HAMA and MADRS scores were very low and had limited range.) Controlling for MADRS, the module formed by the following nodes significantly differed in BDD versus AN (p=0.0016): in BDD, left cerebellar cortex, left hippocampus, left entorhinal cortex, left fusiform cortex, and left parahippocampal gyrus (same as the mean healthy tree for this module (Figure 1)). The same results were obtained when controlling for HAMA, although with a slightly different significance value (p=0.0015). By contrast, in the average AN group tree the corresponding module consists of left cerebellar cortex, brain stem, left entorhinal cortex, left fusiform gyrus, left inferior temporal cortex, and left parahippocampal gyrus.
Other Network Metric Results
The global measure normalized path length (meanL/RandL) was significantly different among 3 groups as determined by one-way ANOVA: df= (2, 81), F=4.74, p=0.011. Post hoc pair-wise comparisons using t-tests showed that normalized path length was longer in AN than HC (p=.038), and longer in AN than BDD (p=.002). Mean and standard deviation for AN, BDD and HC were 1.52±0.16, 1.41±0.09 and 1.43±0.16 respectively (Figure 4A). There were no significant differences among groups in clustering coefficient, mean nodal strength, global efficiency, or nodal betweenness centrality.
Figure 4.
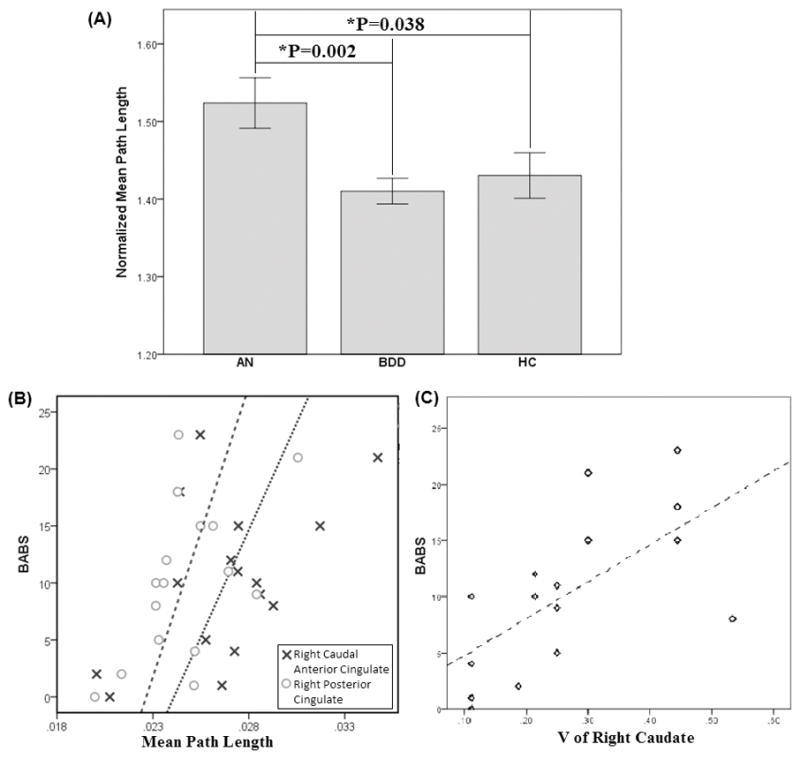
(A) Bar plot of three groups for the Normalized mean path length. Error bars indicate ± one standard error of the mean. (B) Nodal path length versus BABS in anorexia nervosa (AN) group: right caudal anterior cingulate: r=.51, p=.044; right posterior cingulate: r=.53, p=.035. (C) V for right caudate versus BABS in AN group (r=.65, p=.01).
Correlation with Clinical Measures for the Significant Module
Correlation analyses were then performed for the 6 regions (right caudate, right pallidum, right accumbens, right caudal ACC, right PCC, and right rostral ACC) in the community exhibiting significant group differences, between path length and scaled inclusivity V and clinical measures within the AN group. Path length and BABS were significantly correlated in right caudal ACC (r=.51, p=.044) and right PCC (r=.53, p=.035; Figure 4B). Furthermore, V in the right caudate significantly correlated with BABS (r=.65, p=.007; Figure 4C). Exploratory analyses in the BDD group revealed no significant correlations.
Post hoc analyses within the AN group using lowest BMI as a covariate (partial correlations) revealed that the correlations between path length and BABS were no longer significant in the right caudal ACC (r=.42, p=.15) and the right PCC (r=.46, p=.11). In addition, controlling for lowest BMI reduced the significance in the correlation between V in the caudate and BABS to a trend level (r=.55, p=.054).
Post hoc analyses within the AN group using total illness duration as a covariate (partial correlations) reduced the significance of the correlation between BABS and path length in the right caudal ACC (r=.50, p=.056), but the correlation between path length and BABS remained significant in the right PCC (r=.52, p=.045). Controlling for total illness duration, the correlation between V in the caudate and BABS remained significant (r=.67, p=.01).
Correlations with other clinical measures were non-significant.
Discussion
This represents the first connectome study to investigate brain network organization in individuals with AN compared to BDD. Weight-restored individuals with AN exhibit abnormal modular organization, with similar findings in BDD, although to a lesser degree and only at trend significance level. Divergent patterns of abnormal modular organization between AN and BDD are evident only after controlling for depression. In addition, individuals with AN exhibit abnormally long normalized mean path length. Further, in AN, efficiency of information transfer in nodes of the abnormal module relate to the important clinical variable of poor insight.
Modular organization findings
Abnormal modular organization in AN was evident in the form of shifted frontostriatal and fronto-cingulate coupling, systems that are involved in affect, habit formation, and reward (Haber and Knutson 2010). In the AN group, the lateral and medial OFC and frontal pole were included in this module. These patterns of abnormal modular associations appear in systems that are involved in a) reward circuits (nucleus accumbens) (Haber and Knutson 2010); and b) frontostriatal systems, commonly implicated in OCD and theorized to be involved in establishing and maintaining motor and cognitive habits (Menzies et al. 2008). The aberrant module in AN thus may encompass overlapping circuits that, amongst other functions, involve reward and habit/ritual formation (compulsive behaviors). A possible interpretation of such aberrant associations may be related to the clinical observation that in AN reward processing may be abnormally integrated with compulsive behaviors (e.g. experiencing reward from “successfully” carrying out compulsive exercising, restricting, achieving specific weight goals, etc.). This is supported in part by findings in a study of reward processing in recovered AN that found increased ventral striatal activity in response to pleasant taste (Cowdrey et al. 2011), and another study that found increased reactivity in lateral orbitofrontal cortex to food stimuli (Frank et al. 2012).
In the AN group, the right caudal ACC and the right PCC were excluded from this module. These are regions that normally appear in systems involved in error detection and conflict monitoring (dorsal ACC and PCC) (Agam et al. 2010). The pallidum was also excluded in the module in the AN group; a possible effect of this could be reduced voluntary action control over habitual/ritualistic behaviors (Aron 2011; Nambu et al. 2002).
The right caudate was included in the AN group in this module, as it was in the HC module. The role of the dorsal striatum, including the caudate, in reward and decision-making is firmly established (Balleine et al. 2007). The translational implication of the scaled inclusivity metric remains to be further explored in future studies. Nevertheless, we posit that in AN the inclusion of the right caudate in this module may be secondary to sustained and repetitive obsessive thoughts and compulsive behaviors, mediated in part by the caudate and occurring contemporaneously with abnormal neurocircuit activation mediating reward, conflict monitoring/error detection, and goal-directed actions.
In aggregate, the findings in the current study of abnormal modular organization involving these regions may reflect longstanding cognitive, emotional, and behavioral patterns related to how individuals with AN experience reward in relationship to behaviors. Moreover, they may reflect reduced action control over these behaviors, and reduced self-monitoring that would otherwise alert them that their behavioral patterns are pathological and are leading to severe and often life-threatening malnutrition and low weight.
Comparisons of modular structure between AN and BDD
The BDD group showed a similar abnormal module as in AN, although the results did not reach statistical significance. The right caudal ACC (also termed the midcingulate cortex (Vogt 2009) and the right accumbens were absent in BDD from the equivalent module in HC that also includes the caudate, pallidum, posterior and rostral ACC. Thus, the only (trend level) abnormal module in BDD vs. HC was the same as for AN vs. HC. In each clinical group’s comparison to HC there was abnormal inclusion of the medial orbitofrontal cortex as well as abnormal exclusion of the PCC. These observations, and the fact that there was no significant difference between BDD and AN, all lend evidence to the possibility of similar structural network organization in AN and BDD. The lack of statistical significance between BDD and HC may be the result of an insufficient sample size. Although the sample size was the same in AN, there may be smaller magnitude differences in BDD vs. HC and thus we may have been slightly underpowered for that comparison. Alternatively, neural substrates associated with the BDD phenotype may not be completely shared with AN; for example, using fMRI and a face-viewing task, we discovered abnormalities in functional connectivity in visual processing systems in BDD that were not present in AN (Moody et al. 2015).
Differences in modular structure emerged between BDD and AN when controlling for depression severity, which was higher in the BDD group. In AN the left hippocampus, a key limbic lobe region, is less associated with temporal lobe visual processing regions (fusiform cortex and parahippocampal gyrus), suggesting a different pattern of visual-limbic integration in AN relative to BDD. In AN compared with BDD (once the effects of depression are accounted for), this may relate to reduced integration between visual and memory systems, such that current visual input of thin–or even emaciated–appearance is not integrated with prior visual memories of pre-starvation state appearance. This in turn could result in reduced ability to internally “cross-check” with memories of how they used to look, resulting in their progressively thinner appearance not being detected or raising internal “alarms.” It remains to be seen if this interpretation, if true, translates into differences between AN and BDD in perception of self. Additional studies are required to determine whether AN and BDD differ in this respect, as on the phenomenological level there are more apparent similarities than differences in distortion of body image. These results represent the first direct brain network comparison between AN and BDD, to the best of our knowledge, and may have clinical and theoretical implications regarding their shared and distinct neurocircuity and phenotypic abnormalities.
Brain-behavior relationships
We found significant clinical symptom correlations in right cingulate subregions and right caudate. In the AN group, BABS scores positively correlated with nodal path length in right caudal ACC and right PCC. That is, AN individuals with worse insight have longer nodal path length in these regions, which indicates less efficient information transfer with the rest of the brain. The AN group also demonstrated a positive correlation with BABS scores and the degree of modular consistency in the right caudate. Interestingly, AN individuals with lower insight exhibit modularity that is more consistent with that of healthy individuals. There were no significant correlations with EDE or BDD-YBOCS. This suggests that modularity results may therefore not relate linearly to core eating disorder or BDD symptoms, respectively, but instead may relate to the important clinical variable of insight, at least in AN.
In light of the observation of reduced correlation strengths in AN when controlling for lowest BMI, past malnutrition could explain the association between insight and path length in right caudal ACC and PCC, as well as between insight and scaled inclusivity in the caudate. Alternatively, it might partially contribute to these results, as the correlations remain in the same direction. Duration of illness also influenced the correlation, specifically for the right caudal ACC and the PCC. Thus, secondary effects of the illness, which could accumulate over time, could have resulted in the development of a relationship between insight and efficiency of information transfer between the right caudal ACC and the rest of the brain. However, these results do not provide conclusive evidence of causality in one direction or the other, due to the fact that they are cross-sectional. For example, it is possible that these brain-behavior associations may have been preexisting factors contributing to why some individuals developed particularly low BMI, as those with the highest degree of abnormalities may be driven to the most extremes of starvation.
Limitations
There are several limitations of this study that should be considered. One limitation is that results cannot necessarily be generalized to those with acute AN who are not weight-restored. In addition, as with all studies that employ a cross-sectional design, the cause or effect nature of these findings cannot be discerned. Abnormal network organization may be an inherited trait that predisposes to AN (and/or BDD, although findings were at trend level), yet, alternatively, these patterns may have resulted from the illnesses themselves. In the case of AN, this includes the possibility that the observed abnormalities may have resulted from previous states of malnutrition, which may remain as “scars” of the illness. Although we were able to control for the lowest lifetime BMI and total illness duration, information about the duration of time that they were weight-restored was not precisely known for the majority of participants, limiting a more complete investigation into the effects of malnutrition. However it should be noted that PLACE results are independent of any global perturbations, e.g. hypothetical effects on white matter as a whole from malnutrition, as PLACE relies on the pattern of relative associations in structural connectivity among different brain regions. Thus, the main results of this study are mostly insensitive to any non-localized effects of malnutrition that might have persisted into the weight-restored state. However, malnutrition can have both global and regionally-specific effects (Phillipou et al. 2014), so effects of starvation on regional structural connectivity cannot be ruled out. Additionally, we did not perform the EDE in BDD participants or the BDD-YBOCS in AN participants because each scale has not been validated in these populations. This limited our ability to understand each symptom dimension in the respective clinical groups, and how these symptom dimensions relate to connectivity across the whole clinical sample.
As depressive and anxiety disorders are frequently comorbid in AN and BDD, effects of these comorbid disorders in our sample may thus at least partially contribute to our findings. However, it should also be noted that because these comorbidities are so common, and often are secondary to the distress or impairment in important areas of functioning due to the core AN or BDD symptoms, results from a non-comborbid AN or BDD sample would not be as generalizable.
Despite the many advantages of PLACE mentioned above, as a potential limitation of this advanced image analysis techniques we note that (as for any connectome study) PLACE nevertheless is dependent upon the parcellation scheme employed to organize the brain into meaningful modules. Here we employed the commonly utilized Freesurfer-based parcellation scheme, although the potential dependence of our results on confounding factors such as the region size, the basis of parcellation (neuroanatomical versus functional), etc., remains largely unclear.
Future directions
Our results raise several lines of inquiry that would benefit from follow-up in future studies. For one, a similar study design that additionally includes an OCD group (particularly as BDD and OCD are categorized in DSM-5 under Obsessive Compulsive and Related Disorders) will allow for more direct comparison of neural circuitry implicated in this study. AN and BDD share several similar clinical features with OCD that suggest shared or overlapping phenotypes. Individuals with AN often experience obsessive thoughts about their weight, appearance, eating, and exercise, and engage in compulsive behaviors such as checking, counting calories, rituals around food and eating, etc. (see Altman and Shankman 2009 for review). BDD is also characterized by preoccupations or obsessions about their appearance, and such individuals often engage in repetitive and stereotyped behaviors such as mirror-checking, reassurance-seeking from others, or ritualistic grooming behaviors. In addition, the rate of comorbid OCD is approximately 30% in AN and also approximately 30% BDD (see Phillips and Kaye 2007 for review).
Moreover, a multimodal study that also includes task-based fMRI with neurocognitive paradigms to probe reward processing, error detection, conflict monitoring, and self-referential operations will allow for validation and further testing in functional networks of these aforementioned, speculative interpretations. Lastly, the scaled inclusivity metric remains to be further explored in future studies in order to better understand its neurocognitive and neurobehavioral correlates.
Supplementary Material
Acknowledgments
The research was funded by NIMH grant R01MH093535 (Feusner).
Footnotes
Conflict of Interest
The authors declare no conflict of interests.
Research Ethics
The UCLA Institutional Review Board approved the protocol and all participants provided written informed consent.
Author Contributions
A. Zhang contributed to the analysis and interpretation of the data, and drafting the manuscript. A. Leow contributed to the conception and design, analysis and interpretation of the data, and drafting the manuscript.
L. Zhan contributed to the conception and design.
J. GadElkarim contributed to the conception and design.
T. Moody contributed to the analysis and interpretation of the data.
S. Khalsa contributed to the conception and design.
M. Strober contributed to the conception and design.
J.D. Feusner contributed to the conception and design, analysis and interpretation of the data, and drafting the manuscript.
All authors critically revised the manuscript and approved the final version to be published.
References
- Agam Y, Hamalainen MS, Lee AK, Dyckman KA, Friedman JS, Isom M, Makris N, Manoach DS. Multimodal neuroimaging dissociates hemodynamic and electrophysiological correlates of error processing. Proceedings of the National Academy of Sciences. 2010;108:17556–61. doi: 10.1073/pnas.1103475108. [DOI] [PMC free article] [PubMed] [Google Scholar]
- Alexander-Bloch AF, Gogtay N, Meunier D, Birn R, Clasen L, Lalonde F, Lenroot R, Giedd J, Bullmore ET. Disrupted modularity and local connectivity of brain functional networks in childhood-onset schizophrenia. Frontiers in Systems Neuroscience. 2010;4:147. doi: 10.3389/fnsys.2010.00147. [DOI] [PMC free article] [PubMed] [Google Scholar]
- Altman SE, Shankman SA. What is the association between obsessive compulsive disorder and eating disorders? Clinical Psychology Review. 2009;29(7):638–46. doi: 10.1016/j.cpr.2009.08.001. [DOI] [PubMed] [Google Scholar]
- Aron AR. From reactive to proactive and selective control: developing a richer model for stopping inappropriate responses. Biological Psychiatry. 2011;69(12):e55–e68. doi: 10.1016/j.biopsych.2010.07.024. [DOI] [PMC free article] [PubMed] [Google Scholar]
- American Psychiatric Association. Diagnostic and statistical manual of mental disorders. 4. Washington, DC: American Psychiatric Association; 2000. p. xxxvii.p. 943. DSM-IV-TR. [Google Scholar]
- American Psychiatric Association. Diagnostic and statistical manual of mental disorders. 5. Washington, DC: 2013. DSM-5. [Google Scholar]
- Arienzo D, Leow A, Brown JA, Zhan L, Gadelkarim J, Hovav S, Feusner JD. Abnormal brain network organization in body dysmorphic disorder. Neuropsychopharmacology. 2013;38:1130–9. doi: 10.1038/npp.2013.18. [DOI] [PMC free article] [PubMed] [Google Scholar]
- Balleine BW, Delgado MR, Hikosaka O. The role of the dorsal striatum in reward and decision-making. The Journal of neuroscience: the official journal of the Society for Neuroscience. 2007;27:8161–5. doi: 10.1523/JNEUROSCI.1554-07.2007. [DOI] [PMC free article] [PubMed] [Google Scholar]
- Belloch A, Roncero M, Perpina C. Ego-Syntonicity and Ego-Dystonicity Associated with Upsetting Intrusive Cognitions. Journal of Psychopathology and Behavioral Assessment. 2012;34:94–106. [Google Scholar]
- Buhlmann U, Glaesmer H, Mewes R, Fama JM, Wilhelm S, Brahler E, Rief W. Updates on the prevalence of body dysmorphic disorder: a population-based survey. Psychiatry Research. 2010;178:171–5. doi: 10.1016/j.psychres.2009.05.002. [DOI] [PubMed] [Google Scholar]
- Bullmore E, Sporns O. Complex brain networks: graph theoretical analysis of structural and functional systems. Nature Reviews Neuroscience. 2009;10:186–98. doi: 10.1038/nrn2575. [DOI] [PubMed] [Google Scholar]
- Bullmore ET, Bassett DS. Brain Graphs: Graphical Models of the Human Brain Connectome. In: NolenHoeksema S, Cannon TD, Widiger T, editors. Annual Review of Clinical Psychology. Annual Review of Clinical Psychology. 2011:113–40. doi: 10.1146/annurev-clinpsy-040510-143934. [DOI] [PubMed] [Google Scholar]
- Cooper MJ, Todd G, Woolrich R, Somerville K, Wells A. Assessing eating disorder thoughts and behaviors: The development and preliminary evaluation of two questionnaires. Cognitive Therapy and Research. 2006;30:551–70. [Google Scholar]
- Cororve MB, Gleaves DH. Body dysmorphic disorder: a review of conceptualizations, assessment, and treatment strategies. Clinical Psychology Review. 2001;21:949–70. doi: 10.1016/s0272-7358(00)00075-1. [DOI] [PubMed] [Google Scholar]
- Cowdrey FA, Park RJ, Harmer CJ, McCabe C. Increased neural processing of rewarding and aversive food stimuli in recovered anorexia nervosa. Biological Psychiatry. 2011;70:736–43. doi: 10.1016/j.biopsych.2011.05.028. [DOI] [PubMed] [Google Scholar]
- Das TK, Abeyasinghe PM, Crone JS, Sosnowski A, Laureys S, Owen AM, Soddu A. Highlighting the structure-function relationship of the brain with the Ising model and graph theory. BioMed Research International. 2014:237898. doi: 10.1155/2014/237898. [DOI] [PMC free article] [PubMed] [Google Scholar]
- Eisen JL, Phillips KA, Baer L, Beer DA, Atala KD, Rasmussen SA. The Brown Assessment of Beliefs Scale: reliability and validity. American Journal of Psychiatry. 1998;155:102–8. doi: 10.1176/ajp.155.1.102. [DOI] [PubMed] [Google Scholar]
- Eisen JL, Phillips KA, Coles ME, Rasmussen SA. Insight in obsessive compulsive disorder and body dysmorphic disorder. Comprehensive Psychiatry. 2004;45:10–5. doi: 10.1016/j.comppsych.2003.09.010. [DOI] [PMC free article] [PubMed] [Google Scholar]
- Fairburn CG, Cooper Z, MEOC . In: Cognitive Behavior Therapy and Eating Disorders. Fairburn CG, editor. New York: The Guilford Press; 2008. [Google Scholar]
- Frank GK, Reynolds JR, Shott ME, Jappe L, Yang TT, Tregellas JR, O’Reilly RC. Anorexia nervosa and obesity are associated with opposite brain reward response. Neuropsychopharmacology. 2012;37:2031–46. doi: 10.1038/npp.2012.51. [DOI] [PMC free article] [PubMed] [Google Scholar]
- Gadelkarim JJ, Ajilore O, Schonfeld D, Zhan L, Thompson PM, Feusner JD, Kumar A, Altshuler LL, Leow AD. Investigating brain community structure abnormalities in bipolar disorder using path length associated community estimation. Human Brain Mapping. 2014;35:2253–64. doi: 10.1002/hbm.22324. [DOI] [PMC free article] [PubMed] [Google Scholar]
- Garcia-Soriano G, Roncero M, Perpina C, Belloch A. Intrusive Thoughts in Obsessive-Compulsive Disorder and Eating Disorder Patients: A Differential Analysis. European Eating Disorders Review. 2014;22:191–9. doi: 10.1002/erv.2285. [DOI] [PubMed] [Google Scholar]
- Grant JE, Kim SW, Eckert ED. Body dysmorphic disorder in patients with anorexia nervosa: prevalence, clinical features, and delusionality of body image. International Journal of Eating Disorders. 2002;32:291–300. doi: 10.1002/eat.10091. [DOI] [PubMed] [Google Scholar]
- Haber SN, Knutson B. The reward circuit: linking primate anatomy and human imaging. Neuropsychopharmacology. 2010;35:4–26. doi: 10.1038/npp.2009.129. [DOI] [PMC free article] [PubMed] [Google Scholar]
- Hamilton M. The assessment of anxiety states by rating. British Journal of Medical Psychology. 1959;32:50–5. doi: 10.1111/j.2044-8341.1959.tb00467.x. [DOI] [PubMed] [Google Scholar]
- Hartmann AS, Thomas JJ, Wilson AC, Wilhelm S. Insight impairment in body image disorders: Delusionality and overvalued ideas in anorexia nervosa versus body dysmorphic disorder. Psychiatry Research. 2013;210:1129–35. doi: 10.1016/j.psychres.2013.08.010. [DOI] [PubMed] [Google Scholar]
- Kollei I, Brunhoeber S, Rauh E, de Zwaan M, Martin A. Body image, emotions and thought control strategies in body dysmorphic disorder compared to eating disorders and healthy controls. Journal of Psychosomatic Research. 2012;72:321–7. doi: 10.1016/j.jpsychores.2011.12.002. [DOI] [PubMed] [Google Scholar]
- Koran LM, Abujaoude E, Large MD, Serpe RT. The prevalence of body dysmorphic disorder in the United States adult population. CNS Spectrums. 2008;13:316–22. doi: 10.1017/s1092852900016436. [DOI] [PubMed] [Google Scholar]
- Leow A, Ajilore O, Zhan L, Arienzo D, GadElkarim J, Zhang A, Moody T, Van Horn J, Feusner J, Kumar A, Thompson P, Altshuler L. Impaired Inter-Hemispheric Integration in Bipolar Disorder Revealed with Brain Network Analyses. Biological Psychiatry. 2012;73(2):183–93. doi: 10.1016/j.biopsych.2012.09.014. [DOI] [PMC free article] [PubMed] [Google Scholar]
- Li W, Lai TM, Bohon C, Loo SK, McCurdy D, Strober M, Bookheimer S, Feusner J. Anorexia nervosa and body dysmorphic disorder are associated with abnormalities in processing visual information. Psychological Medicine. 2015;45(10):2111–22. doi: 10.1017/S0033291715000045. [DOI] [PMC free article] [PubMed] [Google Scholar]
- Li W, Lai TM, Loo SK, Strober M, Mohammad-Rezazadeh I, Khalsa S, Feusner J. Aberrant early visual neural activity and brain-behavior relationships in anorexia nervosa and body dysmorphic disorder. Frontiers in Human Neuroscience. 2015;9:301. doi: 10.3389/fnhum.2015.00301. [DOI] [PMC free article] [PubMed] [Google Scholar]
- Liu Y, Liang M, Zhou Y, He Y, Hao Y, Song M, Yu C, Liu H, Liu Z, Jiang T. Disrupted small-world networks in schizophrenia. Brain: a journal of neurology. 2008;131:945–61. doi: 10.1093/brain/awn018. [DOI] [PubMed] [Google Scholar]
- Lynall ME, Bassett DS, Kerwin R, McKenna PJ, Kitzbichler M, Muller U, Bullmore E. Functional connectivity and brain networks in schizophrenia. The Journal of neuroscience: the official journal of the Society for Neuroscience. 2010;30:9477–87. doi: 10.1523/JNEUROSCI.0333-10.2010. [DOI] [PMC free article] [PubMed] [Google Scholar]
- Mancuso SG, Knoesen NP, Castle DJ. Delusional versus nondelusional body dysmorphic disorder. Comprehensive Psychiatry. 2010;51:177–82. doi: 10.1016/j.comppsych.2009.05.001. [DOI] [PubMed] [Google Scholar]
- Menzies L, Chamberlain SR, Laird AR, Thelen SM, Sahakian BJ, Bullmore ET. Integrating evidence from neuroimaging and neuropsychological studies of obsessive-compulsive disorder: the orbitofronto-striatal model revisited. Neuroscience & Biobehavioral Reviews. 2008;32:525–49. doi: 10.1016/j.neubiorev.2007.09.005. [DOI] [PMC free article] [PubMed] [Google Scholar]
- Montgomery SA, Asberg M. A new depression scale designed to be sensitive to change. British Journal of Psychiatry. 1979;134:382–9. doi: 10.1192/bjp.134.4.382. [DOI] [PubMed] [Google Scholar]
- Moody TD, Sasaki MA, Bohon C, Strober MA, Bookheimer SY, Sheen CL, Feusner JD. Functional connectivity for face processing in individuals with body dysmorphic disorder and anorexia nervosa. Psychological Medicine. 2015;45:3491–503. doi: 10.1017/S0033291715001397. [DOI] [PMC free article] [PubMed] [Google Scholar]
- Nambu A, Tokuno H, Takada M. Functional significance of the cortico-subthalamo-pallidal “hyperdirect” pathway. Neuroscience Research. 2002;43:111–117. doi: 10.1016/s0168-0102(02)00027-5. [DOI] [PubMed] [Google Scholar]
- Newman MEJ, Girvan M. Finding and evaluating community structure in networks. Physical Review E. 2004:69. doi: 10.1103/PhysRevE.69.026113. [DOI] [PubMed] [Google Scholar]
- Oldfield RC. The assessment and analysis of handedness: the Edinburgh inventory. Neuropsychologia. 1971;9:97–113. doi: 10.1016/0028-3932(71)90067-4. [DOI] [PubMed] [Google Scholar]
- Peng ZW, Shi F, Shi CZ, Yang Q, Chan RCK, Shen DG. Disrupted cortical network as a vulnerability marker for obsessive-compulsive disorder. Brain Structure and Function. 2014;219:1801–12. doi: 10.1007/s00429-013-0602-y. [DOI] [PMC free article] [PubMed] [Google Scholar]
- Perpina C, Roncero M, Belloch A, Sanchez-Reales S. Eating-related intrusive thoughts inventory: exploring the dimensionality of eating disorder symptoms. Psychological Reports. 2011;109:108–26. doi: 10.2466/02.09.13.18.PR0.109.4.108-126. [DOI] [PubMed] [Google Scholar]
- Phillipou A, Rossell SL, Castle DJ. The neurobiology of anorexia nervosa: a systematic review. Australian & New Zealand Journal of Psychiatry. 2014;48(2):128–52. doi: 10.1177/0004867413509693. [DOI] [PubMed] [Google Scholar]
- Phillips KA, Atala KD, Pope HG., Jr Diagnostic Instruments for body dysmorphic disorder. 148th Annual Meeting; 1995; Miami, FL. American Psychiatric Association; 1995. p. 157. [Google Scholar]
- Phillips KA, Hollander E, Rasmussen SA, Aronowitz BR, DeCaria C, Goodman WK. A severity rating scale for body dysmorphic disorder: development, reliability, and validity of a modified version of the Yale-Brown Obsessive Compulsive Scale. Psychopharmacology Bulletin. 1997;33:17–22. [PubMed] [Google Scholar]
- Phillips KA, Kaye WH. The relationship of body dysmorphic disorder and eating disorders to obsessive-compulsive disorder. CNS Spectrums. 2007;12:347–58. doi: 10.1017/s1092852900021155. [DOI] [PubMed] [Google Scholar]
- Rabe-Jablonska Jolanta J, Sobow Tomasz M. The links between body dysmorphic disorder and eating disorders. European Psychiatry. 2000;15:302–5. doi: 10.1016/s0924-9338(00)00398-9. [DOI] [PubMed] [Google Scholar]
- Radua J, Mataix-Cols D. Voxel-wise meta-analysis of grey matter changes in obsessive-compulsive disorder. The British Journal of Psychiatry. 2009;195:393–402. doi: 10.1192/bjp.bp.108.055046. [DOI] [PubMed] [Google Scholar]
- Radua J, van den Heuvel OA, Surguladze S, Mataix-Cols D. Meta-analytical comparison of voxel-based morphometry studies in obsessive-compulsive disorder vs other anxiety disorders. Archives of General Psychiatry. 2010;67:701–11. doi: 10.1001/archgenpsychiatry.2010.70. [DOI] [PubMed] [Google Scholar]
- Rief W, Buhlmann U, Wilhelm S, Borkenhagen A, Brahler E. The prevalence of body dysmorphic disorder: a population-based survey. Psychological Medicine. 2006;36:877–85. doi: 10.1017/S0033291706007264. [DOI] [PubMed] [Google Scholar]
- Ruffolo J, Phillips K, Menard W, Fay C, Weisberg R. Comorbidity of body dysmorphic disorder and eating disorders: severity of psychopathology and body image disturbance. International Journal of Eating Disorders. 2006;39:11–9. doi: 10.1002/eat.20219. [DOI] [PubMed] [Google Scholar]
- Sheehan DV, Lecrubier Y, Sheehan KH, Amorim P, Janavs J, Weiller E, Hergueta T, Baker R, Dunbar GC. The Mini-International Neuropsychiatric Interview (M.I.N.I.): the development and validation of a structured diagnostic psychiatric interview for DSM-IV and ICD-10. The Journal of clinical psychiatry. 1998;59(Suppl 20):22–33. quiz 4–57. [PubMed] [Google Scholar]
- Sporns O. Networks of the Brain. Cambridge, MA: MIT Press; 2010. [Google Scholar]
- Steinglass JE, Eisen JL, Attia E, Mayer L, Walsh BT. Is anorexia nervosa a delusional disorder? An assessment of eating beliefs in anorexia nervosa. Journal of Psychiatric Practice. 2007;13(2):65–71. doi: 10.1097/01.pra.0000265762.79753.88. [DOI] [PubMed] [Google Scholar]
- Swinbourne JM, Touyz SW. The co-morbidity of eating disorders and anxiety disorders: a review. European Eating Disorders Review. 2007;15:253–74. doi: 10.1002/erv.784. [DOI] [PubMed] [Google Scholar]
- van den Heuvel MP, Mandl RC, Stam CJ, Kahn RS, Hulshoff Pol H. Aberrant frontal and temporal complex network structure in schizophrenia: a graph theoretical analysis. The Journal of neuroscience: the official journal of the Society for Neuroscience. 2010;30:15915–26. doi: 10.1523/JNEUROSCI.2874-10.2010. [DOI] [PMC free article] [PubMed] [Google Scholar]
- Vogt B. Regions and subregions of the cingulate gyrus. In: Vogt B, editor. Cingulate Neurobiology and Disease. Oxford: Oxford University Press; 2009. [Google Scholar]
Associated Data
This section collects any data citations, data availability statements, or supplementary materials included in this article.