Abstract
The effect of composite edible films containing soy protein isolate (SPI) in combination with additives like hydroxypropyl methylcellulose (HPMC) and olive oil on ‘Babughosha’ pear (Pyrus communis L.) stored at ambient temperature (28 ± 5 °C and 60 ± 10% RH) was evaluated using Response surface methodology (RSM). A total of 30 edible coating formulations comprising of SPI (2–6%, w/v), olive oil (0.7–1.1%, v/v), HPMC (0.1–0.5%, w/v) and potassium sorbate (0–0.4% w/v) were evaluated for optimizing the most suitable combination. Quality parameters like weight loss%, TSS, pH and titrable acidity of the stored pears were selected as response variables for optimization. The optimization procedure was carried out using RSM. It was observed that the response variables were mainly effected by concentration of SPI and olive oil in the formulation. Edible coating comprising of SPI 5%, HPMC 0.40%, olive oil 1% and potassium sorbate 0.22% was found to be most suitable combination for pear fruit with predicted values of response variables indicated as weight loss% 3.50, pH 3.41, TSS 11.13 and TA% 0.513.
Keywords: Edible coatings, Optimization, Pyrus communis L., Response surface methodology
Introduction
Natural biopolymer-based packaging materials have great potential for enhancing food quality and safety. The unique advantages of the natural biopolymer packaging includes individual packaging of particulate foods, carriers for functionally active substances, and nutritional supplements. Therefore there is growing interest in use of renewable, degradable, and compostable films and coatings from polysaccharide, protein, and lipid biopolymers. Edible coatings are thin layers of material applied to the surface of the fruit or vegetable as an addition to or replacement for the natural protective waxy coating. Traditionally, edible coatings have been used to reduce water loss, but recent development of formulated edible coatings with a wider range of permeability characteristics has extended the potential for fresh produce application. In coating materials, mixtures of lipids, proteins, carbohydrates, plasticizers, surfactants, and additives are dispersed in different kinds of solvents such as water or alcohols. Combining these materials in different ways provides the coating systems with a wide range of functional property values: barrier, appearance, mechanical, etc. The coating’s effectiveness to limit respiration and dehydration of the processed products depends on the gas and water vapour barrier properties of the film. The permeability of hydrophilic films can be affected by factors such as the hydrophilic–hydrophobic nature both of the polymeric matrix and of the added components and by the matrix’s morphology, thickness and homogeneity (Erbil and Muftugil 1986). Khwaldia et al. (2004) noted that addition of lipids to hydrophilic protein-based films by forming a stable emulsion or by laminating the film with a lipid layer, greatly improves its water vapor barrier properties.
The optimization of analytical procedures has been carried out by using multivariate statistic technique amongst which response surface methodology (RSM) is the most popular. RSM is a collection of mathematical and statistical techniques based on the fit of a polynomial equation to the experimental data, which must explain the behavior of a data set and help derive statistical conclusions. The advantages of using RSM are reported to be reduction in the number of experimental runs to evaluate multiple variables and the ability of the statistical tool to identify interactions. RSM has been used to study properties of edible films (Nandane and Jain 2014; Cissé et al. 2012; Zhong and Xia 2008). Zahid et al. (2011) employed RSM to search best conditions of applying edible coating emulsion on guava surface via dipping technique. Malmiri et al. (2011) used RSM to optimize concentrations of chitosan and glycerol for coating Berangan banana.
‘Babughosha’ pear (Pyrus communis L.), is a climacteric fruit with high production of ethylene, increased the rate of softening and sensitivity to the mechanical and physiological defects and dehydration. These characteristics limit the transportation and marketing of the fruits from fields to distant markets. Therefore, there is pressing need for developing post harvest technology for preserving pears. Thus, this study is undertaken to optimize concentration of SPI, HPMC, olive oil and potassium sorbate in edible coating formulations to extend the shelf life of pear fruit.
Materials and methods
Procurement of fruits
Fresh pear (Pyrus communis L. cv. Babughosha) fruits at their uniform stage of development (pre-ripened stage) were brought from the local market in Anand, Gujarat. In the laboratory, the fruits were sorted for uniform size and free from any diseases or infection. They were disinfected by treatment with Sodium Hypochlorite (200 ppm for 10 min) to remove fungal spores and other contaminants from their surface.
Chemicals and reagents
SPI and olive oil used in the experiment were purchased commercially. All other chemicals and solvents were of Himedia (Mumbai, India) and Sigma-Aldrich (MO, USA) procured from local dealers.
Coating preparation
Soy protein isolate, hydroxypropyl methylcellulose, olive oil and potassium sorbate in predetermined quantities (Table 1) were dispersed in distilled water. Glycerol (0.7%) was added as plasticizer to each solution. The solutions were then heated with constant stirring at 80–85 °C temperature for 15 min.
Table 1.
The central composite experimental design employed for formulation of edible coating composition
| Sr. no. | Point type | SPI concentration (%) (A) | HPMC concentration (%) (B) | Olive oil concentration (%) (C) | Potassium sorbate concentration (%) (D) |
|---|---|---|---|---|---|
| 1 | Center | 4 | 0.3 | 0.9 | 0.2 |
| 2 | Center | 4 | 0.3 | 0.9 | 0.2 |
| 3 | Factorial | 3 | 0.2 | 0.8 | 0.3 |
| 4 | Factorial | 5 | 0.2 | 1.0 | 0.3 |
| 5 | Factorial | 5 | 0.2 | 0.8 | 0.1 |
| 6 | Factorial | 3 | 0.4 | 1.0 | 0.3 |
| 7 | Factorial | 3 | 0.2 | 1.0 | 0.1 |
| 8 | Factorial | 5 | 0.4 | 1.0 | 0.1 |
| 9 | Factorial | 3 | 0.4 | 0.8 | 0.1 |
| 10 | Factorial | 5 | 0.4 | 0.8 | 0.3 |
| 11 | Center | 4 | 0.3 | 0.9 | 0.2 |
| 12 | Center | 4 | 0.3 | 0.9 | 0.2 |
| 13 | Factorial | 3 | 0.2 | 0.8 | 0.1 |
| 14 | Factorial | 3 | 0.4 | 1.0 | 0.1 |
| 15 | Factorial | 3 | 0.4 | 0.8 | 0.3 |
| 16 | Factorial | 5 | 0.2 | 1.0 | 0.1 |
| 17 | Factorial | 3 | 0.2 | 1.0 | 0.3 |
| 18 | Factorial | 5 | 0.2 | 0.8 | 0.3 |
| 19 | Factorial | 5 | 0.4 | 1.0 | 0.3 |
| 20 | Factorial | 5 | 0.4 | 0.8 | 0.1 |
| 21 | Center | 4 | 0.3 | 0.9 | 0.2 |
| 22 | Center | 4 | 0.3 | 0.9 | 0.2 |
| 23 | Axial | 2 | 0.3 | 0.9 | 0.2 |
| 24 | Axial | 4 | 0.5 | 0.9 | 0.2 |
| 25 | Axial | 4 | 0.3 | 0.9 | 0 |
| 26 | Axial | 4 | 0.3 | 0.9 | 0.4 |
| 27 | Axial | 6 | 0.3 | 0.9 | 0.2 |
| 28 | Axial | 4 | 0.1 | 0.9 | 0.2 |
| 29 | Axial | 4 | 0.3 | 1.1 | 0.2 |
| 30 | Axial | 4 | 0.3 | 0.7 | 0.2 |
Coating application
Coating treatments were applied as designed using RSM (Table 1). Samples treated with only distilled water were considered as control. Coatings were applied to the fruit surface by dipping technique, with dipping time of two minutes. The coated pears were packed in plastic boxes and stored at ambient temperature (28 ± 5 °C and 60 ± 10% RH).
The weight loss, pH, TSS and Titrable acidity (TA) of coated and control samples were evaluated after 5 days of storage, when the control pear fruits showed excessive ripening.
Analytical methods
Weight loss percentage: The difference between the initial and final weight of the fruit was considered as total weight loss and the results were expressed as the percentage loss of the initial weight as per the standard method of AOAC (2000).
Total soluble solids (TSS), pH and titratable acidity (TA): 4 grams of fruit sample was homogenized with 40 ml distilled water and the filterate was used to determine total soluble solids (TSS), pH and titratable acidity (TA). TSS content (degree Brix) of the fruit was determined using digital refractrometer (Atago Co., Tokyo, Japan). The reading obtained was multiplied by dilution factor of 10 to obtain the real °Brix. The pH of the fruit samples was assessed using a digital pH meter (Model: Elico, LI 120) according to the standard method described in AOAC (2000). TA was determined according to the method of Mazumdar and Majumder (2003).
Experimental design and statistical analysis
Response surface methodology (RSM) was used to generate the experimental designs, statistical analysis and regression model with the help of Design Expert Software Version 8 (Statease Inc., MN, USA). The Central Composite Rotatable Design (CCRD) with a quadratic model (Box and Draper 1987) was employed. Each independent variable had 3 levels, −1, 0 and +1 (Table 2). Six replicates of the centre point were chosen in random order according to a CCRD configuration for three factors divided in three blocks (Cochran and Cox 1957). The α-values in the design outside the ranges were selected for rotatability of the design (Thompson et al. 1982). The centre points for these designs were selected with ingredients at levels expected to yield satisfactory experimental results. A total of 30 edible coating formulations comprising of SPI (2–6%, w/v), olive oil (0.7–1.1%, v/v), HPMC (0.1–0.5%, w/v) and potassium sorbate (0–0.4% w/v) were designed. The responses function (y) measured were Weight Loss Percentage, pH, Total Soluble Solids and Titrable Acidity of coated samples. The response variable values are related to the coded variables (xi, i = 1, 2 and 3) by a second degree polynomial using the equation below.
Table 2.
Levels of independent variables used in the center composite design (CCD)
| Independent variables | Levels | ||
|---|---|---|---|
| Low (−1) |
Centre (0) |
High (+1) |
|
| SPI (% w/v) | 3 | 4 | 5 |
| HPMC (% w/v) | 0.2 | 0.3 | 0.4 |
| Olive oil (% v/v) | 0.8 | 0.9 | 1.0 |
| Potassium sorbate (% w/v) | 0.1 | 0.2 | 0.3 |
The coefficients of the polynomial were represented by b0 (constant term), b1, b2 and b3 (linear effects), b11, b22 and b33 (quadratic effects), and b12, b13 and b23 (interaction effects).
The analysis of variance (ANOVA) tables were generated and the effect and regression coefficients of individual linear, quadratic and interaction terms determined. The significances of all terms in the polynomial were judged statistically by computing the F-value and compared with standard significance level of 0.1, 1 and 5%. The adequacy of the model was determined using regression coefficient (R2) analysis. The experimental design and data analysis were performed using Design Expert Software Version 8 (Statease Inc., MN, USA).
Verification and optimization procedures
Numerical and graphical optimization procedures were applied to determine the optimum level of the independent variables. The optimization procedures was carried out using Design Expert Software Version 8 (Statease Inc., MN, USA).
Results and discussion
Effect of edible coating on weight loss% of coated pear fruit
García et al. (1998) observed that the edible film applied on the surface of the fruit delayed migration of moisture from the fruit into the environment, thus reducing weight loss during storage. Such edible films are usually based on hydrophobic substances such as lipids to improve barrier efficiency (Morillon et al. 2002). The Regression Coefficient table for RSM analysis with weight loss% as response variable is shown in Table 3.
Table 3.
Regression coefficients, R2 and p or probability values for four dependant variables
| Regression coefficient | Weight loss (%) | pH | Total soluble solids (°Bx) | Titratable acidity (%) |
|---|---|---|---|---|
| A-SPI | −0.21375* | −0.05792* | −0.24583 | 0.05375* |
| B-HPMC | 0.085417* | −0.10931* | −0.82917* | 0.080417* |
| C-Olive oil | −0.82875 | 0.014028 | 0.004167 | −0.00542 |
| D-Pot. sorbate | 0.040417 | 0.00125 | −0.0375 | 0.00375 |
| AB | 0.016875 | 0.003125 | 0.06875 | 0.038125* |
| AC | 0.121875*** | −0.00812 | −0.08125 | 0.006875 |
| AD | −0.03938 | −0.00062 | −0.05625 | 0.005625 |
| BC | 0.058125 | −0.01396 | −0.03125 | 0.014375 |
| BD | 0.016875 | 0.002708 | 0.01875 | 0.010625 |
| CD | −0.03563 | 0.004792 | 0.01875 | −0.01063 |
| A2 | −0.01031 | 0.002118 | −0.15313 | 0.004688 |
| B2 | 0.032188 | 0.045868* | 0.021875 | 0.002188 |
| C2 | 0.233438* | −0.02955*** | 0.021875 | 0.039688* |
| D2 | 0.088438*** | −0.00122 | 0.009375 | −0.01281 |
| Mean | 4.28 | 3.58 | 12.29 | 0.30 |
| R2 | 0.9593 | 0.8668 | 0.7401 | 0.9297 |
| Model F value | 21.91 | 6.04 | 2.64 | 12.28 |
* Significant at 0.01 level
** Significant at 0.05 level
*** Significant at 0.1 level
The Model F-value of 21.91 obtained for effect on weight loss% of treated pear fruit implies that this model is significant. There is only a 0.01% chance that a “Model F-Value” so high could be due to noise. Values of “Prob >F” less than 0.0500 indicates significance of the model terms. In this case A, C, C2 are significant model terms. Thus, weight loss% is effected by concentrations of SPI and olive oil and also by quadratic effect of olive oil concentration. Values greater than 0.1 indicate the model terms are not significant. The “Lack of Fit F-value” of 1.96 implies the Lack of Fit is not significant relative to the pure error. Non-significant lack of fit is good because we want the model to fit. There is a 31.57% chance that a “Lack of Fit F-value” this large could occur due to noise. “Adeq Precision” measures the signal to noise ratio. A ratio greater than 4 is desirable. So, the ratio of 17.337 indicates an adequate signal. Hence, this model can be used to navigate the design space.
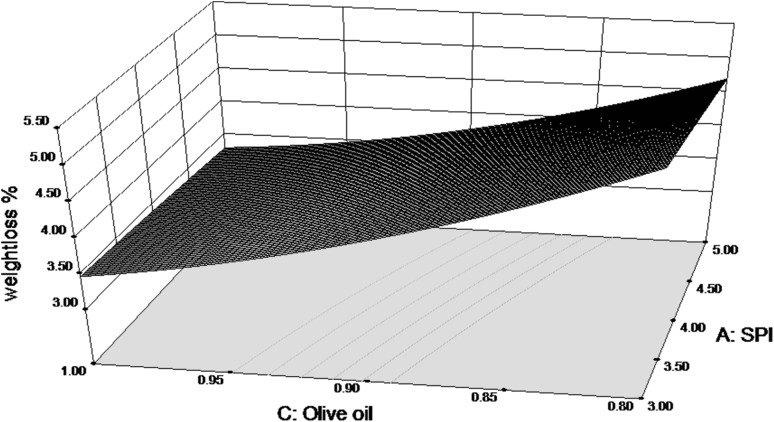
Observations from RSM analysis suggested that the weight loss% is negatively related to the concentration of olive oil used (Fig. 1). Thus, as the concentration of olive oil in the solution increases, there is a relative decrease in weight loss of the fruit. This shows that the lipid component plays an important role in reducing the water loss from the fruit and thus reducing its weight loss. Similarly, concentration of SPI is also negatively related to the weight loss%. Nandane and Jain (2014) have demonstrated that addition of SPI increases tensile strength and thickness of edible films. Thus, SPI forms a stable film on the fruit surface and hence may help reduce the moisture loss. Lim et al. (2011) and Amal et al. (2010) obtained similar results for sweet cherries and strawberries coated with edible films containing SPI. The final equation in terms of actual factors for weight loss% is as follows.
| 1 |
Fig. 1.
Response surface for weight loss % of coated pears as function of SPI and olive oil concentration
Effect of edible coating on pH of coated pear fruit
Hernandez-Munoz et al. (2008) observed that organic acids provide most of the hydrogen ions contributing to lower pH in unripe fruits. This normally decreases with ripening, producing an increase in pH. In contrast, an effective coating would retain lower pH in the fruit.
The Regression Coefficient table for RSM analysis of pH as response variable is as shown in Table 3. The Model F-value of 6.04 implies the model is significant. The value of pH seems to be influenced by the concentration of SPI and that of HPMC. The quadratic effect of HPMC concentration also seems to influence the pH of pear.
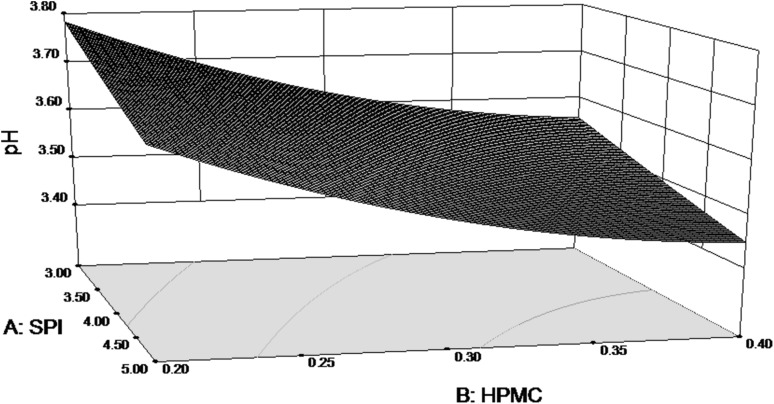
From Fig. 2, it can be seen that both SPI and HPMC have an effect on pH of the coated fruits. As SPI concentration increased, the pH is lowered. Similarly, pH is significantly reduced when HPMC concentration is increased. The final equation in terms of actual factors for pH is as follows:
| 2 |
Fig. 2.
Response surface for pH of coated pears as function of SPI and HPMC concentration
Effect of edible coating on TSS of coated pear fruit
Soluble solids and organic acids of fruits are substrates that are consumed by respiration during storage (Yaman and Bayoindirli 2002). Changes in TSS contents is a natural phenomenon occurring during ripening and is correlated with hydrolytic changes in starch concentration during ripening and storage. Edible coatings help in retarding the ripening process as indicated by lower level of TSS in treated samples.
The Regression Coefficient table for RSM analysis of TSS as response variable and its related Values of average Mean and R-Squared value are show in Table 3. The Model F-value of 2.64 implies the model is significant. TSS value was effected only by the concentration of HPMC in the coating formulation.
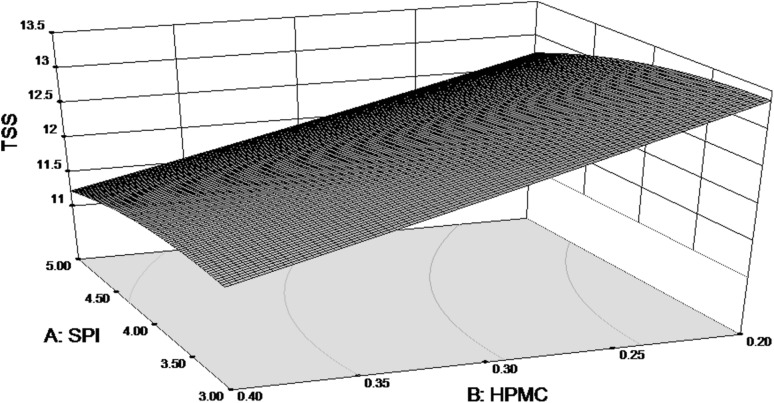
In Fig. 3, the response surface graph shows that TSS value is significantly decreased as HPMC concentration in coating solution increased. Similar results are obtained in relation to SPI concentration but the changes are not so significant. Rohani et al. (1997) summarised that the slower respiration slows down conversion of carbohydrates to sugar resulting in reduced synthesis and use of metabolites thus lowering the TSS of coated samples. The final equation in terms of actual factors for TSS is as follows:
| 3 |
Fig. 3.
Response surface for TSS of coated pears as function of SPI and HPMC concentration
Effect of edible coating on titrable acidity of coated pear fruit
In general, fruit acidity tends to decrease with maturation and there is concomitant increase in sugar content (Raffo et al. 2002). Bhattarai and Gautam (2006) reported that during storage the fruit itself might utilize acids and hence the acid content in fruit decreases with prolonged storage. The Regression Coefficient table for RSM analysis for Titrable Acidity as response variable is shown in Table 3. The Model F-value of 12.28 implies the model is significant. In this case, the value of titrable acidity was influenced by concentrations of SPI and HPMC. It was also effected by interaction of SPI and HPMC concentration and quadratic effect of olive oil concentration.
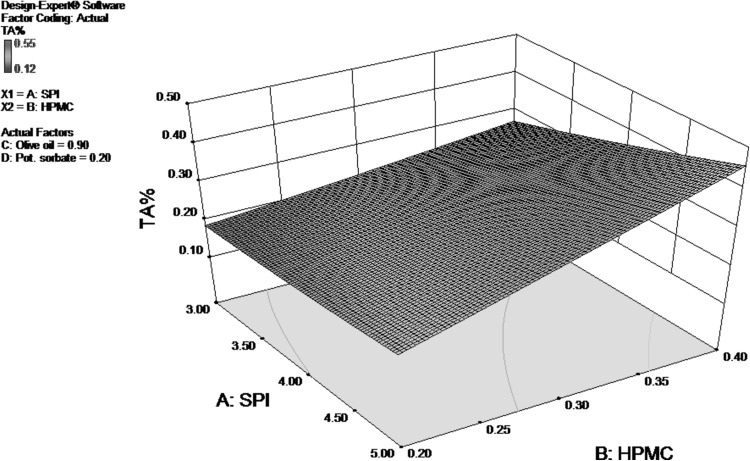
As seen from Fig. 4, TA value is positively related to HPMC as well as SPI concentration. However, increase in acidity value is more significantly related to HPMC concentration. Coatings reduce the respiration rate of the fruits and therefore delay the utilization of organic acids (Yaman and Bayoindirli 2002). The higher value of TA indicates more organic acid content in fruit, suggesting a slower respiration rate. The final equation in terms of actual factors for TA is as follows:
| 4 |
Fig. 4.
Response surface for TA % of coated pears as function of SPI and HPMC concentration
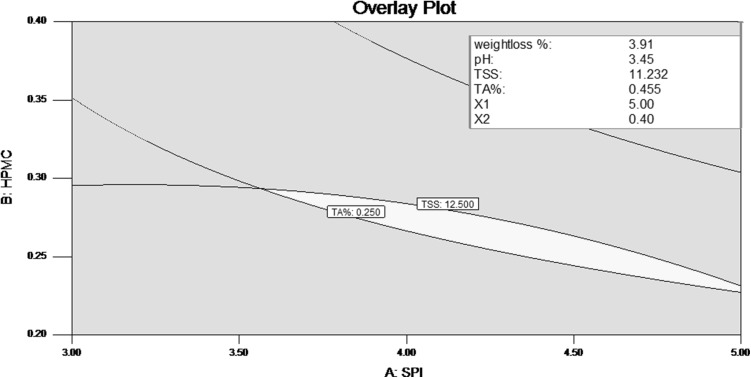
Since the optimum response for each dependent variable did not fall exactly in the same region, the superimposition of all the contour plots obtained was done. Figure 5 shows the superimposed contour plot for optimization of concentrations of SPI, HPMC, olive oil and potassium sorbate. The best combination with highest desirability was given as SPI 5%, HPMC 0.40%, olive oil 1% and potassium sorbate 0.22%. The predicted values of response variables, for this combination of edible coating, as calculated from formulas were: weight loss% 3.50, pH 3.41, TSS 11.13 and TA% 0.513.
Fig. 5.
Superimposed Contour plot for weight loss percent, pH, TSS and titratable acidity at optimized combination
Conclusion
A second-order polynomial model for coated ‘Babughosha’ pear fruit was generated from statistically designed laboratory experiments using RSM. Concentrations of SPI, HPMC, olive oil and potassium sorbate were the independent variables, while weight loss%, TSS, pH and titrable acidity were response variables. Use of olive oil helped to reduce the weight loss in pear fruit, whereas all other parameters were mainly effected by HPMC and SPI concentration. According to this study SPI 5%, HPMC 0.40%, olive oil 1% and potassium sorbate 0.22% appeared to be the optimum coating formulation for improving the postharvest quality of pear fruit. Thus, RSM could be effectively used to optimize edible coating formulations leading to overall enhancement of quality and shelf-life of pear fruit.
Acknowledgments
The authors are thankful to Ministry of Food Processing Industries (MOFPI-DST/SERB) for providing financial assistance under the Research Project (SERB/MOFPI/0020/2012). The authors are also thankful to the Head, B. R. Doshi School of Biosciences, Sardar Patel University for providing necessary facilities for carrying out this research work.
References
- Amal S, Atress MM, El-Mogy HE, Aboul-Anean BW. Improving strawberry fruit storability by edible coating as a carrier of thymol or calcium chloride. J Food Sci Technol. 2010;2(3):88–97. [Google Scholar]
- AOAC . Official methods of analysis of the association of the official analysis chemists. 17. Washington, DC: Association of Official Agricultural Chemists; 2000. [Google Scholar]
- Bhattarai DR, Gautam DM. Effect of harvesting method and calcium on post harvest physiology of tomato. Nepal Agric Res J. 2006;7:37–41. [Google Scholar]
- Box GE, Draper NR. Empirical model-building and response surfaces. New York: Wiley; 1987. [Google Scholar]
- Cissé M, Montet D, Loiseau G, Ducamp-Collin MN. Influence of the concentrations of chitosan and glycerol on edible film properties showed by response surface methodology. J Polym Environ. 2012;20(3):830–837. doi: 10.1007/s10924-012-0437-2. [DOI] [Google Scholar]
- Cochran WG, Cox GM. Experimental designs. 2. New York: Wiley; 1957. Some methods for the study of response surfaces; pp. 335–375. [Google Scholar]
- Erbil HY, Muftugil N. Lengthening the postharvest life of peaches by coating with hydrophobic emulsions. J Food Process Preserv. 1986;10(4):269–279. doi: 10.1111/j.1745-4549.1986.tb00025.x. [DOI] [Google Scholar]
- García MA, Martino MN, Zaritzky NE. Plasticized starch-based coatings to improve strawberry (Fragaria Ananassa) quality and stability. J Agric Food Chem. 1998;46:3758–3767. doi: 10.1021/jf980014c. [DOI] [Google Scholar]
- Hernandez-Munoz P, Almenar E, Valle VD, Velez D, Gavara R. Effect of chitosan coating combined with postharvest calcium treatment on strawberry (Fragaria ananassa) quality during refrigerated storage. Food Chem. 2008;110(2):428–435. doi: 10.1016/j.foodchem.2008.02.020. [DOI] [PubMed] [Google Scholar]
- Khwaldia K, Perez C, Banon S, Desobry S, Hardy J. Milk proteins for edible films and coatings. Crit Rev Food Sci Nutr. 2004;44(4):239–251. doi: 10.1080/10408690490464906. [DOI] [PubMed] [Google Scholar]
- Lim R, Stathopoulos CE, Golding JB. Effect of edible coatings on some quality characteristics of sweet cherries. Int Food Res J. 2011;18(4):1237–1241. [Google Scholar]
- Malmiri HJ, Osman A, Tan CP, Abdul R. Development of an edible coating based on chitosan-glycerol to delay ‘Berangan’banana (Musa sapientum cv. Berangan) ripening process. Int Food Res J. 2011;18(3):989–997. [Google Scholar]
- Mazumdar BC, Majumder K. Methods on physico-chemical analysis of fruit. Delhi: Daya Publishing House; 2003. pp. 112–115. [Google Scholar]
- Morillon V, Debeaufort F, Blond G, Capelle M, Voilley A. Factors affecting the moisture permeability of lipid-based edible films: a review. Crit Rev Food Sci Nutr. 2002;42(1):67–89. doi: 10.1080/10408690290825466. [DOI] [PubMed] [Google Scholar]
- Nandane AS, Jain R. Study of mechanical properties of soy protein based edible film as affected by its composition and process parameters by using RSM. J Food Sci Technol. 2014 doi: 10.1007/s13197-014-1417-4. [DOI] [PMC free article] [PubMed] [Google Scholar]
- Raffo A, Leonardi C, Fogliano V, Ambrosino P, Salucci M, Gennaro L, Quaglia G. Nutritional value of cherry tomatoes (Lycopersicon esculentum cv. Naomi F1) harvested at different ripening stages. J Agric Food Chem. 2002;50(22):6550–6556. doi: 10.1021/jf020315t. [DOI] [PubMed] [Google Scholar]
- Rohani MY, Zaipun MZ, Norhayati M. Effect of modified atmosphere on the storage life and quality of Eksotika papaya. J Trop Agric Food Sci. 1997;25(1):103–114. [Google Scholar]
- Thompson JF, Warsi ZU, Wayne Mastin C. Boundary-fitted coordinate systems for numerical solution of partial differential equations—a review. J Comput Phys. 1982;47(1):1–108. doi: 10.1016/0021-9991(82)90066-3. [DOI] [Google Scholar]
- Yaman Ö, Bayoιndιrlι L. Effects of an edible coating and cold storage on shelf-life and quality of cherries. LWT Food Sci Technol. 2002;35(2):146–150. doi: 10.1006/fstl.2001.0827. [DOI] [Google Scholar]
- Zahid AM, Cheow CS, Norizzah AR, Halimahton MS, Adi MS, Noorakmar AW and Ruzaina I (2011). Optimization of process conditions for the application of edible coating emulsion on guava (Psidium guajava) using response surface methodology. In: Proceedings of International Conference on Biotechnology and Food Science (IPCBEE) pp 61–65
- Zhong QP, Xia WS. Physicochemical properties of edible and preservative films 329 from chitosan/cassava starch/gelatin blend plasticized with glycerol. Food Technol Biotechnol. 2008;46(3):262–269. [Google Scholar]


