Abstract
MicroRNAs (miRNAs) are post-transcriptional regulators of gene expression that are implicated in a number of disease states. MiRNAs can exist as individual entities, or may be clustered and transcribed as a single polycistron. The mirn23a cluster consists of three miRNAs, miR-23a, miR-24-2, and miR-27a. While these miRNAs are transcribed together, they often exist at varying levels in the cell. Despite the fact that the mirn23a cluster is known to play a role in a number of diseases and developmental processes, few direct targets have been identified. In this study, we examined the effects of miR-23a, miR-24-2, miR-27a, or the mirn23a cluster overexpression on the proteome of 70Z/3 pre-B lymphoblast cells. Quantitative mass spectrometry using isobaric tags for relative and absolute quantification (iTRAQ) allowed for global profiling of cell lines after miRNA overexpression. We identified a number of targets of each miRNA that contained predicted miRNA seed sequences and are likely direct targets. In addition, we discovered a cohort of shared miRNA targets and cluster targets, demonstrating the importance of studying miRNA clusters in their entirety.
Keywords: microRNA, cluster, iTRAQ, miR-23a, miR-24, miR-27a
Graphical abstract
Introduction
MicroRNAs (miRNAs) are small, endogenous, non-coding RNAs that belong to a large family of post-transcriptional regulators of gene expression1,2. MiRNAs are known to decrease gene expression through destabilization or degradation of target mRNA transcripts, though rare instances of gene up-regulation have been reported3,4,5. The “seed sequence” of the miRNA (nucleotides 2-8 of the mature miRNA) binds to 6-8 nucleotides in the 3’ untranslated region (UTR) of a target mRNA molecule, resulting in its translational inhibition or transcript degradation6,7,8. Cellular roles are thought to vary from minimizing protein expression level variability to substantially decreasing expression levels9. Due to the relatively promiscuous seed matching requirements of miRNAs, they are predicted to regulate over 60% of protein coding genes in mammals10.
Multiple miRNAs often reside in clusters located in close proximity on the chromosome. Clustered miRNAs are found within 10 kb of each other, and are usually transcribed as a single polycistron with similar abundances11,12. MiRNAs that exist in clusters may possess seed sequence homology and have redundant functions. For example, the Mirc19 cluster is comprised of miR-212 and miR-132, which together target the transcription factor FOXO3 to regulate hematopoietic stem cell maintenance13. However, clustered miRNAs often have unique seed sequences, and their biological function is less clear. The miR-17-92 cluster contains six distinct miRNAs that are highly expressed in many types of cancer. Previous studies indicate certain members of the cluster negatively regulate angiogenesis, while others promote blood vessel formation, demonstrating the complex nature of these clusters14.
The mirn23a cluster consists of three distinct members: miR-23a, miR-27a, and miR-24-2. The mature miRNAs are derived from a single pri-miRNA transcript, but often exhibit variable expression levels in the cell15. In addition to mirn23a, a paralogous mirn23b cluster comprised of miR-23b, miR-27b, and miR-24-1 exists in mammals. The mature sequences of miR-23a/b and miR-27a/b differ by a single nucleotide outside of their seed sequences, while miR-24-1 and miR-24-2 are identical. The two paralogous clusters reside on different chromosomes and are transcribed independently, and it is likely they undergo different mechanisms of regulation. The biological functions of the mirn23a cluster have been shown to play a role in a wide variety of processes, including hematopoietic development16,17,18, apoptosis19,20, drug resistance21, tumor suppression22, and oncogenesis23,24,25,26. Functional studies been performed to show that overexpression of miR-23a, miR-24-2, or miR-27a individually lead to entirely different phenotypic results than the entire mir23a cluster, demonstrating the importance of studying the cluster in its entirety27. In addition, studies in our group of the miR-143/145 cluster found that certain genes are repressed only when all members of the cluster were present, indicating clustered miRNAs can work in a synergistic fashion28. The non-random distribution of clustered miRNAs suggests an evolutionarily conserved pattern, and thus it is imperative to study both the individual and combined functions of clustered miRNAs to discern their physiological roles.
Traditionally, miRNA targets have been studied through bioinformatic predictions and transcriptome analysis. A number of predictive algorithms have been created that weigh miRNA seed matching, free energy of binding, evolutionary conservation, and other parameters to determine miRNA targets29. Bioinformatic analyses are hindered by sequence differences in annotated 3’ UTRs, as well as transcript variants among different cell types. They often predict thousands of target transcripts that are not confirmed to be physiologically relevant. Microarray analysis of mRNA levels after overexpression or knockdown of miRNAs reveals hundreds of transcripts with subtly changed expression, but overlooks mRNAs that are translationally inhibited without degradation30. Mass spectrometry-based proteomics has become an established method to identify protein changes, which are the ultimate consequences of miRNA manipulation31,32,33. The addition of isobaric tags for relative and absolute quantification (iTRAQ) allows for proteomic quantification by mass spectrometry.
In this study we performed global quantitative mass spectrometry to determine the protein targets of miR-23a, miR-27a, and miR-24-2 individually and as an intact cluster. Using iTRAQ labeling and UPLC-MS/MS we detected between 60-160 proteins downregulated by each miRNA. We also found a number of proteins that only showed significant downregulation when the entire mirn23a cluster was expressed in concert.
Our results support previous findings that miRNA clusters work synergistically to target genes that are not repressed by any of the individual miRNAs, and highlight the importance of studying miRNA clusters in their entirety.
Materials and Methods
Reagents
Cell culture reagents and phosphate buffered saline (PBS) were obtained from Invitrogen (Gaithersburg, MD). Fetal bovine serum (FBS) was purchased from Hyclone. Protease inhibitor cocktail was purchased from Roche Diagnostics (Indianapolis, IN). Trypsin Gold (Mass Spectrometry Grade) was purchased from Promega (Madison, WI). Mass spectrometry solvents were obtained from Burdick and Jackson (Muskegon, MI). iTRAQ 8-plex multiplex kit and buffer kit were purchased from AB Sciex (Framingham, MA). All other reagents were acquired from Sigma-Aldrich (St. Louis, MO).
Cell Culture and Protein Harvest
293FT cells were transfected with the murine stem cell virus-GFP (MSCV-GFP) retroviral plasmid with retroviral packaging vector pCL-Eco (Imgenex, San Diego, CA). Viral supernatants were harvested, concentrated with Centricon Plus-70 filters (Millipore, Billerica, MA), and transduced into 70Z/3 cells. Stable cell lines were created by sorting for GFP+ cells. MiRNA expression is controlled by the long terminal repeat (LTR) promoter contained in the MSCV-GFP plasmid. Cells were grown in RPMI 1640 supplemented with 10% FBS, 1mM HEPES, 2 mM L-glutamine, 1mM sodium pyruvate, and 55µM 2-mercaptoethanol (BME). Cell pellets were rinsed with PBS before lysis in 500mM TEAB, 0.1% SDS, 1mM NaF, 1mM β-glycerophosphate, and 1mM Na3VO4 with one tablet of protease inhibitor cocktail. Lysates were sonicated twice for 60 seconds at 10% amplitude, with a rest of 60 seconds between. Lysates were then clarified through centrifugation at 4°C for 10 minutes at 15,000 RPM. Protein concentrations were determined using a BCA assay kit (Thermo Scientific, Waltham, MA) with BSA standards (Thermo Scientific). Three biological replicates were harvested for each miRNA-expressing cell line, and the negative control. The parental 70Z/3 cell line was analyzed in biological duplicate. 300µg of protein from each lysate was combined with six volumes of cold acetone and allowed to precipitate for 6 hours at −20°C. After removing the supernatant, pellets were washed with 500µL of cold acetone and allowed to air dry for five minutes. Pellets were resuspended in 40µL of 0.1% SDS in 500mM TEAB and again quantified using a BCA assay. 45µg of each sample was taken to continue sample preparation.
Preparation of Mass Spectrometry Samples
Proteins were reduced with 5mM Tris (2-carboxyethyl) phosphine hydrochloride (TCEP) at 60°C for 1 hour and alkylated with 5mM iodoacetamide for 10 minutes at RT in the dark. Proteins were then digested overnight at 37°C with trypsin gold (Promega, Madison, WI, USA) at a 50:1 protein to trypsin ratio (w/w) in the presence of 1mM CaCl2. The digestion reaction was terminated with the addition of 1mM phenylmethylsulfonyl fluoride (PMSF). Sample volumes were reduced to 12 µL through vacuum centrifugation. iTRAQ labels were thawed for five minutes at RT and diluted with 50µL of isopropanol. 28µL of iTRAQ label was added to each sample and allowed to react at RT for 2 hours. The labeling reaction was quenched with the addition of 40mM glycine for 20 minutes at RT. Samples were pooled and excess labeling reagents and SDS were removed using an SCX SpinTip sample preparation kit (Protea Biosciences, Morgantown, WV) following manufacturer’s instructions. High-pH RP fractionation was performed using an Oasis HLB 1cc Vac Cartridge with 30mg sorbent and 30µm particle size (Waters Corporation, Milford, MA). All buffers used in the separation contained 10mM NH4HCO3 and were adjusted to pH 10 with NH4OH. The cartridge was prepared by activating with 2mL of 80%ACN and equilibrating with 3mL of 10mM NH4HCO3. Samples were resuspended in 500 µL of 10mM NH4HCO3, loaded onto the cartridge, and washed with 3mL of 10mM NH4HCO3. Peptides were fractionated with buffers containing 5, 10, 13, 17, 20, 23, 30, and 80% ACN. All samples were desalted with C18 ZipTips (Millipore, Billerica, MA) before LC-MS/MS analysis.
Mass Spectrometry Analysis
Samples were resuspended in 0.1% FA in HPLC grade water. Analysis was performed with a nanoACQUITY Ultra Performance LC (UPLC) system (Waters Corporation, Milford, MA) coupled to a Q-Exactive mass spectrometer (Thermo Fisher Scientific, Bremen, Germany). Peptides were loaded onto a BEH C18 reverse phase column (100µm × 100mm, 1.7µm particle size) (Waters Corporation, Milford, MA) and separated using a binary solvent system consisting of 0.1% FA in water (A) and 0.1% FA in acetonitrile (B). The following linear gradient was used for all samples: 98-82% A in 95 minutes, 82-60% A in 10 minutes, 15% A for ten minutes, and equilibrated with 98% A for 10 minutes at 900nL/min. The Q-Exactive was operated in Top 12 data-dependent mode with automatic switching between MS and MS/MS modes. The nanoelectrospray ion source was operated at 1.8kV, and the ion transfer tube was at 280°C. Full MS scans were acquired with a resolution of 70,000 and an automatic gain control (AGC) target of 1 × 10⁶ ions with a maximum fill time of 250 ms. MS1 spectra were acquired from 400-1,800 m/z. MS/MS scans (100-1,500m/z) were acquired with a resolution of 35,000 and a maximum fill time of 120 ms. The AGC target was set at 1 × 10⁶ ions with an underfill ratio of 0.6% and an isolation window of 2 m/z. Ions were fragmented with a normalized collision energy (NCE) of 30.0, and dynamic exclusion was set to 40.0 s. Samples with a charge of +1 or greater than +7 were excluded from MS/MS analysis. Samples were run with duplicate injections.
Data Analysis
All .raw files were searched using Proteome Discoverer 1.4 software (Thermo Fisher Scientific, Bremen, Germany) with MASCOT version 2.2.4 against the UniProt mouse and decoy databases (Version 4, June 2012, 59,345 sequences). The following parameters were used: trypsin was selected as the enzyme; two missed cleavages were allowed; precursor mass tolerance was set to 20ppm and fragment mass tolerance was 0.05 Da. Variable modifications included protein N-terminal glutamine deamidation, methionine oxidation, acetylation, and iTRAQ 8plex labels on tyrosine. Static modifications included carbamidomethylation of cysteine and iTRAQ 8plex labels at the N-termini and lysine side chains. Peptides were filtered for high confidence, resulting in a peptide level false discovery rate (FDR) that is less than 1%. Strict maximum parsimony principle was applied considering PSMs with a delta Cn better than 0.15. The delta Cn used in Proteome Discoverer is distinct from the delta Cn used during data analysis by SEQUEST. The integration tolerance window was set to 20ppm, and only unique peptides were considered for quantification. Ratios were normalized on protein median for quantification. All analyses were performed in Microsoft Excel unless specified otherwise.
Multiple Reaction Monitoring
Samples were prepared as described above omitting the iTRAQ labeling and fractionation. Proteins that showed a decrease in expression after miRNA expression were chosen for quantification in all cell lines. Peptides that were unique to each protein were identified and transition ions were chosen based on empirical data. Three transitions were chosen per peptide. The most intense transitions were used for quantification, while the other two transitions served as confirmation of peptide identification. MRM detection was performed on a 6500 QTRAP (AB SCIEX, Concord, Ontario, Canada) running in triple quadrupole mode. Peptides were loaded onto a HPLC 2D NanoLC Ultra (Eksigent) equipped with a Waters Acquity BEH C18 column (100 µm × 100 mm). Peptides were separated using a 96 minute gradient from 2% solvent B to 30% solvent B, followed by an organic wash and re-equilibration to 2% B. A flow rate of 533 nL/min was used. The nanospray source operated with a curtain gas of 25.0, an interface heater temperature of 150, and an ionspray voltage of 2300.0. A dwell time of 20ms was used for all runs. Collision energies were calculated based on the formulas CE= 0.03 * (precursor m/z) + 3 for triply charged peptides and 0.05 * (precursor m/z) + 1 for doubly charged peptides. All samples were analyzed in technical duplicate and samples were normalized to the Myosin heavy chain protein to minimize variability. Peptide sequences and transitions used for quantification are provided in the supporting information.
Quantitative Real Time PCR
Total RNA (including miRNAs) was harvested from all 70Z/3 cell lines using the miRNeasy kit (Qiagen, Valencia, CA) according to manufacturer’s instructions. MiRNA expression was determined using TaqMan microRNA assays (Applied Biosystems, Foster City, CA). MiR-16 was used for expression level normalization. 40 µg of RNA was reverse transcribed with the High-Capacity cDNA Reverse Transcription Kit (Applied Biosystems, Foster City, CA) and 3 µL of RT primer. Reverse transcription was performed in a thermocycler for 30 min at 16°C, 30 min at 42°C, and 5 min at 85°C. PCR samples were prepared in triplicate according to the TaqMan assay protocol. Quantitative PCR was performed on a StepOne-Plus instrument (Applied Biosystems, Foster City, CA). Samples were held at 95°C for 10 minutes followed by 40 cycles of 95°C for 15 s and 60°C for 60 s.
Gene expression analysis of targets was performed using PerfeCta SYBR Green FastMix (Quanta Biosciences, Gaithersburg, MD) on a StepOne-Plus instrument (Applied Biosystems, Foster City, CA). Samples were held at 95°C for two minutes followed by 40 cycles of 95°C for 15s and 60°C for 60s. Reactions were performed in technical triplicate and all genes were normalized to GAPDH.
3’ RACE
3’ rapid amplification of cDNA ends was performed to sequence the 3’ UTR of select genes as described previously34. Briefly, total RNA was harvested from cell lines as described above. Reverse transcription of 5µg of RNA was performed using a primer with the sequence 5'–ccagtgagcagagtgacgaggactcgagctcaagcttttttttttttttttt–3' to create a 3’ UTR cDNA pool. Gene specific primers were used to amplify the 3’ UTR regions of different genes with GoTaq DNA polymerase (Promega) according to manufacturer’s instructions. All primer sequences can be found in Table S1. Sanger sequencing of PCR products was performed at the Notre Dame Genomics Core Facility.
Results and Discussion
iTRAQ Proteomics of the mirn23a Cluster
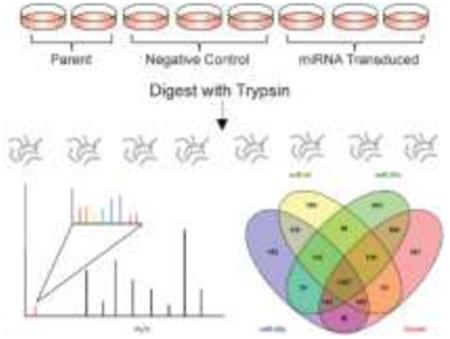
To investigate the protein targets of the mirn23a cluster, murine pre-B lymphoblast 70Z/3 cells were transduced with a retroviral murine stem cell virus (MSCV) vector to stably express miR-23a, miR-27a, miR-24, or the entire cluster in tandem27. The mature sequences of the miRNAs can be seen in Figure 1A. Cells containing a negative control MSCV-GFP retrovirus and parent 70Z/3 cells were also analyzed. Overexpression of miRNAs in each cell line was confirmed using TaqMan RT-PCR (Figure 1B). Protein fold changes between cells transduced with miRNAs and cells containing a negative control vector were calculated based on iTRAQ tag intensities. The intensities of iTRAQ reporter ions, as well as peptide identification information, are detected in the tandem spectra acquired in a mass spectrometry run (Figure S1). This allows for protein identification and calculation of fold change ratios without complicating MS1 spectra. We performed four separate iTRAQ experiments to examine each cell line in biological triplicate. Replicates of parent 70Z/3 cells were included in each experiment as a control for variation. Proteins were harvested from cells and digested overnight with trypsin. The resulting peptide mixtures were labeled with eight-plex iTRAQ tags. After sample pooling, peptides were separated into eight fractions using high-pH reverse-phase separation, followed by low-pH UPLC-MS/MS coupled to a Q-Exactive mass spectrometer. An overview of the experimental procedure is shown in Figure 2.
Figure 1.
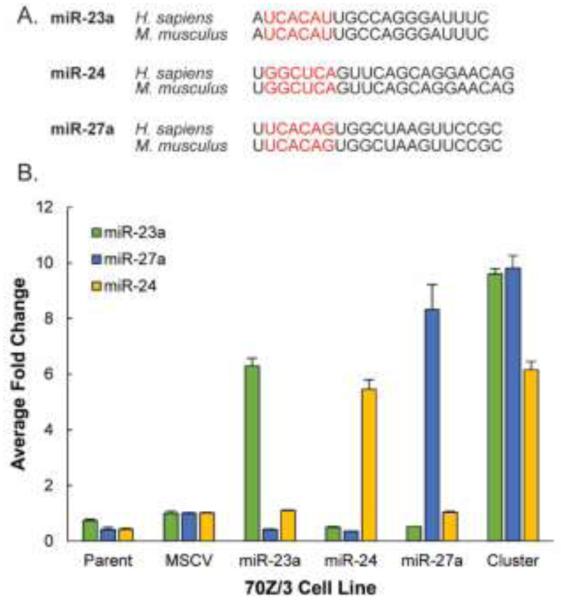
miR-23a/27a/24-2 levels in 70Z/3 cells. (A) Sequences of mature miRNAs in humans and mice. Seed sequences are indicated in red. (B) Taqman qRT-PCR of miRNA levels in 70Z/3 cell lines. Data represented as average + SD.
Figure 2.
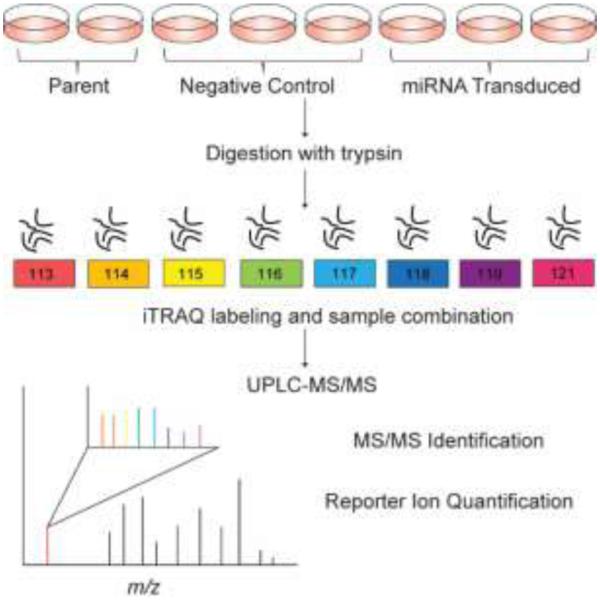
Overview of experimental design. Biological replicates of 70Z/3 cells were harvested for protein and digested with trypsin. Each sample was labeled with a particular iTRAQ tag and combined for UPLC-MS/MS analysis. Tandem mass spectra allow for identification of peptides and quantification from iTRAQ reporter ions.
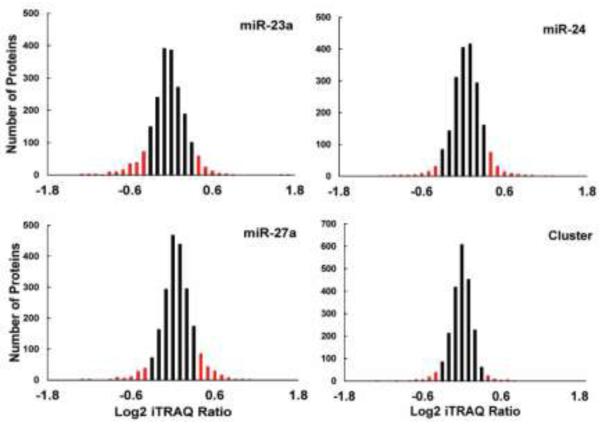
Each experiment identified and quantified approximately 2,000 proteins at a 1% false discovery rate (FDR), resulting in a combined total of 3,051 proteins. Between 10,736 and 11,848 peptides were identified in each experiment, with an average of 45,144 peptide spectral matches (Table 1). The overlap between experiments can be seen in Figure S2. The log2 fold change distributions were plotted and found to be centered around zero, indicating that the majority of quantified proteins did not change in abundance after miRNA overexpression (Figure 3). These subtle abundance changes agree with previous reports demonstrating that miRNAs have modest effects on global protein levels31,32. The log2 fold changes of parent cell line replicates were compared to determine the inherent biological and experimental variation. The fold changes were distributed around zero with a standard deviation of 0.16. (Figure S3). Because miRNAs are known to subtly alter protein expression, the threshold for differentially expressed proteins was set at two standard deviations from the mean (log2 fold change ≤ −0.32 or ≥ 0.32). Following miR-23a, miR-24, miR-27a, or mirn23a overexpression, 163, 66, 161, and 124 proteins, respectively, showed a significant decrease in expression.
Table 1.
Summary of Peptide and Protein Identifications through iTRAQ-UPLC-MS/MS
| Experiment | MS/MS | PSMS | % Identification | Peptides | Proteins |
|---|---|---|---|---|---|
| miR-23a | 142,517 | 43,085 | 30.2 | 11,417 | 1,991 |
| miR-24 | 140,995 | 41,806 | 29.6 | 10,736 | 1,942 |
| miR-27a | 164,933 | 47,309 | 28.6 | 11,848 | 2,127 |
| Cluster | 168,585 | 48,379 | 28.7 | 11,491 | 2,099 |
Figure 3.
Histograms displaying log2 iTRAQ fold change ratios. Differentially regulated proteins are indicated in red.
Cumulative Distribution Analysis
MiRNAs are known to repress protein expression by matching their seed sequence to a binding site in the 3’ UTR of target mRNAs. A cumulative distribution analysis of expression level changes of proteins containing a miR-23a, miR-24, or miR-27a site in their 3’ UTR regions shows a subtle shift towards repression compared to the overall data set (Figure S4). For each miRNA, the list of downregulated proteins is enriched with proteins containing miRNA seed sequence matches. The mirn23a cluster data set also shows enrichment for proteins that contain a seed match for at least one of the three members of the cluster.
To confirm that this effect is specific to the miRNA expressed in each cell line, we analyzed protein expression changes associated with alternate miRNAs from the mirn23a cluster. For example, the miR-23a data set was examined for targets that contain miR-27a or miR-24-2 binding sites. No shift toward repression was seen when targets of alternate miRNAs were analyzed, indicating the decrease in protein expression levels were due to miR-23a overexpression. A specific shift towards downregulation was also seen in the miR-24 and miR-27a data sets. These results demonstrate that the subtle proteomic changes that occur after miRNA overexpression are specific to each altered miRNA, and that they exhibit their effects through binding sites in the 3’ UTR.
Proteomic Identification of miRNA targets
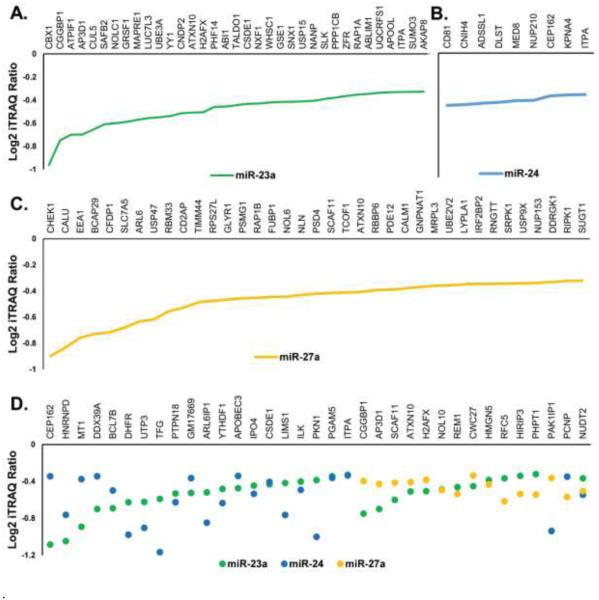
Putative targets of miR-23a, miR-24, miR-27a, and the mirn23a cluster were determined based on the degree of downregulation and presence of a miRNA binding site in the 3’ UTR of the target gene. Of the 163 proteins that decreased in expression due to miR-23a, 35 possess miR-23a binding sites in their 3’ UTR. Ten of the 60 proteins repressed by miR-24, and 35 of the 161 repressed by miR-27a, contained predicted miRNA seed matches in their 3’ UTR (Figure 4A-C). The presence of a seed match indicates a strong likelihood these genes are direct targets of the corresponding miRNAs. As an example, DHFR, which was previously confirmed as a target of miR-24, was downregulated35.
Figure 4.
Targets detected by quantitative iTRAQ mass spectrometry for (A) miR-23a (B) miR-24 and (C) miR-27a. (D) Proteins found to be downregulated by multiple miRNAs. These proteins were found to be significantly downregulated through iTRAQ quantification after overexpression of each miRNA.
Shared miRNA targets are genes that are repressed by more than one miRNA acting individually, but originally derived from a cluster28. A cohort of shared targets was evident when the proteins repressed by individual miRNAs were considered (Figure 4D). Shared targets are expected for miR-23a and miR-27a because their seed sequences differ by only a single nucleotide. Indeed, 13 proteins showed similar magnitudes of downregulation when either miRNA was expressed. Twenty proteins showed decreased expression by miR-23a or miR-24 overexpression. miR-24 and miR-27a have two shared targets, and one gene, NUDT2, showed repression in all three data sets. The Nudt2 gene encodes the Bis(5’nucleosyl)-tetraphosphatase enzyme, and which hydrolyzes di-adenosine tetraphosphate (Ap4a) to yield AMP and ATP. It has been identified as a potential tumor suppressor gene in humans36. Though the seed sequences of miR-23a and miR-27a are distinct from miR-24, the 3’ UTR of mRNAs contain many miRNA binding sites. Therefore, it is not unexpected for non-homologous miRNAs to exhibit regulatory effects on the same proteins.
Additionally, a number of targets only showed significant downregulation when all three members of the cluster were present, classifying them as cluster targets (Figure 5)28. Most targets showed slight repression with the individual miRNAs, but the level did not become significant until all three were present. Interestingly, CUL2 was upregulated in the presence of miR-23a, miR-24, or miR-27a, but showed a significant decrease in expression from the entire cluster. It is possible that the upregulation of the cluster caused a decrease in CUL2 expression as a secondary target. The interesting nature of this change in expression warrants further study. These results agree with previous findings that clustered miRNAs have synergistic effects on target genes28.
Figure 5.
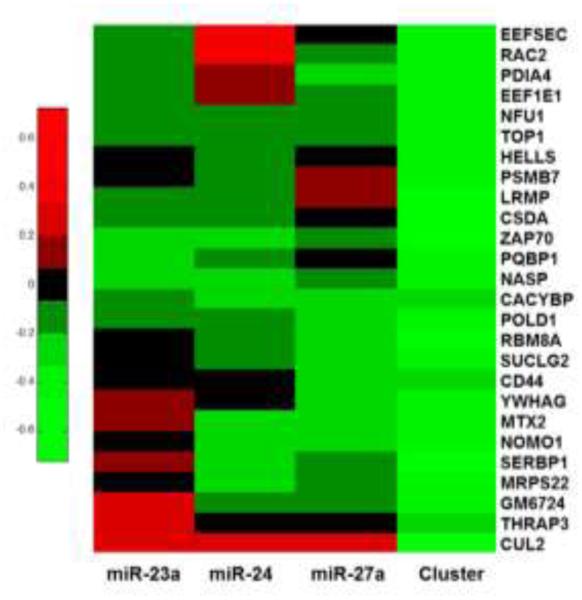
Heat map displaying genes that only showed significant repression in the presence of the entire cluster. Green indicates downregulation, while red indicates upregulation. All values were derived from iTRAQ quantification.
Target Algorithm Evaluation
Predicted target genes from algorithms including TargetScan37, microT38, PicTar39, miRDB40, and PITA7 were correlated with iTRAQ quantification data to evaluate their predictive abilities. The average log2 fold change for putative targets from all algorithms were negative for miR-23a and miR-27a, demonstrating that the majority of predictions were downregulated (Figure S5). Only miRDB predictions resulted in a negative average fold change for miR-24. Overall, miRDB predictions agreed most with our data for targets of miR-24 and miR-27a, while all algorithms performed similarly for miR-23a. Both TargetScan and miRDB heavily factor the presence of a miRNA binding site into their predictions, while weighing parameters such as free energy costs to a lesser degree. This consideration of miRNA seed site may be responsible for the accuracy of TargetScan and miRDB. Interestingly, when the predicted targets were analyzed for the cluster data set, a greater degree of repression was observed. This demonstrates the synergistic effect clustered miRNAs exhibit to decrease expression of target genes, even if they are not predicted to be regulated by multiple miRNAs.
Gene Ontology Analysis
To determine the biological relevance of miR-23a, miR-24, miR-27a, and the entire cluster, we ran each list of significantly altered proteins through the PANTHER (protein analysis through evolutionary relationships) database, which categorizes downregulated proteins according to their cellular compartment and molecular function (Figure S6)41. All data sets contained proteins localized to the nucleus, organelles, and organelle lumens. However, proteins downregulated by miR-23a also showed enriched localization to the mitochondria and chromosomes. Proteins that were repressed by miR-27a were found in the spliceosome and cytoplasmic dynein complex. When considering molecular functions, all miRNAs were found to regulate proteins involved in RNA binding. However, each miRNA also showed enrichment for unique molecular functions. Proteins regulated by miR-23a are involved in chromatin binding, translation initiation, and ATPase activity. MiR-24 proteins were enriched for lipoic acid binding and coenzyme binding. MiR-27a proteins play a role in structural constituents of the ribosome and cytoskeleton, and proteins downregulated by the entire cluster are involved in mRNA 3’-UTR binding. MiR-23a, miR-27a, and the entire cluster also showed enrichment for proteins involved in nucleotide binding.
These data sets were further analyzed using Reactome to determine which biological processes are strongly enriched (Supporting Information IV). The lists of downregulated proteins from each miRNA data set were submitted to the database and pathways with a p-value below 0.05 were considered significant. Both miR-23a and miR-27a were found to repress proteins involved with global nucleotide excision repair, supporting previous findings that miR-23a protects against UVB damage through regulation of DNA damage pathways42. miR-23a and miR-27a are also responsible for regulating cell cycle checkpoints including the G2/M transition and S phase entry. The downregulation of cell cycle checkpoints was also evident when the entire cluster was overexpressed.miR-23a was found to play a role in the SCF-FBXW7 ubiquitin ligase pathway by targeting Skp1a and Cul1. Interestingly, previous studies found miR-27a directly targets FBXW7 to increase the invasive abilities of colon cancer cells25. From this, we can infer that multiple members of the mirn23a cluster have the capacity to regulate different members of the same pathways. MiR-27a has been previously shown to decrease expression of the apoptotic protein BCL-2, while we found miR-27a to regulate apoptosis through repression of STK343. MiR-24 appears to play a role in regulation of lipid metabolism through PPARα and glucose transport, which is entirely distinct from the other two miRNAs in the mirn23a cluster.
When considering the cluster as a whole, a number of pathways not enriched by any individual miRNA can be seen. For example, the mirn23a cluster data was enriched for proteins that activate WASPs and WAVEs, which regulate actin polymerization for cell motility44. In addition, the cluster represses proteins involved with insulin-like growth factor 2 signaling, which are responsible for mitogenic activities and activation of the TGF-β pathway45. It is important to note that most of the pathways enriched by the mirn23a cluster were distinct from any enriched by miR-23a, miR-24, or miR-27a. From this analysis it is evident that the effects of the mirn23a cluster on the proteome differ from the effects of the individual miRNAs.
Validation of iTRAQ Quantification
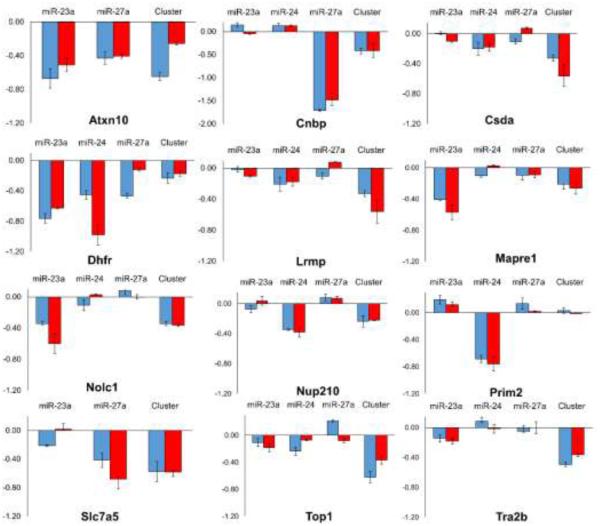
We used multiple reaction monitoring (MRM) and RT-PCR to confirm iTRAQ quantification and identification of miRNA targets (Figure 6). Proteins found to be repressed by iTRAQ quantification were confirmed through MRMs in their direction and miRNA specificity. Confirmation by this additional technique validates our iTRAQ data sets. Transitions used for quantification can be found in Table S2. Furthermore, we performed quantitative RT-PCR of genes that contain miRNA binding sites and are likely to be direct targets of these miRNAs (Table S3). We chose targets identified by proteomics that are predicted to be direct targets of miR-23a, miR-24, or miR-27a, or cluster targets. Mapre1, Nup210, Dhfr, and Slc7aF5 all showed downregulation of transcript expression by their specific miRNAs, indicating the miRNAs act through transcript degradation mechanisms. The cluster targets, Top1 and Tra2b, showed a significantly larger degree of repression when the entire cluster was overexpressed. Top1 exhibited a small degree of repression in the miR-23a data set. Two targets, Atxn10 and Chek1, only showed slight repression, indicating these genes are repressed through translational inhibition.
Figure 6.
Multiple reaction monitoring confirmation of iTRAQ quantification. MRM measurements are shown in blue and iTRAQ measurements were shown in red. All values are represented as the Log2 ± SD.
A number of miRNA targets detected in this study were chosen for confirmation of the presence of miRNA binding sites using 3’ Rapid Amplification of cDNA Ends (3’ RACE). The genes Nup210 and Med8 were found to have miR-24 binding sites, while Nln and Rap1b were shown to contain miR-27a seed matches, indicating repression likely occurs through traditional mechanisms (Figure S7). However, alternative polyadenylation is known to occur in up to 32% of murine transcripts, resulting in mRNAs that no longer contain predicted miRNA binding sites. This process can result in transcripts with multiple poly-A regions in the 3’ UTR, or poly-A regions that disrupt the coding sequences of mRNAs46. Alternative polyadenylation may be responsible for a number of false negatives in our study due to mRNA modifications in the 70Z/3 cell line.
Conclusions
In this study, we examined the targets of miR-23a, miR-24, miR-27a, and the mirn23a cluster through quantitative iTRAQ UPLC-MS/MS. We identified between 60-160 targets for each condition, including a number of shared targets between miRNAs, and targets regulated by the entire cluster. The pathways identified for each miRNA may help to shed light on mechanisms of many biological processes and diseases that these miRNAs play a role in. We also demonstrated the importance of examining miRNA clusters in their entirety, because their physiological roles differ from those of individual miRNAs.
Although this study was conducted in a murine cell line, we believe our findings have implications in humans as well. The genomes of mice and humans only differ by 15%, and the mechanisms of miRNA biogenesis and function are conserved47,48. The mature sequences of miR-23a, miR-24, and miR-27a are identical in both species15. The synergistic effect of miRNA clusters on the proteome described here is known to exist in both mice and humans, and therefore our work likely translates between these species28.
Based on our proteomic studies of miRNA clusters, it is essential that predictive algorithms for miRNA targets factor the clustering of miRNAs into target predictions for increased accuracy. Future studies will discern primary and secondary targets of the miRNAs, as well as proteins that interact with and regulate the mirn23a cluster.
Supplementary Material
Acknowledgements
We thank the Notre Dame Mass Spectrometry and Proteomics Facility for their help with this project. We also thank Dr. Kerry Scott and Dr. Susan Skube for their assistance. This work was funded by the National Institutes of Health (R01GM110406), and the National Science Foundation (CAREER Award, CHE-1351595). The Walther Cancer Foundation provided salary support for ABH.
Footnotes
Supporting Information
Supporting Information I: Protein identifications using iTRAQ-LC-MS/MS
Supporting Information II: Figure S1-Figure S7
Figure S1. Sample spectra derived from fragmentation on a Q-Exactive mass spectrometer. iTRAQ reporter ions are shown in the inset of the spectra.
Figure S2. Overlap in protein identifications between experiments. All four experiments showed significant overlap, with a total of 1,207 proteins detected in all four experiments.
Figure S3. Distribution of iTRAQ ratios in experimental and biological replicates of parent 70Z/3 cell line. Distributions were centered around zero on the log2 scale, indicating little variation between replicates.
Figure S4. Cumulative distribution analysis of downregulated proteins. Each data set was analyzed for predicted targets of miR-23a, miR-24, and miR-27a. Specific repression was seen for each miRNA. The cluster data set showed repression for all three miRNAs.
Figure S5. Average fold change of proteins predicted by various miRNA target algorithms.
Figure S6. PANTHER analysis of downregulated proteins by each miRNA. The –log(p-value) for the cellular compartment and molecular function for downregulated proteins is displayed.
Figure S7. Sequences derived from 3’ RACE experiments. Regions of the 3’UTR of indicated genes were sequenced in 70Z/3 cell lines to confirm their presence in this system.
Table S1. Primers used in 3’ RACE experiments.
Supporting Information III:
Table S2. Transitions used for MRM quantification.
Table S3. RTPCR validation of iTRAQ-detected targets. Values represent the average log2 fold change. All reactions were performed in triplicate.
Supporting Information IV: Gene ontology analysis of miR-23a, miR-24, miR-27a, and cluster data sets
References
- 1.Ambros V. The functions of animal microRNAs. Nature. 2004;431(7006):350–5. doi: 10.1038/nature02871. [DOI] [PubMed] [Google Scholar]
- 2.Bartel DP. MicroRNAs: genomics, biogenesis, mechanism, and function. Cell. 2004;116(2):281–97. doi: 10.1016/s0092-8674(04)00045-5. [DOI] [PubMed] [Google Scholar]
- 3.Brennecke J, Stark A, Russell RB, Cohen SM. Principles of microRNA-target recognition. PLoS biology. 2005;3(3):e85. doi: 10.1371/journal.pbio.0030085. [DOI] [PMC free article] [PubMed] [Google Scholar]
- 4.Bartel DP. MicroRNAs: target recognition and regulatory functions. Cell. 2009;136(2):215–33. doi: 10.1016/j.cell.2009.01.002. [DOI] [PMC free article] [PubMed] [Google Scholar]
- 5.Vasudevan S, Tong Y, Steitz JA. Switching from repression to activation: microRNAs can up-regulate translation. Science. 2007;318(5858):1931–4. doi: 10.1126/science.1149460. [DOI] [PubMed] [Google Scholar]
- 6.Djuranovic S, Nahvi A, Green R. A parsimonious model for gene regulation by miRNAs. Science. 2011;331(6017):550–3. doi: 10.1126/science.1191138. [DOI] [PMC free article] [PubMed] [Google Scholar]
- 7.Kertesz M, Iovino N, Unnerstall U, Gaul U, Segal E. The role of site accessibility in microRNA target recognition. Nature genetics. 2007;39(10):1278–84. doi: 10.1038/ng2135. [DOI] [PubMed] [Google Scholar]
- 8.Wilczynska A, Bushell M. The complexity of miRNA-mediated repression. Cell death and differentiation. 2015;22(1):22–33. doi: 10.1038/cdd.2014.112. [DOI] [PMC free article] [PubMed] [Google Scholar]
- 9.Schmiedel JM, Klemm SL, Zheng Y, Sahay A, Bluthgen N, Marks DS, van Oudenaarden A. Gene expression. MicroRNA control of protein expression noise. Science. 2015;348(6230):128–32. doi: 10.1126/science.aaa1738. [DOI] [PubMed] [Google Scholar]
- 10.Ha M, Kim VN. Regulation of microRNA biogenesis. Nature reviews. Molecular cell biology. 2014;15(8):509–24. doi: 10.1038/nrm3838. [DOI] [PubMed] [Google Scholar]
- 11.Altuvia Y, Landgraf P, Lithwick G, Elefant N, Pfeffer S, Aravin A, Brownstein MJ, Tuschl T, Margalit H. Clustering and conservation patterns of human microRNAs. Nucleic acids research. 2005;33(8):2697–706. doi: 10.1093/nar/gki567. [DOI] [PMC free article] [PubMed] [Google Scholar]
- 12.Zhang Y, Zhang R, Su B. Diversity and evolution of MicroRNA gene clusters. Science in China. Series C, Life sciences / Chinese Academy of Sciences. 2009;52(3):261–6. doi: 10.1007/s11427-009-0032-5. [DOI] [PubMed] [Google Scholar]
- 13.Mehta A, Zhao JL, Sinha N, Marinov GK, Mann M, Kowalczyk MS, Galimidi RP, Du X, Erikci E, Regev A, Chowdhury K, Baltimore D. The MicroRNA-132 and MicroRNA-212 Cluster Regulates Hematopoietic Stem Cell Maintenance and Survival with Age by Buffering FOXO3 Expression. Immunity. 2015;42(6):1021–32. doi: 10.1016/j.immuni.2015.05.017. [DOI] [PMC free article] [PubMed] [Google Scholar]
- 14.Doebele C, Bonauer A, Fischer A, Scholz A, Reiss Y, Urbich C, Hofmann WK, Zeiher AM, Dimmeler S. Members of the microRNA-17-92 cluster exhibit a cell-intrinsic antiangiogenic function in endothelial cells. Blood. 2010;115(23):4944–50. doi: 10.1182/blood-2010-01-264812. [DOI] [PubMed] [Google Scholar]
- 15.Chhabra R, Dubey R, Saini N. Cooperative and individualistic functions of the microRNAs in the miR-23a~27a~24-2 cluster and its implication in human diseases. Mol Cancer. 2010;9:232. doi: 10.1186/1476-4598-9-232. [DOI] [PMC free article] [PubMed] [Google Scholar]
- 16.Rogler CE, Levoci L, Ader T, Massimi A, Tchaikovskaya T, Norel R, Rogler LE. MicroRNA-23b cluster microRNAs regulate transforming growth factor-beta/bone morphogenetic protein signaling and liver stem cell differentiation by targeting Smads. Hepatology. 2009;50(2):575–84. doi: 10.1002/hep.22982. [DOI] [PubMed] [Google Scholar]
- 17.Nguyen T, Rich A, Dahl R. MiR-24 promotes the survival of hematopoietic cells. PloS one. 2013;8(1):e55406. doi: 10.1371/journal.pone.0055406. [DOI] [PMC free article] [PubMed] [Google Scholar]
- 18.Roy L, Bikorimana E, Lapid D, Choi H, Nguyen T, Dahl R. MiR-24 is required for hematopoietic differentiation of mouse embryonic stem cells. PLoS genetics. 2015;11(1):e1004959. doi: 10.1371/journal.pgen.1004959. [DOI] [PMC free article] [PubMed] [Google Scholar]
- 19.Li J, Aung LH, Long B, Qin D, An S, Li P. miR-23a binds to p53 and enhances its association with miR-128 promoter. Scientific reports. 2015;5:16422. doi: 10.1038/srep16422. [DOI] [PMC free article] [PubMed] [Google Scholar]
- 20.Nie M, Yu S, Peng S, Fang Y, Wang H, Yang X. miR-23a and miR-27a Promote Human Granulosa Cell Apoptosis by Targeting SMAD5. Biology of reproduction. 2015;93(4):98. doi: 10.1095/biolreprod.115.130690. [DOI] [PubMed] [Google Scholar]
- 21.Li J, Wang Y, Song Y, Fu Z, Yu W. miR-27a regulates cisplatin resistance and metastasis by targeting RKIP in human lung adenocarcinoma cells. Mol Cancer. 2014;13:193. doi: 10.1186/1476-4598-13-193. [DOI] [PMC free article] [PubMed] [Google Scholar]
- 22.Mishra PJ, Song B, Wang Y, Humeniuk R, Banerjee D, Merlino G, Ju J, Bertino JR. MiR-24 tumor suppressor activity is regulated independent of p53 and through a target site polymorphism. PloS one. 2009;4(12):e8445. doi: 10.1371/journal.pone.0008445. [DOI] [PMC free article] [PubMed] [Google Scholar]
- 23.Chintharlapalli S, Papineni S, Abdelrahim M, Abudayyeh A, Jutooru I, Chadalapaka G, Wu F, Mertens-Talcott S, Vanderlaag K, Cho SD, Smith R., 3rd, Safe S. Oncogenic microRNA-27a is a target for anticancer agent methyl 2-cyano-3,11-dioxo-18beta-olean-1,12-dien-30-oate in colon cancer cells. International journal of cancer. Journal international du cancer. 2009;125(8):1965–74. doi: 10.1002/ijc.24530. [DOI] [PMC free article] [PubMed] [Google Scholar]
- 24.Mertens-Talcott SU, Chintharlapalli S, Li X, Safe S. The oncogenic microRNA-27a targets genes that regulate specificity protein transcription factors and the G2-M checkpoint in MDA-MB-231 breast cancer cells. Cancer research. 2007;67(22):11001–11. doi: 10.1158/0008-5472.CAN-07-2416. [DOI] [PubMed] [Google Scholar]
- 25.Jahid S, Sun J, Edwards RA, Dizon D, Panarelli NC, Milsom JW, Sikandar SS, Gumus ZH, Lipkin SM. miR-23a promotes the transition from indolent to invasive colorectal cancer. Cancer discovery. 2012;2(6):540–53. doi: 10.1158/2159-8290.CD-11-0267. [DOI] [PMC free article] [PubMed] [Google Scholar]
- 26.Ma Y, She XG, Ming YZ, Wan QQ. miR-24 promotes the proliferation and invasion of HCC cells by targeting SOX7. Tumour biology : the journal of the International Society for Oncodevelopmental Biology and Medicine. 2014;35(11):10731–6. doi: 10.1007/s13277-014-2018-6. [DOI] [PubMed] [Google Scholar]
- 27.Kong KY, Owens KS, Rogers JH, Mullenix J, Velu CS, Grimes HL, Dahl R. MIR-23A microRNA cluster inhibits B-cell development. Experimental hematology. 2010;38(8):629–640. doi: 10.1016/j.exphem.2010.04.004. e1. [DOI] [PMC free article] [PubMed] [Google Scholar]
- 28.Bauer KM, Hummon AB. Effects of the miR-143/-145 microRNA cluster on the colon cancer proteome and transcriptome. Journal of proteome research. 2012;11(9):4744–54. doi: 10.1021/pr300600r. [DOI] [PMC free article] [PubMed] [Google Scholar]
- 29.Thomas M, Lieberman J, Lal A. Desperately seeking microRNA targets. Nature structural & molecular biology. 2010;17(10):1169–74. doi: 10.1038/nsmb.1921. [DOI] [PubMed] [Google Scholar]
- 30.Lim LP, Lau NC, Garrett-Engele P, Grimson A, Schelter JM, Castle J, Bartel DP, Linsley PS, Johnson JM. Microarray analysis shows that some microRNAs downregulate large numbers of target mRNAs. Nature. 2005;433(7027):769–73. doi: 10.1038/nature03315. [DOI] [PubMed] [Google Scholar]
- 31.Selbach M, Schwanhausser B, Thierfelder N, Fang Z, Khanin R, Rajewsky N. Widespread changes in protein synthesis induced by microRNAs. Nature. 2008;455(7209):58–63. doi: 10.1038/nature07228. [DOI] [PubMed] [Google Scholar]
- 32.Baek D, Villen J, Shin C, Camargo FD, Gygi SP, Bartel DP. The impact of microRNAs on protein output. Nature. 2008;455(7209):64–71. doi: 10.1038/nature07242. [DOI] [PMC free article] [PubMed] [Google Scholar]
- 33.Kanzaki H, Ito S, Hanafusa H, Jitsumori Y, Tamaru S, Shimizu K, Ouchida M. Identification of direct targets for the miR-17-92 cluster by proteomic analysis. Proteomics. 2011;11(17):3531–9. doi: 10.1002/pmic.201000501. [DOI] [PubMed] [Google Scholar]
- 34.Elizabeth Scotto–Lavino GD. Michael A Frohman, 3' End cDNA amplification using classic RACE. Nature protocols. 2007;1:2742–2745. doi: 10.1038/nprot.2006.481. [DOI] [PubMed] [Google Scholar]
- 35.Mishra PJ, Song B, Mishra PJ, Wang Y, Humeniuk R, Banerjee D, Merlino G, Ju JF, Bertino JR. MiR-24 Tumor Suppressor Activity Is Regulated Independent of p53 and through a Target Site Polymorphism. PloS one. 2009;4(12) doi: 10.1371/journal.pone.0008445. [DOI] [PMC free article] [PubMed] [Google Scholar]
- 36.McLennan AG, Flannery AV, Morten JE, Ridanpaa M. Chromosomal localization of the human diadenosine 5',5"'-P1,P4-tetraphosphate pyrophosphohydrolase (Ap4A hydrolase) gene (APAH1) to 9p13. Genomics. 1998;47(2):307–9. doi: 10.1006/geno.1997.5092. [DOI] [PubMed] [Google Scholar]
- 37.Lewis BP, Burge CB, Bartel DP. Conserved seed pairing, often flanked by adenosines, indicates that thousands of human genes are microRNA targets. Cell. 2005;120(1):15–20. doi: 10.1016/j.cell.2004.12.035. [DOI] [PubMed] [Google Scholar]
- 38.Paraskevopoulou MD, Georgakilas G, Kostoulas N, Vlachos IS, Vergoulis T, Reczko M, Filippidis C, Dalamagas T, Hatzigeorgiou AG. DIANA-microT web server v5.0: service integration into miRNA functional analysis workflows. Nucleic acids research. 2013;41:W169–73. doi: 10.1093/nar/gkt393. (Web Server issue) [DOI] [PMC free article] [PubMed] [Google Scholar]
- 39.Krek A, Grun D, Poy MN, Wolf R, Rosenberg L, Epstein EJ, MacMenamin P, da Piedade I, Gunsalus KC, Stoffel M, Rajewsky N. Combinatorial microRNA target predictions. Nature genetics. 2005;37(5):495–500. doi: 10.1038/ng1536. [DOI] [PubMed] [Google Scholar]
- 40.Wong N, Wang X. miRDB: an online resource for microRNA target prediction and functional annotations. Nucleic acids research. 2015;43:D146–52. doi: 10.1093/nar/gku1104. (Database issue) [DOI] [PMC free article] [PubMed] [Google Scholar]
- 41.Mi H, Muruganujan A, Casagrande JT, Thomas PD. Large-scale gene function analysis with the PANTHER classification system. Nature protocols. 2013;8(8):1551–66. doi: 10.1038/nprot.2013.092. [DOI] [PMC free article] [PubMed] [Google Scholar]
- 42.Guo Z, Zhou B, Liu W, Xu Y, Wu D, Yin Z, Permatasari F, Luo D. MiR-23a regulates DNA damage repair and apoptosis in UVB-irradiated HaCaT cells. Journal of dermatological science. 2013;69(1):68–76. doi: 10.1016/j.jdermsci.2012.10.014. [DOI] [PubMed] [Google Scholar]
- 43.Zhang H, Li M, Han Y, Hong L, Gong T, Sun L, Zheng X. Down-regulation of miR-27a might reverse multidrug resistance of esophageal squamous cell carcinoma. Digestive diseases and sciences. 2010;55(9):2545–51. doi: 10.1007/s10620-009-1051-6. [DOI] [PubMed] [Google Scholar]
- 44.Miki H, Suetsugu S, Takenawa T. WAVE, a novel WASP-family protein involved in actin reorganization induced by Rac. The EMBO journal. 1998;17(23):6932–41. doi: 10.1093/emboj/17.23.6932. [DOI] [PMC free article] [PubMed] [Google Scholar]
- 45.Danielpour D, Song K. Cross-talk between IGF-I and TGF-beta signaling pathways. Cytokine & growth factor reviews. 2006;17(1-2):59–74. doi: 10.1016/j.cytogfr.2005.09.007. [DOI] [PubMed] [Google Scholar]
- 46.Elkon R, Ugalde AP, Agami R. Alternative cleavage and polyadenylation: extent, regulation and function. Nature reviews. Genetics. 2013;14(7):496–506. doi: 10.1038/nrg3482. [DOI] [PubMed] [Google Scholar]
- 47.Batzoglou S, Pachter L, Mesirov JP, Berger B, Lander ES. Human and mouse gene structure: comparative analysis and application to exon prediction. Genome research. 2000;10(7):950–8. doi: 10.1101/gr.10.7.950. [DOI] [PMC free article] [PubMed] [Google Scholar]
- 48.Friedman RC, Farh KKH, Burge CB, Bartel DP. Most mammalian mRNAs are conserved targets of microRNAs. Genome research. 2009;19(1):92–105. doi: 10.1101/gr.082701.108. [DOI] [PMC free article] [PubMed] [Google Scholar]
Associated Data
This section collects any data citations, data availability statements, or supplementary materials included in this article.


