Abstract
Retinal ganglion cell (RGC) loss is the hallmark of optic neuropathies, including glaucoma, where damage to RGC axons occurs at the level of the optic nerve head. In experimental glaucoma, damage is assessed at the axon level (in the retinal nerve fibre layer and optic nerve head) or at the soma level (in the retina). In clinical glaucoma where measurements are generally limited to non-invasive techniques, structural measurements of the retinal nerve fibre layer and optic nerve head, or functional measurements with perimetry provide surrogate estimates of RGC integrity. These surrogate measurements, while clinically useful, are several levels removed from estimating actual RGC loss. Advances in imaging, labelling techniques, and transgenic medicine are making enormous strides in experimental glaucoma, providing knowledge on the pathophysiology of glaucoma, its progression and testing new therapeutic avenues. Advances are also being made in functional imaging of RGCs. Future efforts will now be directed towards translating these advances to clinical care.
Clinical estimates of retinal ganglion cell loss
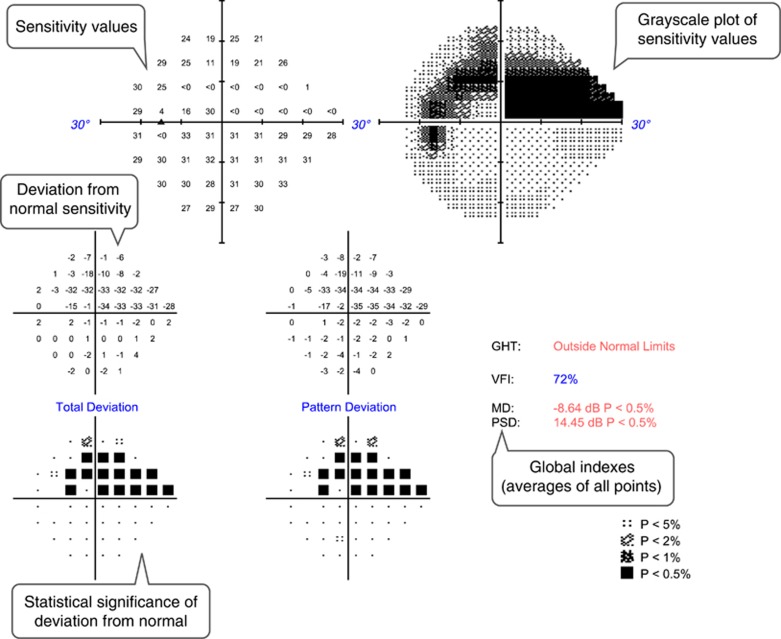
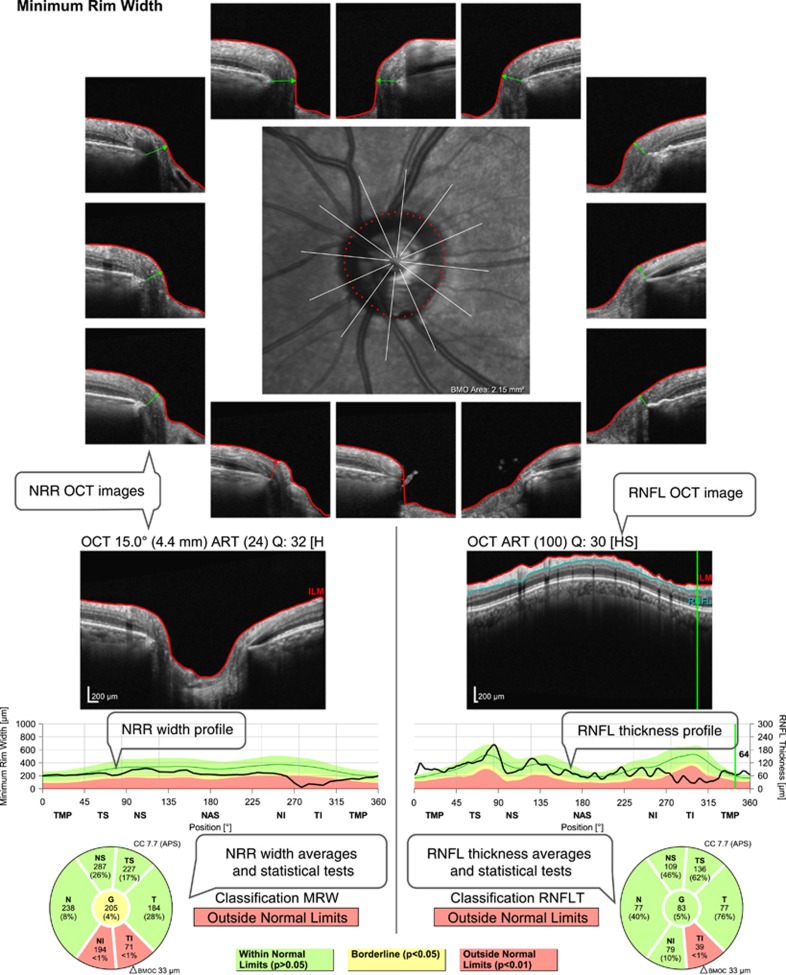
Parameters of retinal ganglion cell (RGC) damage are the cornerstone in the management of optic neuropathies such as glaucoma, and also increasingly in other diseases such as multiple sclerosis.1, 2 There are several methods available to assess RGC damage in clinical practice, including perimetry (Figure 1) and optical coherence tomography (OCT, Figure 2). Although these methods have significant value and are used in clinical decision-making, they remain surrogate measures that are several levels removed from the quantification of the number of remaining or lost RGCs.
Figure 1.
Example of a standard automated perimetry printout from the left eye of a patient with a superior arcuate scotoma due to open-angle glaucoma. Text bubbles describe the main parameters evaluated.
Figure 2.
Example of an optical coherence tomography (OCT) printout evaluating retinal nerve fibre layer (RNFL) thickness and optic nerve head neuroretinal rim (NRR) width from the same eye shown in Figure 1. There is a significant reduction of RNFL thickness and NRR width in the inferior sectors. Text bubbles describe the main parameters evaluated.
Perimetry
Standard automated perimetry measures achromatic differential light sensitivity with the purpose of quantifying visual function and RGC loss. A correlation between perimetric sensitivity and histological RGC counts has been demonstrated in experimental glaucoma in non-human primates,3, 4 and in human glaucoma patients.5, 6, 7 However, the sensitivity values depend on subjective visual detection of the stimuli, and therefore are influenced by several factors besides RGCs such as pre-retinal media irregularities, integrity of the visual pathway, higher visual processing, reaction time and attention.
Optical coherence tomography (OCT)
OCT provides objective measurements of anatomical structures related to RGCs. The most commonly used parameter is the peripapillary retinal nerve fibre layer (RNFL) thickness. The RNFL is made up mostly of RGC axons and its thickness as measured with OCT has a strong correlation with optic nerve axon count in experimental glaucoma in non-human primates.8, 9 Besides RGC axons, the RNFL also contains a significant and variable contribution of glial and vascular components. For example, the glial component in the RNFL of a normal monkey eye was estimated to vary from 18 to 42%, depending on retinal location.10 Large blood vessels contribute to around 14% of the RNFL.11 This proportion increases to an average exceeding 20% when the RNFL is thin11 and is much larger in superior and inferior locations (compared with nasal or temporal ones) due to the major vessel trunks.12 Because of these non-axonal contributions, the correspondence between RNFL thickness and the number of axons varies between retinal locations, stage of disease, and among individuals, reducing the accuracy of RNFL thickness as a parameter of RGC damage.
Another parameter commonly used as a surrogate of remaining RGCs is the neuroretinal rim (NRR), which is the continuation of the RNFL at the optic nerve head, containing all RGC axons before they leave the eye. Similar to RNFL thickness, width, area, or volume measurements of the NRR are influenced by its non-axonal components, including glia and blood vessels. Cases of documented complete loss of RGC axons can provide an estimate of the magnitude of the non-axonal components in the NRR. Drance and King13 reported 4 patients with complete loss of RGCs due to trauma or tumor compression of the optic nerve, who had their NRR area measured with fundus photography. The average reduction of NRR was ~35% of the initial values, suggesting that 65% of the NRR may not be composed of axons.
Additionally, NRR measurements are influenced by remodelling and biomechanical changes in the connective tissues of the optic nerve head. For example, as neural tissue is lost in the optic nerve head, remodelling changes of the connective tissues and gliosis can lead to a higher non-neural component of the NRR. Intraocular pressure changes can also impact the axial position of the lamina cribrosa and scleral canal opening area.14 Intraocular pressure reduction can lead to anterior movement of the lamina, causing anterior displacement of neuroretinal tissue, increasing the NRR parameters.15, 16 Similarly, intraocular pressure elevation can have the opposite effects.17, 18 The impact of connective tissue remodelling and biomechanical changes give rise to a weaker correlation between NRR and axonal counts compared to RNFL thickness.8
OCT also permits measurement of RGC layer thickness,19 specifically at the macula where over 40% of RGCs are located.20 Logically, it is assumed that ganglion cell layer thickness has the highest correlation with actual RGC number. However, limitations in current OCT technology do not always permit differentiation of the ganglion cell layer from the adjacent ones, namely the RNFL and inner plexiform layer, and therefore are often measured together,21, 22 increasing the non-RGC components of these measurements. Additionally, the ganglion cell layer also contains a significant number of displaced amacrine cells, varying from ~3% in central retina to 80% in the periphery.20, 23
Impact of inter-individual variations in clinical measurements
All parameters currently used in clinical practice are indirect measurements of RGC counts, with significant interference of non-RGC factors, reducing their accuracy to assess RGC damage. Cross-sectional studies may suggest strong correlation of these parameters with RGC count, but this may be related to the wide range of damage typically included in these studies, from normal to advanced glaucoma. When detecting smaller amounts of RGC damage, such as diagnosing early disease or detecting disease progression over few years, the noise included in these parameters from non-RGC factors may overcome the real signal of RGC damage. Furthermore, the estimated inter-subject variation in normal RGC counts is impressively high,20 making any estimates of actual RGCs highly tenuous. The low signal-to-noise ratio in current parameters is evidenced by the frequent scenario of patients showing changes in some parameters but not others, for example, a normal visual field examination with abnormal OCT, or vice-versa.
If all clinical parameters were reliable indicators of RGC damage, their outputs would be in high agreement, unlike what is observed in most clinical studies.24, 25 More direct and accurate parameters of RGC damage would provide better information for clinicians and likely improve patient care.
Tracking retinal ganglion cells in vivo
Longitudinal imaging of RGCs would be a most appropriate method to monitor the progression of glaucoma, yet to date, the ability to directly image RGCs is possible only in laboratory animals. For more than a decade, in vivo longitudinal imaging has been reliably performed in experimental rodent models of optic nerve damage causing RGC loss. Commonly used methods include fluorescence imaging of retrogradely labelled RGCs,26, 27 structural imaging of the optic nerve head28, 29, 30, 31 or axons,32 and imaging of RGC apoptosis.33 Of particular interest is the ability to image living RGC somas expressing fluorescent proteins. This can be accomplished with the use of transgenic animals or administering an exogenous label in a minimally invasive manner. Regardless of the method, it is important that (1) the RGCs remain labelled for longitudinal imaging and (2) RGC labelling decreases with the damage or death of the cell, for reliable measurements. The ability to introduce markers into living tissue for the monitoring of cellular health in specific cells is important when studying disease detection and progression.
Retrograde tracer labelling
The best-established method of RGC labelling in experimental animals, specifically rodents, is the administration of a tracer, commonly Fluorogold, to the optic nerve or region of the brain that RGCs project. Optic nerve labelling is assumed to label the entire RGC population and can be completed via the intact optic nerve or by stump labelling after the optic nerve is transected.34, 35 In rodents, the vast majority of RGCs project to the superior colliculus and therefore is logically used as the location for administering the tracer. This method has been reported to label more than 96% of RGCs.36, 37 Cholera toxin subunit B (CTB) conjugated to a fluorophore has also been used as a retrograde tracer applied to the superior colliculus of rodents to reliably and specifically label RGCs.38, 39 Major limitations of retrograde tracers are that they do not persist in RGCs for extended periods of time. Furthermore, the tracer is taken up by microglia and macrophages when RGCs die after inducing injury, reducing the specificity of the label to RGCs.
Tracer labelling via intravitreal delivery
Recently, there has been interest in introducing markers via intravitreal or subretinal injection to fluorescently label RGCs. These methods do not require the use of transgenic mice and can be used in a variety of species. Cholera toxin subunit B has also been used as an anterograde tracer to label RGC axons by administering it via intravitreal injection.40 This method has demonstrated widespread and sustained labelling in the ganglion cell layer, which can be used to measure cell density. However, it has been shown that, in mice, CTB labels approximately as many amacrine cells as RGCs. Despite the poor specificity, it is expected that RGCs previously labelled by an intravitreal injection of CTB would exhibit a loss of fluorescence when damage is induced.
Transgenic animals
A variety of transgenic mouse strains have been developed to express fluorescence in RGCs and are especially useful for longitudinal imaging. These fluorescence signals are easily detectable by non-invasive in vivo imaging of the retina.41, 42 Two of the most commonly used transgenic strains for studying RGCs in vivo express cyan fluorescent protein (CFP) or yellow fluorescent protein (YFP) under the control of the modified Thy1 gene promoter.43 This method of labelling RGCs is advantageous in that it is non-invasive and unlike retrograde labelling, does not potentially cause damage to the RGCs and surrounding tissue.
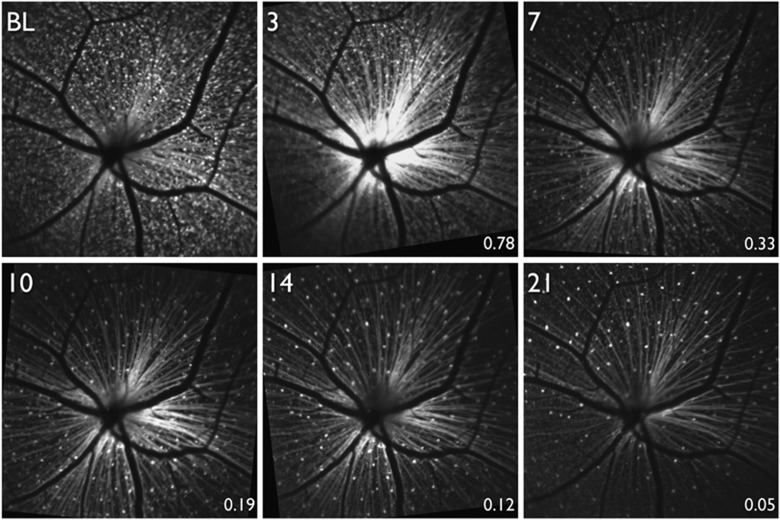
In Thy1-CFP mice, a high proportion of RGCs are labelled across the entire retina41, 43, 44 to permit quantification of RGC density. These mice have been used for studies of acute injury to RGCs, including optic nerve transection (Figure 3),45 optic nerve crush,46 N-methyl-D-aspartate (NMDA) receptor induced excitotoxicity,47 and retinal ischemia induced by increased intraocular pressure.48, 49 In all of these studies, longitudinal imaging was performed in vivo and there was demonstration of quantifiable RGC loss as a result of the injury. However, there is evidence that Thy1-CFP does not exclusively label RGCs, but also amacrine cells.44 Additionally, after RGC damage, a significant number of microglia become CFP-positive, confounding quantification of surviving RGCs.50 Despite this limitation, the Thy1-CFP transgenic mouse is a useful tool of assessing an in vivo approximation of RGC density for a variety of injury models.
Figure 3.
In vivo fluorescence imaging of the retina in a transgenic mouse expressing cyan fluorescent protein (CFP) under the Thy-1 promoter. Images were acquired longitudinally beginning at baseline (BL) and then 3, 7, 10, 14, and 21 days after optic nerve transection. (From Chauhan et al45).
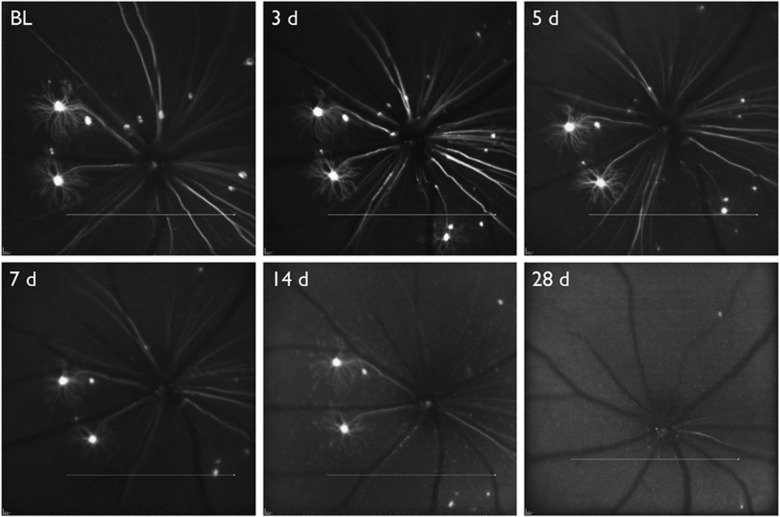
Thy1-YFP transgenic mice express fluorescence in <0.5% of RGCs, however, this low transfection rate reduces the amount of background fluorescence and permits visualization of the entire dendritic arbor. With this strain characterization of at least six different RGC types has been accomplished ex vivo51 and in vivo.52 The ability to monitor live cells and measure parameters such as soma size, dendritic length, dendritic arbor and dendritic complexity can provide detailed information on how RGCs respond to different types of injury.52, 53 The Thy1-YFP transgenic mouse has provided evidence that dendritic changes can be an early indicator of RGC damage and these structural changes are detectable with in vivo imaging (Figure 4). Visualizing and measuring dendritic atrophy of RGCs can be useful for studying the effects of neuroprotective interventions in the early stages of damage. However, if it is desirable to study RGC damage in an animal that does not have a fluorescent reporter endogenously expressed in RGCs, alternate labelling methods must be utilized.
Figure 4.
In vivo fluorescence imaging of the retina in a transgenic mouse expressing yellow fluorescent protein (YFP) under the Thy-1 promoter. Images were acquired longitudinally, beginning at baseline (BL) and then 3, 5, 7, 14, and 28 days after optic nerve transection.
Adeno-associated viral (AAV) vector labelling
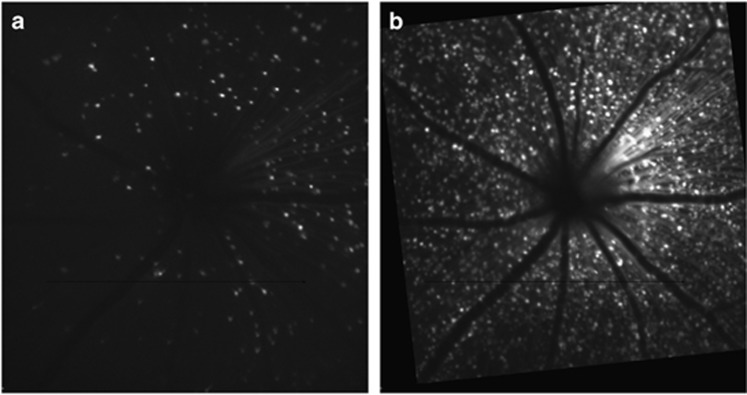
Adeno-associated viral vectors can also be used for labelling RGCs and studying RGC damage in vivo. AAV vectors are available in a variety of serotypes, which show preferential uptake to cell types, and have the ability to incorporate differing promoters, allowing for improved specificity to cells. These two factors make AAV vectors desirable for labelling an exclusive cell population, such as RGCs, in tissue with many cell types, like the retina. The utilization of AAV vectors for targeting RGCs to date has focused more on therapeutics than diagnostics. The greatest challenge when utilizing AAV vectors for in vivo labelling of RGCs is to overcome the inner limiting membrane, which acts as a physical barrier to achieving a high transduction rate.54, 55, 56 Administering AAV vectors via intravitreal injection has been shown to be a useful method for longitudinal labelling and imaging (Figure 5).57 This technique provides the ability to quantify an estimate of cell density in a living animal and monitor changes in cell labelling.
Figure 5.
In vivo fluorescence images of GFP-labelled retinal neurons in mouse following intravitreal injection of an adeno-associated viral vector with a ubiquitous promoter (AAV2-CAG-GFP) at (a) 1 week post-injection and (b) 5 weeks post-injection.
Functional imaging of RGCs
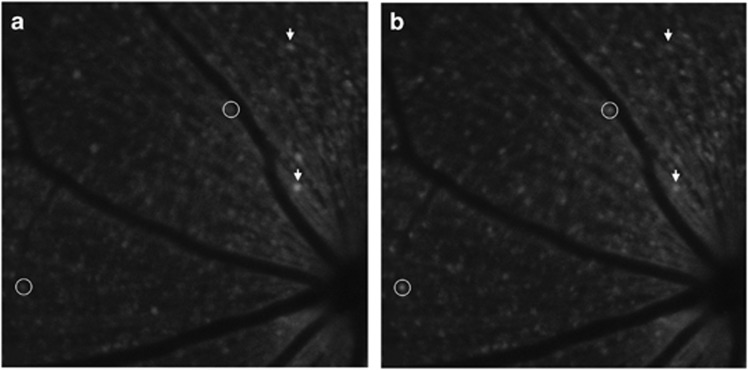
Genetically encoded calcium indicators, such as GCaMPs, are a useful tool for measuring intracellular calcium concentration of neurons58 and have the potential to be used for studying RGC calcium transients after optic nerve transection. Recently, reported work in ex vivo tissue from Thy1-GCaMP3 shows that after optic nerve transection baseline GCaMP3 fluorescence was reduced and the number of GCaMP3-expressing cells decreased.59 Proof-of-principle work by our group has shown that UV light exposure directed onto the retina results in changes of the fluorescence emission intensity of the GCaMP3 cells and can be detected with in vivo confocal scanning laser ophthalmoscopy (Figure 6). Alternatively, genetically encoded calcium indicators can be administered with viral vectors, eliminating the need for transgenic animals.60 The ability to detect changes in intracellular calcium of RGCs allows for an in vivo functional measure of assessing RGC damage.
Figure 6.
In vivo fluorescence imaging of the retina a transgenic mouse expressing GCaMP under the Thy-1 promoter (a) with baseline fluorescence in darkened room and (b) during exposure to UV light stimulus. Arrows indicate cells with decreased intracellular calcium and circles indicate cells with increased intracellular calcium during UV light exposure.
Currently, there is a large gap, both in the techniques and measures, between how we assess RGC damage in humans and in animals. Regardless of the technology or technique, it is important that RGC loss is measured reliably. Furthermore, it is important to develop techniques that are a true measure of RGC changes that can one day be used in the clinic.
Acknowledgments
This work was supported by the Canadian Institutes of Health Research and the Atlantic Canada Opportunities Agency.
References
- McKee JB, Elston J, Evangelou N, Gerry S, Fugger L, Kennard C et al. Amiloride Clinical Trial In Optic Neuritis (ACTION) protocol: a randomised, double blind, placebo controlled trial. BMJ Open 2015; 5: e009200. [DOI] [PMC free article] [PubMed] [Google Scholar]
- Sühs K-W, Hein K, Sättler MB, Görlitz A, Ciupka C, Scholz K et al. A randomized, double-blind, phase 2 study of erythropoietin in optic neuritis. Ann Neurol 2012; 72: 199–210. [DOI] [PubMed] [Google Scholar]
- Harwerth RS, Carter-Dawson L, Shen F, Smith EL, Crawford ML. Ganglion cell losses underlying visual field defects from experimental glaucoma. Invest Ophthalmol Vis Sci 1999; 40: 2242–2250. [PubMed] [Google Scholar]
- Harwerth RS, Wheat JL, Fredette MJ, Anderson DR. Linking structure and function in glaucoma. Prog Retin Eye Res 2010; 29: 249–271. [DOI] [PMC free article] [PubMed] [Google Scholar]
- Kerrigan-Baumrind LA, Quigley HA, Pease ME, Kerrigan DF, Mitchell RS. Number of ganglion cells in glaucoma eyes compared with threshold visual field tests in the same persons. Invest Ophthalmol Vis Sci 2000; 41(3): 741–748. [PubMed] [Google Scholar]
- Quigley HA, Dunkelberger GR, Green WR. Retinal ganglion cell atrophy correlated with automated perimetry in human eyes with glaucoma. Am J Ophthalmol 1989; 107: 453–464. [DOI] [PubMed] [Google Scholar]
- Harwerth RS, Quigley HA. Visual field defects and retinal ganglion cell losses in patients with glaucoma. Arch Ophthalmol 2006; 124(6): 853–859. [DOI] [PMC free article] [PubMed] [Google Scholar]
- Fortune B, Hardin C, Reynaud J, Cull G, Yang H, Wang L et al. Comparing optic nerve head rim width, rim area, and peripapillary retinal nerve fiber layer thickness to axon count in experimental glaucoma. Invest Ophthalmol Vis Sci 2016; 57: OCT404-412. [DOI] [PMC free article] [PubMed] [Google Scholar]
- Cull GA, Reynaud J, Wang L, Cioffi GA, Burgoyne CF, Fortune B. Relationship between orbital optic nerve axon counts and retinal nerve fiber layer thickness measured by spectral domain optical coherence tomography. Invest Ophthalmol Vis Sci 2012; 53: 7766–7773. [DOI] [PMC free article] [PubMed] [Google Scholar]
- Ogden TE. Nerve fiber layer of the primate retina: thickness and glial content. Vision Res 1983; 23: 581–587. [DOI] [PubMed] [Google Scholar]
- Patel NB, Sullivan-Mee M, Harwerth RS. The relationship between retinal nerve fiber layer thickness and optic nerve head neuroretinal rim tissue in glaucoma. Invest Ophthalmol Vis Sci 2014; 55: 713–743. [DOI] [PMC free article] [PubMed] [Google Scholar]
- Patel NB, Luo X, Wheat JL, Harwerth RS. Retinal nerve fiber layer assessment: area versus thickness measurements from elliptical scans centered on the optic nerve. Invest Ophthalmol Vis Sci 2011; 52: 2477–2489. [DOI] [PMC free article] [PubMed] [Google Scholar]
- Drance SM, King D. The neuroretinal rim in descending optic atrophy. Graefes Arch Clin Exp Ophthalmol 1992; 230(2): 154–157. [DOI] [PubMed] [Google Scholar]
- Sigal IA, Yang H, Roberts MD, Burgoyne CF, Downs JC. IOP-induced lamina cribrosa displacement and scleral canal expansion: an analysis of factor interactions using parameterized eye-specific models. Invest Ophthalmol Vis Sci 2011; 52(3): 1896–1907. [DOI] [PMC free article] [PubMed] [Google Scholar]
- Vianna JR, Danthurebandara VM, Sharpe GP, Hutchison DM, Belliveau AC, Shuba LM et al. Importance of normal aging in estimating the rate of glaucomatous neuroretinal rim and retinal nerve fiber layer loss. Ophthalmology 2015; 122: 2392–2398. [DOI] [PubMed] [Google Scholar]
- Reis ASC, O'Leary N, Stanfield MJ, Shuba LM, Nicolela MT, Chauhan BC. Laminar displacement and prelaminar tissue thickness change after glaucoma surgery imaged with optical coherence tomography. Invest Opthalmol Vis Sci 2012; 53: 5819. [DOI] [PubMed] [Google Scholar]
- He L, Yang H, Gardiner SK, Williams G, Hardin C, Strouthidis NG et al. Longitudinal detection of optic nerve head changes by spectral domain optical coherence tomography in early experimental glaucoma. Invest Ophthalmol Vis Sci 2014; 55(1): 574–586. [DOI] [PMC free article] [PubMed] [Google Scholar]
- Strouthidis NG, Fortune B, Yang H, Sigal IA, Burgoyne CF. Longitudinal change detected by spectral domain optical coherence tomography in the optic nerve head and peripapillary retina in experimental glaucoma. Invest Ophthalmol Vis Sci 2011; 52(3): 1206–1219. [DOI] [PMC free article] [PubMed] [Google Scholar]
- Tan O, Li G, Lu AT-H, Varma R, Huang D Group AIfGS. Mapping of macular substructures with optical coherence tomography for glaucoma diagnosis. Ophthalmology 2008; 115: 949–956. [DOI] [PMC free article] [PubMed] [Google Scholar]
- Curcio CA, Allen KA. Topography of ganglion cells in human retina. J Comp Neurol 1990; 300(1): 5–25. [DOI] [PubMed] [Google Scholar]
- Tan O, Chopra V, Lu AT-H, Schuman JS, Ishikawa H, Wollstein G et al. Detection of macular ganglion cell loss in glaucoma by Fourier-domain optical coherence tomography. Ophthalmology 2009; 116: 2305–2314. [DOI] [PMC free article] [PubMed] [Google Scholar]
- Wang M, Hood DC, Cho J-S, Ghadiali Q, De Moraes CG, De Moraes GV et al. Measurement of local retinal ganglion cell layer thickness in patients with glaucoma using frequency-domain optical coherence tomography. Arch Ophthalmol 2009; 127: 875–881. [DOI] [PMC free article] [PubMed] [Google Scholar]
- Wässle H, Grünert U, Röhrenbeck J, Boycott BB. Cortical magnification factor and the ganglion cell density of the primate retina. Nature 1989; 341: 643–646. [DOI] [PubMed] [Google Scholar]
- Artes PH, Chauhan BC. Longitudinal changes in the visual field and optic disc in glaucoma. Prog Retin Eye Res 2005; 24(3): 333–354. [DOI] [PubMed] [Google Scholar]
- Medeiros FA, Zangwill LM, Alencar LM, Bowd C, Sample PA, Susanna R Jr et al. Detection of glaucoma progression with stratus OCT retinal nerve fiber layer, optic nerve head, and macular thickness measurements. Invest Ophthalmol Vis Sci 2009; 50(12): 5741–5748. [DOI] [PMC free article] [PubMed] [Google Scholar]
- Thanos S, Indorf L, Naskar R. In vivo FM: using conventional fluorescence microscopy to monitor retinal neuronal death in vivo. Trends Neurosci 2002; 25(9): 441–444. [DOI] [PubMed] [Google Scholar]
- Higashide T, Kawaguchi I, Ohkubo S, Takeda H, Sugiyama K. In vivo imaging and counting of rat retinal ganglion cells using a scanning laser ophthalmoscope. Invest Ophthalmol Vis Sci 2006; 47(7): 2943–2950. [DOI] [PubMed] [Google Scholar]
- Chauhan BC, Pan J, Archibald ML, LeVatte TL, Kelly ME, Tremblay F. Effect of intraocular pressure on optic disc topography, electroretinography, and axonal loss in a chronic pressure-induced rat model of optic nerve damage. Invest Ophthalmol Vis Sci 2002; 43(9): 2969–2976. [PubMed] [Google Scholar]
- Horio N, Kachi S, Hori K, Okamoto Y, Yamamoto E, Terasaki H et al. Progressive change of optical coherence tomography scans in retinal degeneration slow mice. Arch Ophthalmol 2001; 119(9): 1329–1332. [DOI] [PubMed] [Google Scholar]
- Huber G, Beck SC, Grimm C, Sahaboglu-Tekgoz A, Paquet-Durand F, Wenzel A et al. Spectral domain optical coherence tomography in mouse models of retinal degeneration. Invest Ophthalmol Vis Sci 2009; 50(12): 5888–5895. [DOI] [PMC free article] [PubMed] [Google Scholar]
- Gabriele ML, Ishikawa H, Schuman JS, Bilonick RA, Kim J, Kagemann L et al. Reproducibility of spectral-domain optical coherence tomography total retinal thickness measurements in mice. Invest Ophthalmol Vis Sci 2010; 51(12): 6519–6523. [DOI] [PMC free article] [PubMed] [Google Scholar]
- Kanamori A, Catrinescu M-M, Traistaru M, Beaubien R, Levin LA. In vivo imaging of retinal ganglion cell axons within the nerve fiber layer. Invest Ophthalmol Vis Sci 2010; 51(4): 2011–2018. [DOI] [PubMed] [Google Scholar]
- Cordeiro MF, Guo L, Luong V, Harding G, Wang W, Jones HE et al. Real-time imaging of single nerve cell apoptosis in retinal neurodegeneration. Proc Natl Acad Sci USA 2004; 101(36): 13352–13356. [DOI] [PMC free article] [PubMed] [Google Scholar]
- Nadal-Nicolas FM, Salinas-Navarro M, Vidal-Sanz M, Agudo-Barriuso M. Two methods to trace retinal ganglion cells with fluorogold: from the intact optic nerve or by stereotactic injection into the optic tract. Exp Eye Res 2015; 131: 12–19. [DOI] [PubMed] [Google Scholar]
- Köbbert C, Apps R, Bechmann I, Lanciego JL, Mey J, Thanos S. Current concepts in neuroanatomical tracing. Prog Neurobiol 2000; 62(4): 327–351. [DOI] [PubMed] [Google Scholar]
- Salinas-Navarro M, Jimenez-Lopez M, Valiente-Soriano FJ, Alarcon-Martinez L, Aviles-Trigueros M, Mayor S et al. Retinal ganglion cell population in adult albino and pigmented mice: a computerized analysis of the entire population and its spatial distribution. Vision Res 2009; 49(6): 637–647. [DOI] [PubMed] [Google Scholar]
- Salinas-Navarro M, Mayor-Torroglosa S, Jimenez-Lopez M, Aviles-Trigueros M, Holmes TM, Lund RD et al. A computerized analysis of the entire retinal ganglion cell population and its spatial distribution in adult rats. Vision Res 2009; 49(1): 115–126. [DOI] [PubMed] [Google Scholar]
- Choe TE, Abbott CJ, Piper C, Wang L, Fortune B. Comparison of longitudinal in vivo measurements of retinal nerve fiber layer thickness and retinal ganglion cell density after optic nerve transection in rat. PLoS One 2014; 9(11): e113011. [DOI] [PMC free article] [PubMed] [Google Scholar]
- Abbott CJ, Choe TE, Lusardi TA, Burgoyne CF, Wang L, Fortune B. Evaluation of retinal nerve fiber layer thickness and axonal transport 1 and 2 weeks after 8 hours of acute intraocular pressure elevation in rats. Invest Ophthalmol Vis Sci 2014; 55(2): 674–687. [DOI] [PMC free article] [PubMed] [Google Scholar]
- Smith CA, Chauhan BC. Imaging retinal ganglion cells: Enabling experimental technology for clinical application. Prog Retin Eye Res 2015; 44: 1–14. [DOI] [PubMed] [Google Scholar]
- Leung CKS, Lindsey JD, Crowston JG, Ju W-K, Liu Q, Bartsch D-U et al. In vivo imaging of murine retinal ganglion cells. J Neurosci Methods 2008; 168(2): 475–478. [DOI] [PubMed] [Google Scholar]
- Walsh MK, Quigley HA. In vivo time-lapse fluorescence imaging of individual retinal ganglion cells in mice. J Neurosci Methods 2008; 169(1): 214–221. [DOI] [PMC free article] [PubMed] [Google Scholar]
- Feng G, Mellor RH, Bernstein M, Keller-Peck C, Nguyen QT, Wallace M et al. Imaging neuronal subsets in transgenic mice expressing multiple spectral variants of GFP. Neuron 2000; 28(1): 41–51. [DOI] [PubMed] [Google Scholar]
- Raymond ID, Vila A, Huynh UC, Brecha NC. Cyan fluorescent protein expression in ganglion and amacrine cells in a thy1-CFP transgenic mouse retina. Mol Vis 2008; 14: 1559–1574. [PMC free article] [PubMed] [Google Scholar]
- Chauhan BC, Stevens KT, Levesque JM, Nuschke AC, Sharpe GP, O'Leary N et al. Longitudinal in vivo imaging of retinal ganglion cells and retinal thickness changes following optic nerve injury in mice. PLoS One 2012; 7(6): e40352. [DOI] [PMC free article] [PubMed] [Google Scholar]
- Leung CK, Lindsey JD, Crowston JG, Lijia C, Chiang S, Weinreb RN. Longitudinal profile of retinal ganglion cell damage after optic nerve crush with blue-light confocal scanning laser ophthalmoscopy. Invest Ophthalmol Vis Sci 2008; 49(11): 4898–4902. [DOI] [PMC free article] [PubMed] [Google Scholar]
- Nakano N, Ikeda HO, Hangai M, Muraoka Y, Toda Y, Kakizuka A et al. Longitudinal and simultaneous imaging of retinal ganglion cells and inner retinal layers in a mouse model of glaucoma induced by N-Methyl-D-Aspartate. Invest Ophthalmol Vis Sci 2011; 52(12): 8754–8762. [DOI] [PubMed] [Google Scholar]
- Leung CKS, Lindsey JD, Chen L, Liu Q, Weinreb RN. Longitudinal profile of retinal ganglion cell damage assessed with blue-light confocal scanning laser ophthalmoscopy after ischaemic reperfusion injury. Br J Ophthalmol 2009; 93(7): 964–968. [DOI] [PMC free article] [PubMed] [Google Scholar]
- Murata H, Aihara M, Chen Y-N, Ota T, Numaga J, Araie M. Imaging mouse retinal ganglion cells and their loss in vivo by a fundus camera in the normal and ischemia-reperfusion model. Invest Ophthalmol Vis Sci 2008; 49(12): 5546–5552. [DOI] [PubMed] [Google Scholar]
- Wang X, Archibald ML, Stevens K, Baldridge WH, Chauhan BC. Cyan fluorescent protein (CFP) expressing cells in the retina of Thy1-CFP transgenic mice before and after optic nerve injury. Neurosci Lett 2010; 468(2): 110–114. [DOI] [PubMed] [Google Scholar]
- Oglesby E, Quigley HA, Zack DJ, Cone FE, Steinhart MR, Tian J et al. Semi-automated, quantitative analysis of retinal ganglion cell morphology in mice selectively expressing yellow fluorescent protein. Exp Eye Res 2012; 96(1): 107–115. [DOI] [PMC free article] [PubMed] [Google Scholar]
- Leung CK-S, Weinreb RN, Li ZW, Liu S, Lindsey JD, Choi N et al. Long-term in vivo imaging and measurement of dendritic shrinkage of retinal ganglion cells. Invest Ophthalmol Vis Sci 2011; 52(3): 1539–1547. [DOI] [PubMed] [Google Scholar]
- Kalesnykas G, Oglesby EN, Zack DJ, Cone FE, Steinhart MR, Tian J et al. Retinal ganglion cell morphology after optic nerve crush and experimental glaucoma. Invest Ophthalmol Vis Sci 2012; 53(7): 3847–3857. [DOI] [PMC free article] [PubMed] [Google Scholar]
- Tshilenge K-T, Ameline B, Weber M, Mendes-Madeira A, Nedellec S, Biget M et al. Vitrectomy prior to intravitreal injection of AAV2/2 vector promotes efficient transduction of retinal ganglion cells in dogs and non-human primates. Hum Gene Ther Methods 2016; 27(3): 122–134. [DOI] [PubMed] [Google Scholar]
- Boye SE, Alexander JJ, Witherspoon CD, Boye SL, Peterson JJ, Clark ME et al. Highly efficient delivery of adeno-associated viral vectors to the primate retina. Hum Gene Ther 2016; 27(8): 580–597. [DOI] [PMC free article] [PubMed] [Google Scholar]
- Boyd RF, Boye SL, Conlon TJ, Erger KE, Sledge DG, Langohr IM et al. Reduced retinal transduction and enhanced transgene-directed immunogenicity with intravitreal delivery of rAAV following posterior vitrectomy in dogs. Gene Ther 2016; 23(6): 548–556. [DOI] [PMC free article] [PubMed] [Google Scholar]
- Smith CA, Hooper ML, Farrell SR, Chauhan BC. Adeno-associated viral vector labeling of retinal ganglion cells for in vivo imaging. Invest Ophthalmol Vis Sci 2016; 57: (Abstract 1712). [Google Scholar]
- Chen Q, Cichon J, Wang W, Qiu L, Lee SJ, Campbell NR et al. Imaging neural activity using Thy1-GCaMP transgenic mice. Neuron 2012; 76(2): 297–308. [DOI] [PMC free article] [PubMed] [Google Scholar]
- Blandford SN, Farrell SR, Hooper ML, Chauhan BC, Baldridge WH. Retinal characterization of the Thy1-GCaMP3 mouse after optic nerve transection. Invest Ophthalmol Vis Sci 2016; 57: (Abstract 607). [DOI] [PubMed] [Google Scholar]
- Yin L, Masella B, Dalkara D, Zhang J, Flannery JG, Schaffer DV et al. Imaging light responses of foveal ganglion cells in the living macaque eye. J Neurosci 2014; 34(19): 6596–6605. [DOI] [PMC free article] [PubMed] [Google Scholar]


