

Abstract
Objective
Systematic reviews (SRs) often poorly report key information, thereby diminishing their usefulness. Previous studies evaluated published SRs and determined that they failed to meet explicit criteria or characteristics. The Preferred Reporting Items for Systematic Reviews and Meta-Analyses (PRISMA) statement was recommended as a reporting guideline for SR and meta-analysis (MA), but previous studies showed that adherence to the statement was not high for SRs published in different medical fields. Thus, the aims of this study are twofold: (1) to investigate the number of nursing journals that have required or recommended the use of the PRISMA statement for reporting SR, and (2) to examine the adherence of SRs and/or meta-analyses to the PRISMA statement published in nursing journals.
Design
A cross-sectional study.
Methods
Nursing journals listed in the ISI journal citation report were divided into 2 groups based on the recommendation of PRISMA statement in their ‘Instruction for Authors’. SRs and meta-analyses published in 2014 were searched in 3 databases. 37 SRs and meta-analyses were randomly selected in each group. The adherence of each item to the PRISMA was examined and summarised using descriptive statistics. The quality of the SRs was assessed by Assessing the Methodological Quality of Systematic Reviews. The differences between the 2 groups were compared using the Mann-Whitney U test.
Results
Out of 107 nursing journals, 30 (28.0%) recommended or required authors to follow the PRISMA statement when they submit SRs or meta-analyses. The median rates of adherence to the PRISMA statement for reviews published in journals with and without PRISMA endorsement were 64.9% (IQR: 17.6–92.3%) and 73.0% (IQR: 59.5–94.6%), respectively. No significant difference was observed in any of the items between the 2 groups.
Conclusions
The median adherence of SRs and meta-analyses in nursing journals to PRISMA is low at 64.9% and 73.0%, respectively. Nonetheless, the adherence level of nursing journals to the PRISMA statement does not significantly vary whether they endorse or recommend such a guideline.
Keywords: STATISTICS & RESEARCH METHODS, Systematic Review and meta-analyses, PRISMA
Strengths and limitations of this study.
This is the first study that evaluates the adherence of systematic reviews (SRs) in nursing journals to Preferred Reporting Items for Systematic Reviews and Meta-Analyses and Assessing the Methodological Quality of Systematic Reviews.
SRs published in non-nursing journals were not captured.
Only reviews published in 2014 were included.
Assessments were conducted based on the subjective evaluation of the reviews.
Background
As an important tool for summarising evidence, systematic reviews (SRs) can help healthcare professionals to evaluate the beneficial and harmful effects of behaviours and interventions by providing a basis to develop and revise clinical practice guidelines.1 However, SRs often poorly report key information and inevitably diminishes their soundness of scientific evidence.2 3 A previous study had empirically evaluated published reviews and determined that such reviews failed to meet the eight explicit scientific criteria, developed based on established guidelines,4 5 which were purpose, data identification, data selection, validity assessment, qualitative synthesis, quantitative synthesis, summary and future directions.6 Another study reported that published SR only fulfilled approximately one-third of the authors' predefined 23 characteristics, including 8 items in design, 2 in combinability, 4 in control of bias, 4 in statistical analysis, 3 in the sensitivity analysis and 2 in the application of results.7
The Preferred Reporting Items for Systematic Reviews and Meta-Analyses (PRISMA) statement is an evidence-based minimum set of items for reporting SRs and meta-analyses.1 8 9 This statement focuses on the reporting of reviews that evaluate randomised controlled trials but can also be used for reporting SRs of other types of research. Published in 2009, the PRISMA statement consists of 27 items and a flow chart in which the items pertain to the contents of an SR and meta-analysis (MA), including the title, abstract, methods, results, discussion and funding.1 8 One hundred and seventy-six general and specialty medical journals have formally endorsed the PRISMA statement and requested contributors follow PRISMA while reporting their SR. The list of the journals can be found in the PRISMA website.9 Some journals only recommend PRISMA to their contributors through ‘Instructions for Authors’ but do not formally endorse it on the PRISMA website.
The PRISMA statement is not the only reporting guideline used in healthcare research. The Consolidated Standards of Reporting Trials (CONSORT)10 is another commonly used guideline for randomised controlled trials. Developed in 1996, this guideline is currently endorsed by 585 general and specialty journals.11 Many studies have examined the endorsement and adherence of medical specialties to CONSORT,10 12–15 but only a few have performed so in accordance with the PRISMA statement.16–19
The PRISMA statement was published 6 years ago; thus, the time is appropriate to assess its impact on the quality of SRs in the nursing literature. The aim of this study is twofold: (1) to investigate the number of nursing journals that have endorsed or recommended the use of the PRISMA statement for reporting SRs and (2) to examine the adherence of published SRs to the statement.
Method and materials
Study design
A cross-sectional study was conducted by evaluating published SRs in nursing journals extracted from three scholarly databases.
Inclusion and exclusion criteria
Articles included in this study are self-proclaimed SRs or include the term ‘meta-analyses’ in the title or abstract, or both. Methodology papers, commentaries or letters on SRs or meta-analyses were excluded.
Search strategy
Nursing journals were first identified from the ‘Nursing Studies’ category in the Journal Citation Reports Science Edition 2013,20 which was the latest available version in early 2015. The selected journals were divided into two groups according to whether they recommend the PRISMA in their ‘Instruction for Authors’.
After classification, a database search was performed for each group of journals to identify the SRs; the final search was conducted in May 2015. Three databases, namely Cumulative Index of Nursing and Allied Health Literature, PubMed and Web of Science, were used in the search combined with journal titles and keywords. The keyword search included ‘systematic review’, ‘meta*analys*’ or ‘pooled analys*’, which were adopted to identify SRs and meta-analyses in another study.21 Only articles published in the whole 2014, the latest available year, were included in this study. The results from each database were imported to EndNote X7, and duplicate records were removed.
Selection of articles
The titles and abstracts of the articles were screened by two independent reviewers (ie, KKHL and PK) to select the eligible ones. Full texts of the articles were downloaded for further evaluation in case there were disagreements in the selection. Disagreements were then solved by consensus. When incongruities persisted, a third review author (WWST) was consulted.
Four-digit random numbers, generated using the RandBetween function in MS Excel, were assigned to the selected studies. The studies were sorted in ascending order according to the random numbers.
Outcomes
The quality of reporting of the included reviews was assessed according to their adherence to the PRISMA statement, while the quality of the reviews was assessed using the Assessing the Methodological Quality of Systematic Reviews (AMSTAR).22 AMSTAR is a validated and reliable instrument that helps users to differentiate SRs in terms of their methodological quality and expert consensus. Details of AMSTAR are reported elsewhere.23 All studies were assessed by two independent reviewers (KKHL and PK), and discrepancies in the assessments were resolved by joint discussion. The adherence level for each item was rated as either 1 (Yes), 2 (No) or 3 (Not Applicable). The main outcomes of the study were overall adherence to the PRISMA and AMSTAR checklists.
Sample size consideration
Considering the 95% CIs reported in Table 1 of Panic et al's,16 we back-calculated the SD for each group (ranging from 15.0 to 18.0) and took the smallest one for our sample size calculation. Given that the largest difference between the two groups reported by Panic et al was 8, we further assumed 10 to be a meaningful difference in the mean total adherence between the two groups of journals to the PRISMA statement in our study. Therefore, a sample size of 37 articles per group was needed to detect the difference at 5% significance level and 80% power.24 The first 37 studies from the magnitude of the random numbers in each group were selected for evaluation.
Statistical data analyses
Frequencies, percentages, median and IQR were used to summarise the findings. χ2 test was performed to examine the adherence of the items to the PRISMA statement and AMSTAR guidelines. Expressed as the percentage, the difference of the total adherence between the groups was examined through the Mann-Whitney U test. All statistical tests were conducted using IBM SPSS Statistics 24, with 5% significance level.
Results
A total of 107 journals were identified from the Journal Citation Reports (see online supplementary table S1), and 30 (28.0%) of them recommended (20 journals) or required (10 journals) authors to follow the PRISMA statement for submitting SRs or meta-analyses. All journals were divided into two groups, in which Group A comprised journals with PRISMA recommendation/requirement (n=30) and Group B comprised those without (n=77). Database search was performed in which 512 and 558 articles were identified for Groups A and B, respectively. After duplicate articles and those from inappropriate journals (ie, those with names similar to the identified journals; eg, ‘Heart and Lung’ is a journal under the nursing category while ‘Heart, Lung and Vessels’ is not) were removed, 462 and 487 articles in the two groups were evaluated for eligibility by title and abstract screening. Finally, 119 and 124 articles were included in Groups A and B, respectively. A total of 37 articles were randomly selected from the final number of selected articles (figure 1; a full list of the 74 articles is available in online supplementary table S2). Table 1 summarises the characteristics of all 74 studies.
Figure 1.
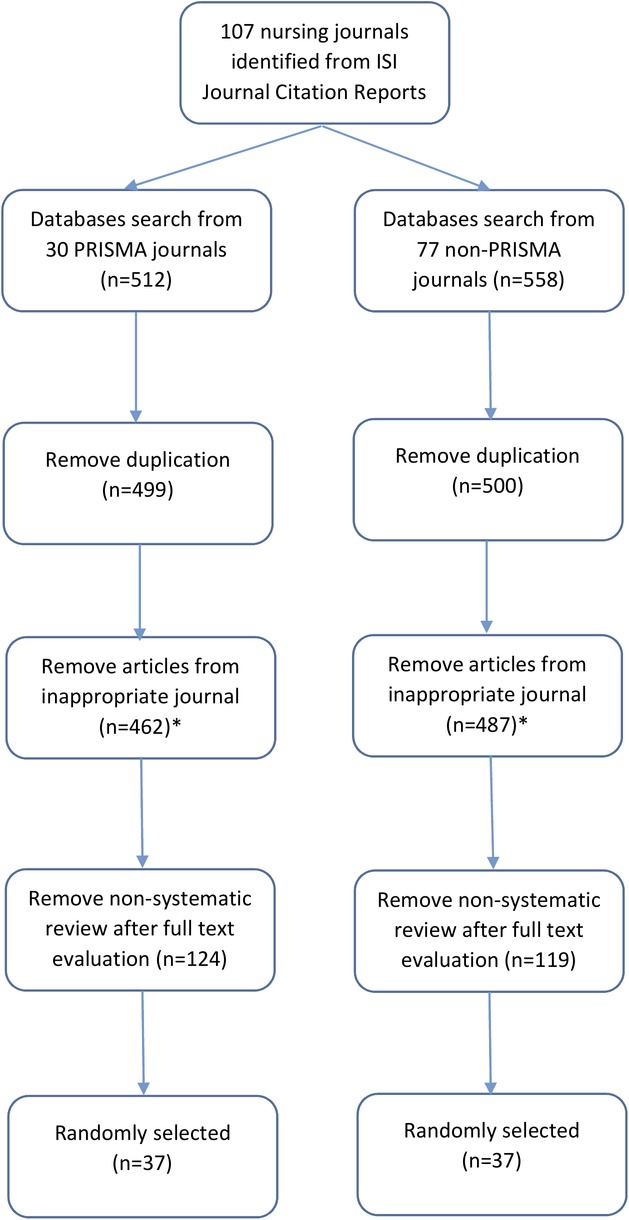
Flow chart for studies selection.
Table 1.
Characteristics of the 74 reviews included in this study
| Group A | Group B | |
|---|---|---|
| First author's country of affiliation (pChi=0.06) | ||
| Australia and Asia | 14 (37.8%) | 7 (18.9%) |
| Australia | 6 | 3 |
| China | 1 | 2 |
| Iran | 1 | 0 |
| Pakistan | 0 | 1 |
| New Zealand | 1 | 0 |
| Singapore | 1 | 0 |
| South Korea | 2 | 1 |
| Taiwan | 2 | 0 |
| Europe | 11 (29.7%) | 8 (21.6%) |
| Belgium | 2 | 1 |
| Demark | 0 | 1 |
| Finland | 3 | 0 |
| Germany | 1 | 1 |
| Norway | 1 | 1 |
| Sweden | 0 | 2 |
| UK and Ireland | 4 | 2 |
| America | 12 (32.4%) | 22 (59.5%) |
| Brazil | 4 | 0 |
| Canada | 0 | 2 |
| USA | 8 | 20 |
| Topic of the review (pChi=0.253) | ||
| Diseases-related | 24 (64.8%) | 26 (70.2%) |
| Cardiology | 1 | 4 |
| Endocrinology | 2 | 0 |
| Geriatric | 2 | 4 |
| Maternal and child health | 4 | 1 |
| Mental health | 2 | 2 |
| Oncology | 3 | 8 |
| Oral health | 2 | 0 |
| Paediatric and adolescent health | 2 | 2 |
| Surgery | 1 | 3 |
| Others | 5 | 2 |
| Nursing education or practice | 10 (27.0%) | 5 (13.5%) |
| Others | 3 (8.1%) | 6 (16.2%) |
| Number of papers included in the review (pChi=0.517) | ||
| 1–10 | 9 (24.3%) | 12 (32.4%) |
| 11–20 | 17 (45.7%) | 12 (32.4%) |
| 21 or more | 11 (29.7%) | 12 (32.4%)* |
| Median (range) | 15 (3-75) | 12.5 (1-137) |
*One review did not state the number of papers included in the review.
bmjopen-2016-013905supp_table1-journals.pdf (24.4KB, pdf)
bmjopen-2016-013905supp_table2-articles.pdf (120.7KB, pdf)
In terms of the affiliation of the first author, 14 (37.4%), 11 (29.7%) and 12 (32.4%) articles in Group A and 7 (18.9%), 8 (21.6%) and 22 (59.5%) articles in Group B were from Australia and Asia, Europe and America, respectively. No significant difference in the distribution of author affiliations was detected. The disease-related topics have contributed to 24 (64.8%) articles in Group A and 26 (70.2%) articles in Group B. Table 1 illustrates the breakdown of these diseases. The median numbers of articles included in each review were 15 in Group A and 12.5 in Group B. In Group A, 12 (32.4%) reported that they followed PRISMA guideline, while only 8 (21.6%) articles in Group B did (p=0.295).
Table 2 compares the adherence of the groups on the individual items of the PRISMA statement. The median of the overall adherence of the reviews to the 27 items to the PRISMA checklist was 55.6% (IQR: 48.2–61.1%) for Group A and 59.3% (IQR: 48.2–64.8%) for Group B with no significant difference (pMW=0.617). The median adherence of Group A to the PRISMA was 64.9% (17.6–92.3%) and that of Group B was 73.7% (IQR: 59.5–94.6%) after withdrawing those ‘not applicable’ items in computation with no significant difference (pMW=0.576).
Table 2.
Summary table for PRISMA comparison
| Items | Group A |
Group B |
|||||
|---|---|---|---|---|---|---|---|
| Yes | No | NA | Yes | No | NA | p-value | |
| 1. Identify the report as a systematic review, meta-analysis or both in title | 30 (81.1%) | 7 (18.9%) | 0 (0.0%) | 29 (78.4%) | 8 (21.6%) | 0 (0.0%) | 0.727 |
| 2. Provide a structured summary including, as applicable: background; objectives; data sources; study eligibility criteria, participants, and interventions; study appraisal and synthesis methods; results; limitations; conclusions and implications of key findings; systematic review registration number | 37 (100%) | 0 (0.0%) | 0 (0.0%) | 37 (100%) | 0 (0.0%) | 0 (0.0%) | 1 |
| 3. Describe the rationale for the review in the context of what is already known | 37 (100%) | 0 (0.0%) | 0 (0.0%) | 37 (100%) | 0 (0.0%) | 0 (0.0%) | 1 |
| 4. Provide an explicit statement of questions being addressed with reference to participants, interventions, comparisons, outcomes and study design (PICOS) | 37 (100%) | 0 (0.0%) | 0 (0.0%) | 35 (94.6%) | 2 (5.4%) | 0 (0.0%) | 0.152 |
| 5. Indicate if a review protocol exists, if and where it can be accessed (eg, Web address), and, if available, provide registration information including registration number |
1 (2.7%) | 36 (97.3%) | 0 (0.0%) | 1 (2.7%) | 36 (97.3%) | 0 (0.0%) | 1 |
| 6. Specify study characteristics (eg, PICOS, length of follow-up) and report characteristics (eg, years considered, language, publication status) used as criteria for eligibility, giving rationale | 36 (97.3%) | 1 (2.7%) | 0 (0.0%) | 34 (91.9%) | 3 (8.1%) | 0 (0.0%) | 0.304 |
| 7. Describe all information sources (eg, databases with dates of coverage, contact with study authors to identify additional studies) in the search and date last searched | 37 (100%) | 0 (0.0%) | 0 (0.0%) | 36 (97.3%) | 1 (2.7%) | 0 (0.0%) | 0.314 |
| 8. Present full electronic search strategy for at least one database, including any limits used, such that it could be repeated | 5 (13.5%) | 32 (86.5%) | 0 (0.0%) | 4 (10.8%) | 33 (89.2%) | 0 (0.0%) | 0.722 |
| 9. State the process for selecting studies (ie, screening, eligibility, included in systematic review, and, if applicable, included in the meta-analysis) | 37 (100%) | 0 (0.0%) | 0 (0.0%) | 35 (94.6%) | 2 (5.4%) | 0 (0.0%) | 0.152 |
| 10. Describe method of data extraction from reports (eg, piloted forms, independently, in duplicate) and any processes for obtaining and confirming data from investigators | 14 (37.8%) | 23 (62.2) | 0 (0.0%) | 22 (59.4%) | 15 (40.6%) | 0 (0.0%) | 0.063 |
| 11. List and define all variables for which data were sought (eg, PICOS, funding sources) and any assumptions and simplifications made | 24 (64.9%) | 13 (35.1%) | 0 (0.0%) | 30 (81.1%) | 7 (18.9%) | 0 (0.0%) | 0.116 |
| 12. Describe methods used for assessing risk of bias of individual studies (including specification of whether this was performed at the study or outcome level), and how this information is to be used in any data synthesis | 23 (62.2%) | 14 (37.8%) | 0 (0.0%) | 22 (59.5%) | 15 (40.6%) | 0 (0.0%) | 0.812 |
| 13. State the principal summary measures (eg, risk ratio, difference in means) | 8 (21.6%) | 1 (2.7%) | 28 (75.7%) | 8 (21.6%) | 0 (0.0%) | 29 (78.4%) | 0.601 |
| 14. Describe the methods of handling data and combining results of studies, if performed, including measures of consistency (eg, I2) for each meta-analysis | 6 (16.2%) | 2 (5.4%) | 29 (78.4%) | 8 (21.6%) | 0 (0.0%) | 29 (78.4%) | 0.319 |
| 15. Specify any assessment of risk of bias that may affect the cumulative evidence (eg, publication bias, selective reporting within studies) | 3 (8.1%) | 5 (13.5%) | 29 (78.4%) | 4 (10.8%) | 4 (10.8%) | 29 (78.4%) | 0.881 |
| 16. Describe methods of additional analyses (eg, sensitivity or subgroup analyses, meta-regression), if performed, indicating which were prespecified | 3 (8.1%) | 5 (13.5%) | 29 (78.4%) | 6 (16.2%) | 3 (8.1%) | 28 (75.7%) | 0.468 |
| 17. Give numbers of studies screened, assessed for eligibility and included in the review, with reasons for exclusions at each stage, ideally with a flow diagram | 35 (94.6%) | 2 (5.4%) | 0 (0.0%) | 33 (89.2%) | 4 (10.8%) | 0 (0.0%) | 0.394 |
| 18. For each study, present characteristics for which data were extracted (eg, study size, PICOS, follow-up period) and provide the citations | 34 (91.9%) | 3 (8.1%) | 0 (0.0%) | 29 (78.4%) | 8 (21.6%) | 0 (0.0%) | 0.102 |
| 19. Present data on risk of bias of each study and, if available, any outcome-level assessment (see Item 12) | 16 (43.2%) | 21 (56.8%) | 0 (0.0%) | 17 (45.9%) | 20 (54.1%) | 0 (0.0%) | 0.815 |
| 20. For all outcomes considered (benefits or harms), present, for each study: (a) simple summary data for each intervention group and (b) effect estimates and CIs, ideally with a forest plot | 8 (21.6%) | 0 (0.0%) | 29 (78.4%) | 8 (21.6%) | 1 (2.7%) | 28 (75.7%) | 0.601 |
| 21. Present results of each meta-analysis performed, including CIs and measures of consistency | 7 (18.9%) | 1 (2.7%) | 29 (75.7%) | 8 (21.6%) | 1 (2.7%) | 28 (75.7%) | 0.959 |
| 22. Present results of any assessment of risk of bias across studies (see Item 15) | 3 (8.1%) | 5 (13.5%) | 29 (78.4%) | 2 (5.4%) | 7 (18.9%) | 28 (75.7%) | 0.759 |
| 23. Give results of additional analyses, if performed (eg, sensitivity or subgroup analyses, meta-regression (see Item 16)) | 3 (8.1%) | 5 (13.5%) | 29 (78.4%) | 3 (8.1%) | 6 (16.2%) | 28 (75.7%) | 0.947 |
| 24. Summarise the main findings including the strength of evidence for each main outcome; consider their relevance to key groups (eg, healthcare providers, users and policymakers) | 36 (97.3%) | 1 (2.7%) | 0 (0.0%) | 35 (94.6%) | 2 (5.4%) | 0 (0.0%) | 0.557 |
| 25. Discuss limitations at study and outcome level (eg, risk of bias), and at review level (eg, incomplete retrieval of identified research, reporting bias) | 25 (67.6%) | 12 (32.4%) | 0 (0.0%) | 27 (73.0%) | 10 (27.0%) | 0 (0.0%) | 0.611 |
| 26. Provide a general interpretation of the results in the context of other evidence, and implications for future research | 37 (100%) | 0 (0.0%) | 0 (0.0%) | 36 (97.3%) | 1 (2.7%) | 0 (0.0%) | 0.314 |
| 27. Describe sources of funding for the systematic review and other support (eg, supply of data); role of funders for the systematic review | 25 (67.6%) | 12 (32.4%) | 0 (0.0%) | 27 (73.0%) | 10 (27.0%) | 0 (0.0%) | 0.611 |
| Overall—median (IQR) | 55.6% (48.2–61.1%) | 59.3% (48.2–64.8%) | |||||
| Overall without counting the NA items—median (IQR) | 64.9% (17.6–92.3%) | 73.0% (59.5–94.6%) | |||||
Some of the items in the PRISMA related to statistical analysis or MA may not be appropriate for qualitative reviews or reviews without meta-analyses. Thus, subgroup analysis was conducted by removing the eight items that were not relevant to all SRs (ie, items 13–16 and 20–23). After such removal, the median of the overall adherence of the remaining 19 items became 75% (IQR: 65–80%) for Group A and 80% (IQR: 65–80%) for Group B (pMN=0.678).
Table 3 demonstrates the comparison of the adherence of journals to the individual items of the AMSTAR checklist. The median adherence for the 11 items was 8.1% in Group A and 8.1% in Group B. Only item 6 (‘Were the characteristics of the included studies provided?’) received an adherence level higher than 50%. The median of the overall adherence of the reviews to the AMSTAR checklist was 18.2% (IQR: 9.1–27.3%) for Group A and 18.2% (IQR: 9.1–18.2%) for Group B with no significant difference (pMW=0.494).
Table 3.
Summary table AMSTAR
| Group A |
Group B |
||||||
|---|---|---|---|---|---|---|---|
| Items | Yes | No | NA | Yes | No | NA | p-value |
| 1. Was an ‘a priori’ design provided? | 1 (2.7%) | 36 (97.3%) | 0 (0.0%) | 0 (0.0%) | 37 (100%) | 0 (0.0%) | 1.00^ |
| 2. Was there duplicate study selection and data extraction? | 6 (16.2%) | 31 (83.8%) | 0 (0.0%) | 6 (16.2%) | 31 (83.8%) | 0 (0.0%) | 1.00^ |
| 3. Was a comprehensive literature search performed? | 8 (27.6%) | 29 (78.4%) | 0 (0.0%) | 7 (18.9%) | 30 (81.1%) | 0 (0.0%) | 0.772 |
| 4. Was the status of publication (ie, grey literature) used as an inclusion criterion? | 5 (13.5%) | 32 (86.5%) | 0 (0.0%) | 3 (8.1%) | 34 (91.9%) | 0 (0.0%) | 0.771 |
| 5. Was a list of studies (included and excluded) provided? | 0 (0.0%) | 37 (100%) | 0 (0.0%) | 0 (0.0%) | 37 (100%) | 0 (0.0%) | NA |
| 6. Were the characteristics of the included studies provided? | 34 (91.9%) | 3 (8.1%) | 0 (0.0%) | 29 (78.4%) | 8 (27.6%) | 0 (0.0%) | 0.102 |
| 7. Was the scientific quality of the included studies assessed and documented? | 14 (37.8%) | 23 (62.2%) | 0 (0.0%) | 14 (37.8%) | 23 (62.2%) | 0 (0.0%) | 1.00 |
| 8. Was the scientific quality of the included studies used appropriately in formulating conclusions? | 3 (8.1%) | 34 (91.9%) | 0 (0.0%) | 5 (13.5%) | 32 (86.5%) | 0 (0.0%) | 0.711^ |
| 9. Were the methods used to combine the findings of studies appropriate? | 3 (8.1%) | 3 (8.1%) | 31 (83.7%) | 2 (5.4%) | 6 (16.2%) | 29 (7.8%) | 0.531 |
| 10. Was the likelihood of publication bias assessed? | 3 (8.1%) | 3 (8.1%) | 31 (83.7%) | 2 (5.4%) | 6 (16.2%) | 29 (7.8%) | 0.531 |
| 11. Was the conflict of interest included? | 0 (0.0%) | 37 (100%) | 0 (0.0%) | 0 (0.0%) | 37 (100%) | 0 (0.0%) | NA |
| Overall—median (IQR) | 18.2% (9.1–21.3%) | 18.2% (9.1–18.2%) | |||||
^p-value computed by Fisher's exact test.
Discussion
Our findings show that 28% (30/107) of nursing journals endorsed or recommended the PRISMA statement in their ‘Instruction for Authors’. This percentage is similar to that previously reported for internal and specialty medical journals (27%, 40/146).17 The findings generally conform to the endorsement of other reporting guidelines. For example, a recent study reported that among 15 top nursing journals, 7 (46.7%) promoted the CONSORT statement. The PRISMA website was cross-checked for this study. Among the 107 nursing journals, only 2 formally endorsed the PRISMA, namely the Journal of the American Academy of Nurse Practitioners and Nursing Research.9
The median overall adherence of Groups A and B to the 27 items of the PRISMA statement was 55.6% and 59.3%, respectively. Without the eight items on MA, the median adherence of the two groups was 75% and 80%, slightly lower than the values reported for gastroenterology and hepatology journals (83.1–91.1%),16 and radiology journals (83.7%)19 but comparable to those reported for otorhinolaryngology journals.25 One reason was that four items (ie, items 5, 8, 12 and 19) in the guideline obtained a relatively low adherence rating among nursing journals.
Item 5 is about the existence of a research protocol for SRs. This study determined that among the 74 SRs, only 2 (2.7%) mentioned their research protocols. Although research protocol is common or even necessary to obtain ethics approval, a protocol for SRs is less popular not only in nursing research but also in medical research. For example, Panic et al16 reported that only 4 (4.4%) out of 90 SRs in gastroenterology and hepatology journals, 15% of SRs in radiology journals19 and 27% of the reviews in orthodontic journals18 mentioned research protocols. Nevertheless, a protocol is important because it prespecifies the objectives and methods of an SR,1 and a well-developed protocol ensures that valuable resources and time can be used appropriately.26 The preparation of a protocol for SR is required for several journals, such as Cochrane Database for Systematic Reviews.
Among the 74 SRs, only 9 (12.2%) adhered to item 8 (‘Present full electronic search strategy for at least one database’) of the PRISMA, although more than 80% of medical journals adhere to this item.18 19 A search strategy is an essential part of a review because it allows interested readers to assess the comprehensiveness and completeness of the search and replicate it.1 Without the full search strategy, readers and reviewers are unable to judge the quality of the search in the review, and the usefulness of such review will diminish.
Items 12 and 19 are related to the assessment of the risks of bias for individual studies, and the adherence of Groups A and B to these items was 60.8% and 44.5%, respectively, though other specialty journals have higher adherence (75%) to these items.16 18 19 Defined as the risk of ‘a systematic error or deviation from the truth, in results, or inferences’, the risk of bias corresponds to the internal validity of a study.27 Assessing such risk is part of measuring the strength of a body of evidence. Thus, this assessment is a crucial component of SR because it can be used as a threshold for study selection, a guide for qualitative and quantitative syntheses and a basis for interpreting heterogeneous findings.27 The lack of such assessment of the risk of bias may affect the internal validity of research findings.
Although no statistical difference was observed in the adherence between the two groups, the median adherence rate of SRs in Group A was lower than in Group B. As presented in table 2, the adherence rates of 16 out of the 27 items in Group A were the same or higher than those in Group B, and the difference of the adherence rate was >5% only for two items, namely items 10 and 11. Item 10 was the description of the data extraction method, while item 11 was about listing or defining variables. Since data extraction and variables are essential to any study, the authors of the articles would have conducted these steps. However, the authors might have thought these steps were less important and, therefore, did not clearly state them. It also reflects the importance of following a standard guideline to report the findings. In fact, some journals request the authors of SRs and meta-analyses to submit their manuscripts with the PRISMA checklist in which the page numbers for each item should be indicated.
With regard to AMSTAR, 9 out of the 11 items had adherence level lower than 20% except for items 6 and 7. The adherence levels of nursing journals to items 4 (‘Was the status of publication (ie, grey literature) used as an inclusion criterion?’) and 10 (‘Was the likelihood of publication bias assessed?’) were low, similar to those of other specialty journals.19 28 Several items, including items 3 (‘Was a list of studies (included and excluded) provided?’) and 5 (‘Was a list of studies (included and excluded) provided?’), also had a relatively low adherence level among nursing journals (<20%), despite the high adherence to these items by other specialty journals (>80%).16 18 19 The issue of low AMSTAR score was also reported in other studies.29 30
The inappropriate conduct or reporting of SRs may be the reason for the comparatively low adherence level to PRISMA and AMSTAR. The proper conduct of SRs entails the application of explicitly predefined systematic approaches to formulate the research question, study the eligibility criteria, develop the search strategy conduct study selection and data extraction, assess the risk of bias or methodological quality of included studies perform data synthesis and analysis and grade the overall quality of evidence.31 Each step requires the application of specific knowledge and skills, but previous nursing curricula have focused mainly on the first few steps.32 Thus, the training of some nursing scholars may not have been adequate for a proper SR,33 which explains why the quality of reviews varies. The adherence level to PRISMA and AMSTAR did not differ with the inclusion of PRISMA in the author information. As only 10 out of 30 journals have adhered to the PRISMA statement, a possibility is that some authors do not adhere to the guidelines if journals only encourage them to do so.
Additionally, although MA has been included in most evidence-based practice modules in nursing curricula, many students fail to completely understand MA statistical techniques or the various important concepts that underpin.34 This study found that 57 out of 74 (∼77%) SRs did not include any meta-analyses, which may have originated from the extremely limited technique to pool data from individual studies. Another possibility is that some topics struggle to synthesise quantitative evidence, such as the review of qualitative studies. However, data pooling is feasible on some topics such as breast feeding and childhood obesity, but the authors in our included studies did not attempt it.35
Although scholars conduct their reviews properly, important information may still be overlooked if they refuse to follow a guideline. While some nursing journals recommend that authors follow the PRISMA statement for their SRs, the authors can still submit their reviews even when their studies do not follow the PRISMA style. In contrast, many medical journals, including the British Medical Journal36 and Medicine,37 not only request authors to follow PRISMA but also require them to submit the PRISMA checklist with the corresponding page number for each item to ensure that such reviews are PRISMA-compliant.
Strength and limitation
To the best of our knowledge, this study is the first to evaluate the adherence of SRs in nursing journals to PRISMA and AMSTAR. A systematic approach was adopted to reduce any potential bias in reviewing. This study has several limitations. First, SRs published in non-nursing journals were not captured. For example, an MA, conducted by all nursing faculty in evaluating the beneficial effects of physical activity on cancer survivors,38 published in a medical journal that requested all SRs to be reported according to the PRISMA; therefore, it would expect that the adherence of these papers should be higher and in fact the adherence of this article was 96.3% (ie, 26 out of 27 item). Second, only reviews published in 2014 (the latest available full year) were included, which may introduce bias. Third, the SRs were assessed based on the subjective evaluation of the published reviews; thus, the bias was incompletely ruled out because the quality assessment was conducted by two independent investigators. Fourth, most of the included reviews had no MA; thus, several items in the PRISMA may not be suitable for them. Nevertheless, although a few items were removed from the guideline, the adherence of the reviews in nursing journals was still low compared with that of the reviews in other specialty journals. Finally, we adopted a database search approach instead of hand searching each journal, which could result in overlooking eligible studies. As a sensitivity analysis, hand searching was conducted for two included journals, namely ‘Heart and Lung’ and ‘Journal of Nursing Research’ to identify potential SRs and/or meta-analyses. In fact, all SRs and/or meta-analyses identified in the hand searching (three in Heart and Lung and two in Journal of Nursing Research) were also identified in the database search.
In conclusion, the adherence of SRs in nursing journals to PRISMA is comparable to otorhinolaryngology journals but lower than gastroenterology, hepatology and radiology journals. The adherence level of nursing journals to PRISMA does not significantly vary whether they endorse or recommend such guideline. As previous studies suggested, the requirement of following the guidelines in the ‘Instructions for Authors’ may increase the quality of reporting and methodology.39 40 Thus, nursing journals should require authors to follow PRISMA as their reporting guideline for SRs.
Footnotes
Contributors: WWST and KKHL designed the study and conducted the search, KKHL and PK screened and selected the articles, WWST, KKHL and PK evaluated the articles, WWST conducted the analysis and WWST, KKHL and PK drafted the manuscript.
Funding: The project was partly supported by the University Start-up Grant (NUHSRO/2014/101/SU/01) of the first author.
Disclaimer: The funding body did not play any role in the design of the study and collection, analysis and interpretation of data and in writing the manuscript.
Competing interests: None declared.
Provenance and peer review: Not commissioned; externally peer reviewed.
Data sharing statement: The data from this study were extracted from published articles in peer-reviewed journals. The list of the articles was uploaded as online supplementary file.
References
- 1.Liberati A, Altman DG, Tetzlaff J et al. . The PRISMA statement for reporting systematic reviews and meta-analyses of studies that evaluate health care interventions: explanation and elaboration. Ann Intern Med 2009;151:W65–94. 10.7326/0003-4819-151-4-200908180-00136 [DOI] [PubMed] [Google Scholar]
- 2.Dixon E, Hameed M, Sutherland F et al. . Evaluating meta-analyses in the general surgical literature: a critical appraisal. Ann Surg 2005;241:450–9. 10.1097/01.sla.0000154258.30305.df [DOI] [PMC free article] [PubMed] [Google Scholar]
- 3.Moher D, Tetzlaff J, Tricco AC et al. . Epidemiology and reporting characteristics of systematic reviews. PLoS Med 2007;4:e78 10.1371/journal.pmed.0040078 [DOI] [PMC free article] [PubMed] [Google Scholar]
- 4.Light RJ, Pillemer DB. Summing up: the science of reviewing research. Cambridge, MA: Harvard University Press, 1984. [Google Scholar]
- 5.Mullen PD, Ramirez G. Information synthesis and meta-analysis. Advances in health education and promotion. Greenwich: Jai Press, 1986. [Google Scholar]
- 6.Mulrow CD. The medical review article: state of the science. Ann Intern Med 1987;106:485–8. 10.7326/0003-4819-106-3-485 [DOI] [PubMed] [Google Scholar]
- 7.Sacks HS, Berrier J, Reitman D et al. . Meta-analyses of randomized controlled trials. N Engl J Med 1987;316:450–5. 10.1056/NEJM198702193160806 [DOI] [PubMed] [Google Scholar]
- 8.Moher D, Liberati A, Tetzlaff J et al. . Preferred reporting items for systematic reviews and meta-analyses: the PRISMA statement. PLoS Med 2009;6:e1000097 10.1371/journal.pmed.1000097 [DOI] [PMC free article] [PubMed] [Google Scholar]
- 9.PRISMA. PRISMA transparent reporting of systematic reviews and meta-analyses. 2015. http://www.prisma-statement.org/Endorsement/EndorsePRISMA.aspx
- 10.Hopewell S, Altman DG, Moher D et al. . Endorsement of the CONSORT Statement by high impact factor medical journals: a survey of journal editors and journal ‘Instructions to Authors’. Trials 2008;9:20. [DOI] [PMC free article] [PubMed] [Google Scholar]
- 11.CONSORT. CONSORT transparent reporting of trials. 2015. http://www.consort-statement.org/about-consort/endorsers
- 12.Knobloch K, Yoon U, Vogt PM. Endorsement of the CONSORT and STROBE statements for plastic surgical clinical trials. Ann Plast Surg 2011;66:321 10.1097/SAP.0b013e3181d3f29b [DOI] [PubMed] [Google Scholar]
- 13.Jull A, Aye PS. Endorsement of the CONSORT guidelines, trial registration, and the quality of reporting randomised controlled trials in leading nursing journals: a cross-sectional analysis. Int J Nurs Stud 2015;52:1071–9. 10.1016/j.ijnurstu.2014.11.008 [DOI] [PubMed] [Google Scholar]
- 14.Altman DG. Endorsement of the CONSORT statement by high impact medical journals: survey of instructions for authors. BMJ 2005;330:1056–7. 10.1136/bmj.330.7499.1056 [DOI] [PMC free article] [PubMed] [Google Scholar]
- 15.Li XQ, Tao KM, Zhou QH et al. . Endorsement of the CONSORT statement by high-impact medical journals in China: a survey of instructions for authors and published papers. PLoS ONE 2012;7:e30683 10.1371/journal.pone.0030683 [DOI] [PMC free article] [PubMed] [Google Scholar]
- 16.Panic N, Leoncini E, de Belvis G et al. . Evaluation of the endorsement of the preferred reporting items for systematic reviews and meta-analysis (PRISMA) statement on the quality of published systematic review and meta-analyses. PLoS ONE 2013;8:e83138 10.1371/journal.pone.0083138 [DOI] [PMC free article] [PubMed] [Google Scholar]
- 17.Tao KM, Li XQ, Zhou QH et al. . From QUOROM to PRISMA: a survey of high-impact medical journals’ instructions to authors and a review of systematic reviews in anesthesia literature. PLoS ONE 2011;6:e27611 10.1371/journal.pone.0027611 [DOI] [PMC free article] [PubMed] [Google Scholar]
- 18.Fleming PS, Seehra J, Polychronopoulou A et al. . A PRISMA assessment of the reporting quality of systematic reviews in orthodontics. Angle Orthod 2013;83:158–63. 10.2319/032612-251.1 [DOI] [PMC free article] [PubMed] [Google Scholar]
- 19.Tunis AS, McInnes MD, Hanna R et al. . Association of study quality with completeness of reporting: have completeness of reporting and quality of systematic reviews and meta-analyses in major radiology journals changed since publication of the PRISMA statement? Radiology 2013;269:413–26. [DOI] [PubMed] [Google Scholar]
- 20.Thomson Reuters. 2013 Journal Citation Reports® Science edn Thomson Reuters, 2014. https://jcr.incites.thomsonreuters.com/. [Google Scholar]
- 21.Huang Y, Mao C, Yuan J et al. . Distribution and epidemiological characteristics of published individual patient data meta-analyses. PLoS ONE 2014;9:e100151 10.1371/journal.pone.0100151 [DOI] [PMC free article] [PubMed] [Google Scholar]
- 22.Shea BJ, Grimshaw JM, Wells GA et al. . Development of AMSTAR: a measurement tool to assess the methodological quality of systematic reviews. BMC Med Res Methodol 2007;7:10 10.1186/1471-2288-7-10 [DOI] [PMC free article] [PubMed] [Google Scholar]
- 23.team TA. Assessing the Methodological Quality of Systematic Reviews (AMSTAR) Canada. 2015. http://amstar.ca/index.php
- 24.Dattalo P. Determining sample size: balancing power, precision, and practicality. Oxford: Oxford University Press, 2008. [Google Scholar]
- 25.Peters JP, Hooft L, Grolman W et al. . Reporting quality of systematic reviews and meta-analyses of otorhinolaryngologic articles based on the PRISMA Statement. PLoS ONE 2015;10:e0136540 10.1371/journal.pone.0136540 [DOI] [PMC free article] [PubMed] [Google Scholar]
- 26.Whiting LS. Systematic review protocols: an introduction. Nurse Res 2009;17:34–43. 10.7748/nr2009.10.17.1.34.c7337 [DOI] [PubMed] [Google Scholar]
- 27.Viswanathan M, Ansari MT, Berkman ND et al. . Assessing the risk of bias of individual studies in systematic reviews of health care interventions. Methods guide for effectiveness and comparative effectiveness reviews. Rockville, MD: Agency for Healthcare Research and Quality (US), 2008. AHRQ Methods for Effective Health Care. 8 Mar 2012. [PubMed] [Google Scholar]
- 28.Momeni A, Lee GK, Talley JR. The quality of systematic reviews in hand surgery: an analysis using AMSTAR. Plast Reconstr Surg 2013;131:831–7. 10.1097/PRS.0b013e3182818d24 [DOI] [PubMed] [Google Scholar]
- 29.Mokkink LB, Terwee CB, Stratford PW et al. . Evaluation of the methodological quality of systematic reviews of health status measurement instruments. Qual Life Res 2009;18:313–33. 10.1007/s11136-009-9451-9 [DOI] [PubMed] [Google Scholar]
- 30.Song Y, Oh M, Park S et al. . The methodological quality of systematic reviews and meta-analyses on the effectiveness of non-pharmacological cancer pain management. Pain Manag Nurs 2015;16:781–91. 10.1016/j.pmn.2015.06.004 [DOI] [PubMed] [Google Scholar]
- 31.Tsertsvadze A, Chen YF, Moher D et al. . How to conduct systematic reviews more expeditiously? Syst Rev 2015;4:160 10.1186/s13643-015-0147-7 [DOI] [PMC free article] [PubMed] [Google Scholar]
- 32.Bloom KC, Olinzock BJ, Radjenovic D et al. . Leveling EBP content for undergraduate nursing students. J Prof Nurs 2013;29:217–24. 10.1016/j.profnurs.2012.05.015 [DOI] [PubMed] [Google Scholar]
- 33.Sadeghi-Bazargani H, Tabrizi JS, Azami-Aghdash S. Barriers to evidence-based medicine: a systematic review. J Eval Clin Pract 2014;20:793–802. 10.1111/jep.12222 [DOI] [PubMed] [Google Scholar]
- 34.Bath-Hextall F, Wharrad H, Leonardi-Bee J. Teaching tools in evidence based practice: evaluation of reusable learning objects (RLOs) for learning about meta-analysis. BMC Med Educ 2011;11:18 10.1186/1472-6920-11-18 [DOI] [PMC free article] [PubMed] [Google Scholar]
- 35.Lefebvre CM, John RM. The effect of breastfeeding on childhood overweight and obesity: a systematic review of the literature. J Am Assoc Nurse Pract 2014;26:386–401. 10.1002/2327-6924.12036 [DOI] [PubMed] [Google Scholar]
- 36.Journal TBM.2015. Resources for authors London. http://www.bmj.com/about-bmj/resources-authors/article-submission/article-requirements.
- 37.Medicine. Information for authors: Lippincott Williams & Wilkins, 2015. http://journals.lww.com/md-journal/Pages/informationforauthors.aspx
- 38.Fong DY, Ho JW, Hui BP et al. . Physical activity for cancer survivors: meta-analysis of randomised controlled trials. BMJ 2012;344:e70 10.1136/bmj.e70 [DOI] [PMC free article] [PubMed] [Google Scholar]
- 39.Alvarez F, Meyer N, Gourraud PA et al. . CONSORT adoption and quality of reporting of randomized controlled trials: a systematic analysis in two dermatology journals. Br J Dermatol 2009;161:1159–65. 10.1111/j.1365-2133.2009.09382.x [DOI] [PubMed] [Google Scholar]
- 40.Han C, Kwak KP, Marks DM et al. . The impact of the CONSORT statement on reporting of randomized clinical trials in psychiatry. Contemp Clin Trials 2009;30:116–22. 10.1016/j.cct.2008.11.004 [DOI] [PMC free article] [PubMed] [Google Scholar]
Associated Data
This section collects any data citations, data availability statements, or supplementary materials included in this article.
Supplementary Materials
bmjopen-2016-013905supp_table1-journals.pdf (24.4KB, pdf)
bmjopen-2016-013905supp_table2-articles.pdf (120.7KB, pdf)