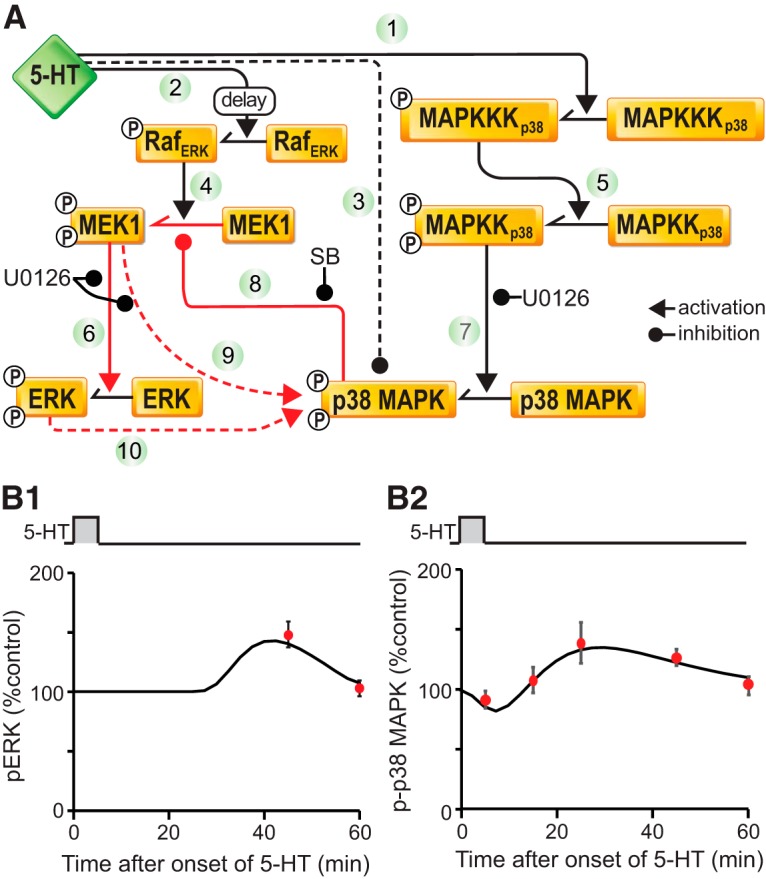
Figure 6.

Computational simulation of ERK and p38 MAPK phosphorylation after different 5-HT treatments. A, Schematic of the model of the ERK and p38 MAPK signaling pathways. Key pathways are labelled by numbers. B, Dynamics of pERK (B1) and p-p38 MAPK (B2) after one pulse of 5-HT. The simulations (black traces) are qualitatively similar to the empirical data (red circles) collected in the present study.
