Significance
Oncometabolites are small molecules that promote tumor formation and growth. L-2-hydroxyglutarate (L-2HG) is a putative oncometabolite that is associated with gliomas and renal cell carcinomas, as well as a severe neurometabolic disorder known as L-2-hydroxyglutaric aciduria. However, despite that L-2HG is commonly considered a metabolic waste product, this compound was recently discovered to control immune cell fate, thereby demonstrating that it has endogenous functions in healthy animal cells. Here, we find that the fruit fly, Drosophila melanogaster, also synthesizes high concentrations of L-2HG during normal larval growth. Our discovery establishes the fly as a genetic model for studying this putative oncometabolite in healthy animal tissues.
Keywords: 2-hydroxyglutarate, LDH, lactate, Warburg effect, estrogen-related receptor
Abstract
L-2-hydroxyglutarate (L-2HG) has emerged as a putative oncometabolite that is capable of inhibiting enzymes involved in metabolism, chromatin modification, and cell differentiation. However, despite the ability of L-2HG to interfere with a broad range of cellular processes, this molecule is often characterized as a metabolic waste product. Here, we demonstrate that Drosophila larvae use the metabolic conditions established by aerobic glycolysis to both synthesize and accumulate high concentrations of L-2HG during normal developmental growth. A majority of the larval L-2HG pool is derived from glucose and dependent on the Drosophila estrogen-related receptor (dERR), which promotes L-2HG synthesis by up-regulating expression of the Drosophila homolog of lactate dehydrogenase (dLdh). We also show that dLDH is both necessary and sufficient for directly synthesizing L-2HG and the Drosophila homolog of L-2-hydroxyglutarate dehydrogenase (dL2HGDH), which encodes the enzyme that breaks down L-2HG, is required for stage-specific degradation of the L-2HG pool. In addition, dLDH also indirectly promotes L-2HG accumulation via synthesis of lactate, which activates a metabolic feed-forward mechanism that inhibits dL2HGDH activity and stabilizes L-2HG levels. Finally, we use a genetic approach to demonstrate that dLDH and L-2HG influence position effect variegation and DNA methylation, suggesting that this compound serves to coordinate glycolytic flux with epigenetic modifications. Overall, our studies demonstrate that growing animal tissues synthesize L-2HG in a controlled manner, reveal a mechanism that coordinates glucose catabolism with L-2HG synthesis, and establish the fly as a unique model system for studying the endogenous functions of L-2HG during cell growth and proliferation.
One of the hallmarks of cancer is a dramatic reprograming of cellular metabolism that results in enhanced biosynthesis (1). These metabolic changes are particularly apparent in tumors that use the Warburg effect, also referred to as aerobic glycolysis, a metabolic program characterized by elevated levels of glucose consumption and enhanced lactate production (1, 2). By activating aerobic glycolysis, tumors are able to synthesize macromolecules rapidly from glycolytic intermediates. In addition, elevated levels of lactate dehydrogenase (LDH) activity allow proliferating cells to synthesize lactate and maintain the NAD+ levels required for high rates of glucose catabolism and biomass production (1).
The metabolic reprogramming of cancer cells, however, extends beyond biosynthesis, as many tumors also generate progrowth metabolites, or oncometabolites, that promote tumor formation via nonmetabolic means. Most notable among these compounds is D-2-hydroxyglutarate (D-2HG), which is associated with cancers such as gliomas and acute myelogenous leukemias (3). Although D-2HG is generated as a normal byproduct of γ-hydroxybutyrate metabolism (4), oncogenic D-2HG production is the result of neomorphic mutations in the active site of isocitrate dehydrogenase 1 or 2 (IDH1/2) (5). Tumors that harbor these IDH1/2 mutations inappropriately convert 2-oxoglutarate (2OG) to D-2HG, which acts as a competitive inhibitor of 2-oxoglutarate–dependent dioxygenases [2OGDs; e.g., Jmj histone lysine demethylases, ten-eleven translocation (TET) enzyme family] (3, 6–9). As a result, IDH1/2 mutant cells experience widespread chromatin remodeling and changes in gene expression and are unable to differentiate properly (8, 9).
Although most oncometabolite research is focused on D-2HG, the L-2-hydroxyglutarate (L-2HG) enantiomer is an even more potent 2OGD inhibitor, and high L-2HG levels are associated with renal cell carcinomas, gliomas, and a neurometabolic disorder known as L-2-hydroxyglutaric aciduria (10–12). Unlike D-2HG, however, L-2HG has no known role in metabolism and eukaryotes lack an enzyme dedicated to L-2HG synthesis. Instead, L-2HG is considered an aberrant metabolite produced by the nonspecific activity of enzymes such as malate dehydrogenase, lactate dehydrogenase A (LDHA), and lactate dehydrogenase C (12–18). Consistent with these observations, L-2HG accumulation in cancer cells does not result from ectopic synthesis; rather, it stems from decreased expression of the enzyme L-2-hydroxyglutarate dehydrogenase (L2HGDH), which is solely responsible for L-2HG degradation (10, 19). Therefore, most studies suggest that neither healthy tissues nor cancer cells appear capable of regulating L-2HG production. This model of L-2HG synthesis, however, has been challenged by a recent study of T lymphocytes, which revealed that these immune cells generate L-2HG as a means of controlling cell fate and gene expression (20). Furthermore, both hypoxia and the disruption of mitochondrial metabolism cause human cells to generate high levels of L-2HG, indicating that synthesis of this compound might alleviate oxidative stress (17, 21–23). These observations hint at diverse endogenous roles for L-2HG and suggest that the function of this putative oncometabolite should be further studied in healthy tissues. To address this need, we have established the fruit fly Drosophila melanogaster as a genetic model system for studying L-2HG in the context of aerobic glycolysis and rapid tissue growth.
The fly is ideally suited to study the molecular mechanisms that link glycolytic flux to biosynthesis. Similar to cancer cells, growing Drosophila larvae up-regulate glycolysis, the pentose phosphate pathway, and lactate production as means of supporting the nearly 200-fold increase in body mass that occurs during this developmental stage (24). The resulting metabolic program exhibits the hallmark characteristics of aerobic glycolysis and establishes the fly as a powerful in vivo model for studying this metabolic state. Furthermore, studies in the fly were the first to demonstrate that the estrogen-related receptor (ERR) family of nuclear receptors acts as a conserved transcriptional regulator of aerobic glycolysis (24–26). Here, we extend the metabolic parallels between Drosophila development and tumor growth by demonstrating that the Drosophila estrogen-related receptor (dERR) also promotes L-2HG synthesis. Moreover, we determine that the larval L-2HG pool is largely derived from glucose oxidation and synthesized by the Drosophila ortholog of LDH (dLDH), thereby establishing a direct link between larval glycolytic metabolism and L-2HG production. Finally, we demonstrate that dLDH and L-2HG are key regulators of position effect variegation (PEV) and DNA methylation, supporting a model in which L-2HG acts as a metabolic signal that coordinates glycolytic flux with epigenetic modifications and the regulation of gene expression.
Results
Drosophila Larvae Synthesize High Concentrations of L-2HG.
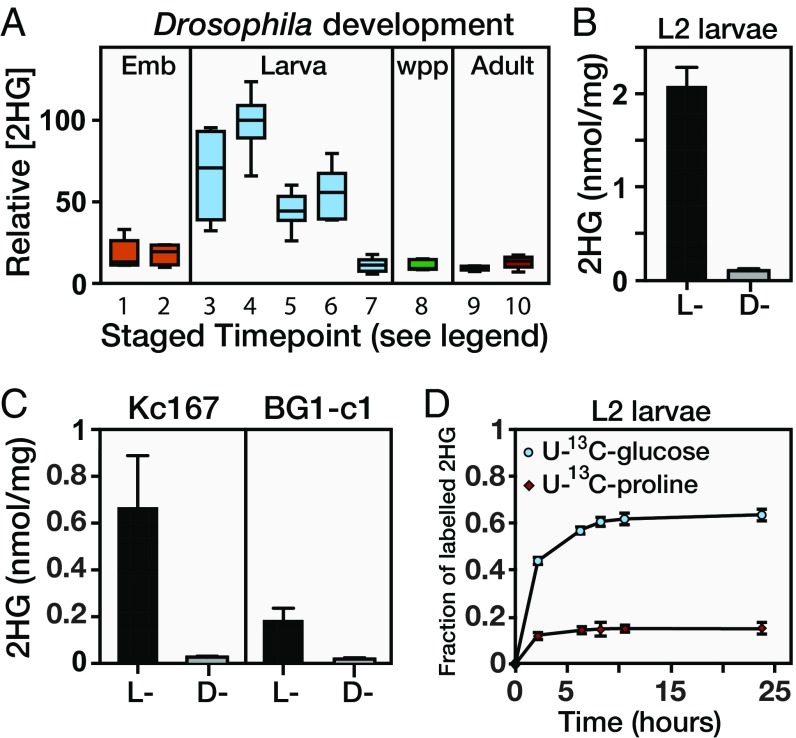
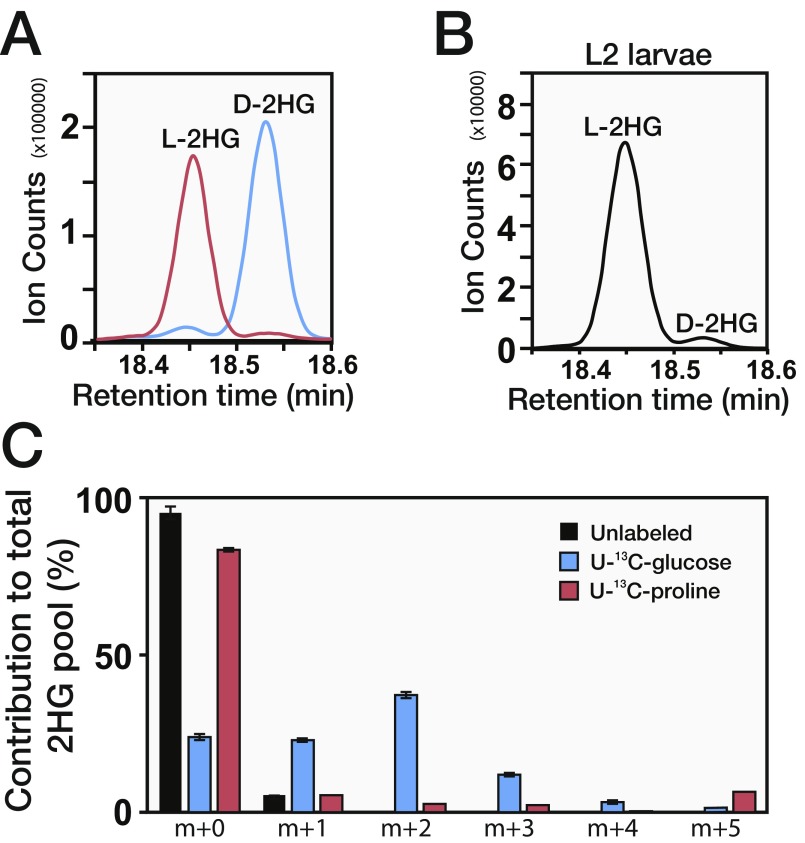
In an effort to characterize the metabolic basis of Drosophila larval growth, we used a targeted GC-MS–based approach to identify compounds that are abundant in larvae but absent in other developmental stages. This approach identified 2HG, whose levels are elevated between threefold and 10-fold in larvae compared with embryos, wandering third-instar larvae, white prepupae, and adults (Fig. 1A). To characterize this larval 2HG pool further, we used a chiral derivatization method to individually measure the concentrations of D-2HG and L-2HG in w1118 second-instar larvae (Fig. S1 A and B). Although L2 larvae harbor relatively low quantities of D-2HG (∼0.1 nmol/mg of body mass; Fig. 1B), the concentration of L-2HG surpasses 2 nmol/mg of body mass (Fig. 1B and Fig. S1B), which exceeds the IC50 of all analyzed 2OGDs and indicates that larvae accumulate physiologically relevant levels of this compound (6, 7). Intriguingly, we observed that the Drosophila late embryonic and L3 cell lines Kc167 and BG1-c1, respectively, also produce relatively high concentrations of L-2HG (∼0.2–0.8 nmol/mg), but only possess a basal level of D-2HG (Fig. 1C), indicating L-2HG accumulation is a general feature of rapid cell growth and proliferation in flies.
Fig. 1.
Drosophila larvae accumulate high concentrations of L-2HG. (A) Relative abundance of 2HG in a w1118 background. Staged time points are as follows: (1) embryos (Emb; 0–12 h after egg laying), (2) Emb (12–24 h after egg laying), (3) L1 larvae, (4) L2 larvae, (5) early-L3 larvae (0–12 h after L2-L3 molt), (6) mid-L3 larvae (24–36 h after L2-L3 molt), (7) wandering L3 larvae, (8) white prepupae (wpp), (9) adult females (3 d posteclosion), and (10) adult males (3 d posteclosion). Data are represented as box plots (n = 6). The concentrations of D-2HG and L-2HG in midsecond-instar w1118 larvae (B) and the Drosophila cell lines Kc167 and BG1-c1 (C) are shown. Data are shown as mean ± SD (n ≥ 3). (D) The w1118 midsecond-instar larvae were fed either U-13C-glucose or U-13C-proline, and the incorporation of 13C isotopes into 2HG was monitored over a 24-h period.
Fig. S1.
Drosophila larvae accumulate L-2HG. (A) D-2HG and L-2HG standards were individually measured by GC-MS using a chiral derivatization protocol. (B) Relative abundance of D-2HG and L-2HG levels in w1118 second-instar larvae was measured using the same method used in A. (C) Isotopologue distribution of L-2HG in larvae that were fed a semidefined food containing either 50% U-13C-glucose or 64% U-13C-proline for 24 h. Black bars represent the isotopologue distribution in control animals. Error bars denote SD.
The extent to which larvae accumulate L-2HG is striking, as the only other healthy tissues known to accumulate high concentrations of L-2HG are T lymphocytes and cultured human cells that experience hypoxia (20, 21). Since we raised larvae under normoxic conditions (Materials and Methods), our results suggested that larvae accumulate L-2HG via a novel metabolic mechanism. To pinpoint the metabolic origin of L-2HG, L2 larvae were fed semidefined media that were supplemented with either U-13C–labeled glucose or U-13C–labeled proline (an anaplerotic amino acid in insects). Larvae raised on labeled food incorporated 13C into L-2HG, indicating that Drosophila metabolism is capable of synthesizing this compound (Fig. 1D). Moreover, ∼60% of the L-2HG pool was labeled with 13C after 24 h of U-13C-glucose consumption, but only ∼15% of this pool contained 13C as the result of feeding labeled proline (Fig. 1D). Because animal cells synthesize L-2HG from 2OG, our results suggested that larvae ultimately generate this compound by shuttling glucose-derived pyruvate into the TCA cycle. Indeed, we found that m + 2 was the most abundant L-2HG isotopologue following U-13C-glucose feeding, an observation that is consistent with fully labeled pyruvate entering the TCA cycle via the pyruvate dehydrogenase complex (Fig. S1C). In contrast, feeding of U-13C-proline primarily produced the m + 5 isotopologue (Fig. S1C). Although there are likely additional anaplerotic compounds that are used to generate L-2HG, our observations indicate that a majority of the larval L-2HG pool is generated from glucose oxidation.
dERR Promotes L-2HG Accumulation.
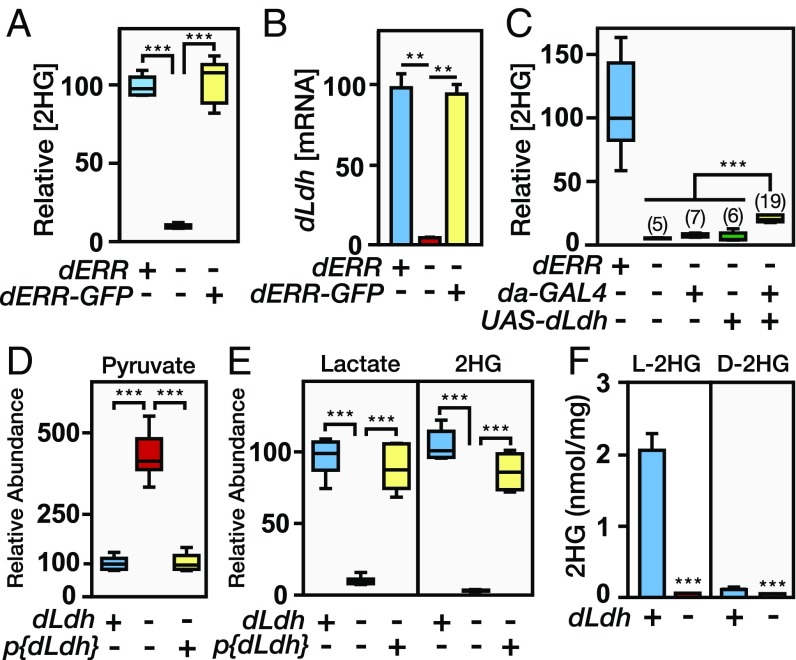
Rapidly growing Drosophila larvae rely on elevated levels of glucose catabolism to generate biomass (24); therefore, our 13C tracer analysis suggests that larvae generated L-2HG as a byproduct of this metabolic program. We tested this hypothesis by measuring L-2HG levels in dERR mutants, which fail to up-regulate carbohydrate metabolism before the onset of larval development (24). Not only were L-2HG levels dramatically lower in dERR mutants compared with w1118 controls but this L-2HG phenotype was also rescued by the expression of a dERR-GFP transgene in the dERR mutant background (Fig. 2A). These studies indicated that L-2HG production is dependent on the metabolic program that is established by dERR at the onset of larval growth.
Fig. 2.
L-2HG is generated by the aerobic glycolytic program. (A) Relative abundance of 2HG in mid-L2 larvae from w1118 controls, dERR1/dERR2 mutants, and dERR1/dERR2 mutants that express a dERR-GFP transgene. (B) Relative dLdh mRNA levels were measured in the same genotypes described in A. Transcript levels were normalized to the abundance of rp49 mRNA. Data are presented as mean ± SEM (n = 3). (C) Relative abundance of 2HG in mid-L2 larvae of the following genotypes: w1118, dERR1/dERR2, dERR1 + /dERR2 da-GAL4, UAS-dLdh/+; dERR1/dERR2, and UAS-dLdh/+; dERR1 + /dERR2 da-GAL4. The numbers in parentheses refer to the mean value for the sample set. The relative abundance of pyruvate (D) and lactate (E) as well as 2HG was measured in mid-L2 larvae from dLdhprec controls, dLdh16/dLdh17 mutants, and a p{genomic dLdh}/+; dLdh16/dLdh17 rescue strain. (F) Concentration of L-2HG and D-2HG in dLdhprec controls (+) and dLdh16/dLdh17(−) mid-L2 larvae. Data are presented as mean ± SD. In A and C–E, data are represented as box plots (n = 6). **P < 0.01; ***P < 0.001.
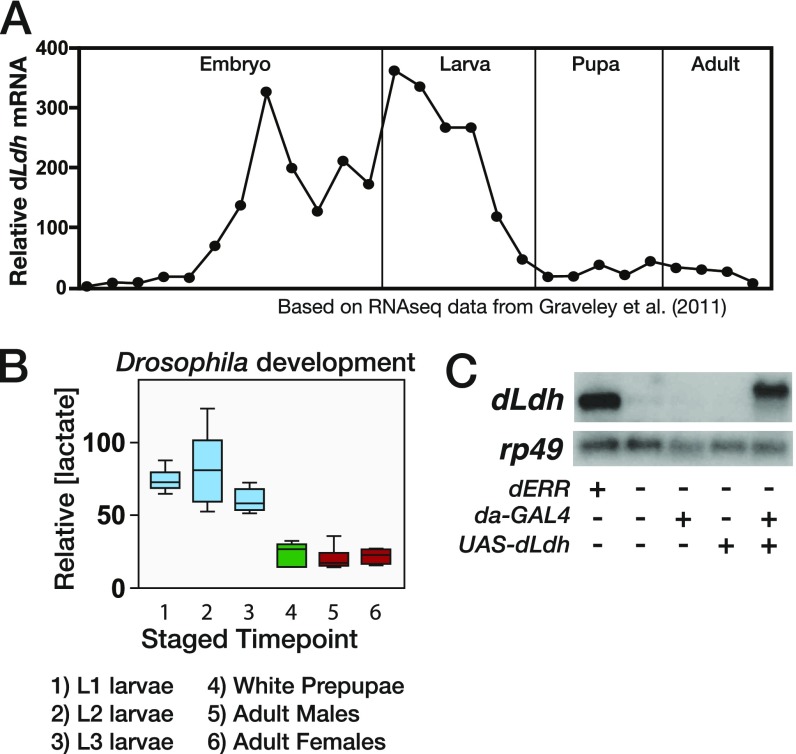
In an effort to identify the enzyme that synthesizes L-2HG, we searched for enzymes that are both regulated by dERR and only expressed at a high level in larvae, mimicking the L-2HG accumulation pattern. One gene that fulfilled these criteria was the Drosophila homolog of LDH (dLdh; also known as ImpL3). The expression of dLdh is dependent on dERR activity and is restricted to late-stage embryos and growing larvae, and lactate levels decrease at the onset of metamorphosis, mirroring the temporal changes we observe in L-2HG abundance (24, 27, 28) (Fig. 2B and Fig. S2 A and B). To determine if dERR mutants lack L-2HG due to loss of dLDH activity, we used the da-GAL4 driver to express a UAS-dLdh transgene ubiquitously in this mutant background (Fig. S2C). Even though most L-2HG is derived from glucose and glycolytic capacity is severely impaired in dERR mutants (24), UAS-dLdh expression increased L-2HG levels by threefold in dERR-mutant larvae compared with the negative control strains (Fig. 2C), indicating that dLDH is sufficient to drive L-2HG accumulation.
Fig. S2.
Levels of dLdh mRNA and lactate during larval development and ectopic expression of dLdh in dERR mutant larvae. (A) Relative mRNA expression data for dLdh from a study by Graveley et al. (27) are plotted across developmental time. Values are normalized to the mean value of all time points. Consistent with previous studies, dLdh is expressed at relatively high levels in late-stage embryos and larvae. (B) Relative abundance of lactate during w1118 development. Data are represented as box plots (n = 6 samples per time point). (C) Total RNA from staged midsecond-instar larvae was analyzed by Northern blot hybridization to detect dLdh expression. Hybridization to detect rp49 mRNA was used as a control for loading and transfer. Note that the UAS-dLDH transcript is slightly larger than the endogenous mRNA due to the inclusion of a longer 3′ UTR.
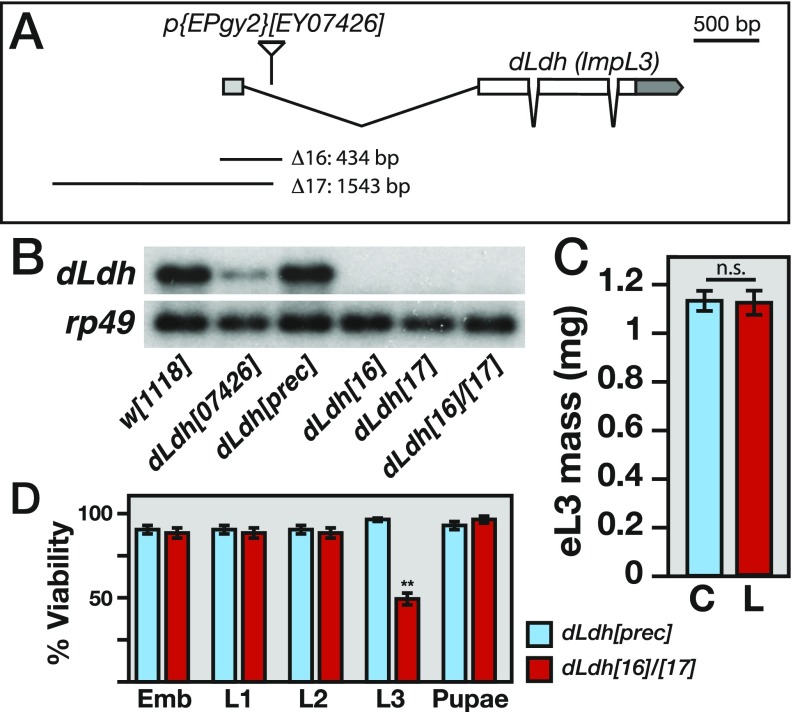
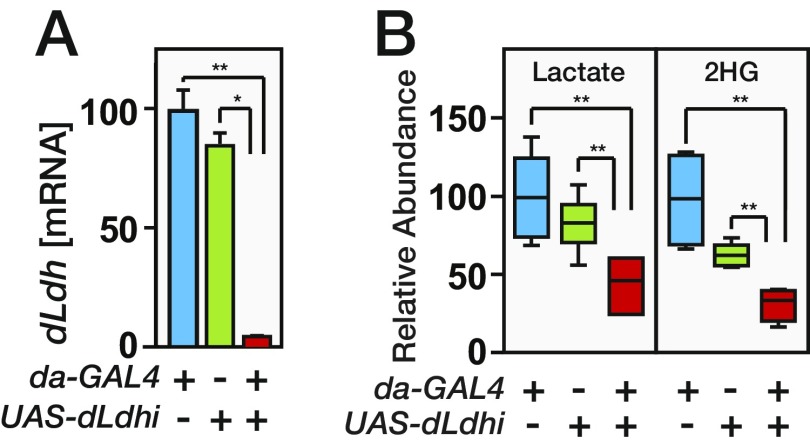
To determine if dLDH is also necessary for larval L-2HG synthesis, we generated two mutations that eliminate dLdh gene expression (Fig. S3 A and B). Animals that harbor a trans-heterozygous combination of these null alleles, dLdh16/dLdh17, grow at a normal rate until the midthird instar, at which point 50% of the larvae die and the remainder develop into morphologically normal adults (Fig. S3 C and D). However, despite the normal growth rate, GC-MS analysis of the dLdh16/dLdh17 midsecond-instar larvae revealed dramatic metabolic phenotypes. These mutants not only displayed a fivefold increase in pyruvate and a 20-fold decrease in lactate but 2HG levels were almost undetectable compared with a precise excision control strain (dLdhprec) (Fig. 2 D and E). Furthermore, these metabolic defects were specifically due to the loss of dLDH activity, as the aberrant pyruvate, lactate, and 2HG levels observed in dLdh16/dLdh17 mutants were completely rescued by a dLdh transgene (Fig. 2 D and E). We obtained a similar phenotype by expressing a UAS-dLdh-RNAi transgene, which depleted dLdh mRNA levels and induced a significant reduction in the abundance of lactate and 2HG (Fig. S4). Finally, we confirmed that loss of dLDH activity predominantly affects the L-2HG pool. While dLdh16/dLdh17 larvae exhibited a modest decrease in D-2HG levels, the abundance of L-2HG decreased by 98% in these mutants (2.1 nmol/mg [dLdhprec] vs. 0.04 nmol/mg [dLdh16/dLdh17]; Fig. 2F). Overall, these results demonstrate that dERR promotes L-2HG synthesis by up-regulating dLdh gene expression.
Fig. S3.
Generation of dLdh mutations. (A) Two dLdh loss-of-function alleles (dLdh16 and dLdh17) were generated by the imprecise excision of the p-element {EPgy2}EY07426. Unless noted, a transheterozygous combination of two precise excision alleles (dLdhprec) serves as a negative control in all subsequent experiments. (B) Total RNA from staged midsecond-instar larvae was analyzed by Northern blot hybridization to detect dLdh expression. Hybridization to detect rp49 mRNA was used as a control for loading and transfer. (C) Larval mass of both precise excision controls (C) and dLdh mutants (L) was measured 0–4 h after the L2-L3 molt. n.s., not significant. (D) Viability of dLdh mutants and precise excision controls was monitored throughout development. The percent viability value for each stage represents the percentage of animals that survive until the subsequent developmental stage. The value for percent pupal viability represents the number of animals that eclose. Nearly half of the dLdh mutants die during L3 development. Emb, embryo. Data are shown as mean ± SD. **P < 0.01.
Fig. S4.
Expression of dLdh correlates with L-2HG synthesis. RNAi was used to deplete dLdh mRNA transcripts in midsecond-instar larvae. Compared with the da-GAL4 and UAS-dLdhi control strains, da-GAL4 UAS-dLdhi larvae possess significantly lower levels of dLdh mRNA (A) and accumulate significantly less lactate and 2HG (B). In A, quantitative RT-PCR was used to measure the relative amount of dLdh mRNA. For all samples, transcript levels were normalized to the abundance of rp49 mRNA (n = 3 samples collected from independent populations with at least 10 midsecond-instar larvae per sample). In B, GC-MS data are represented and normalized as described in Fig. 1 (n = 6 samples collected from independent populations with 25 midsecond-instar larvae per sample). *P < 0.05; **P < 0.01.
dLDH Directly Synthesizes L-2HG from 2OG.
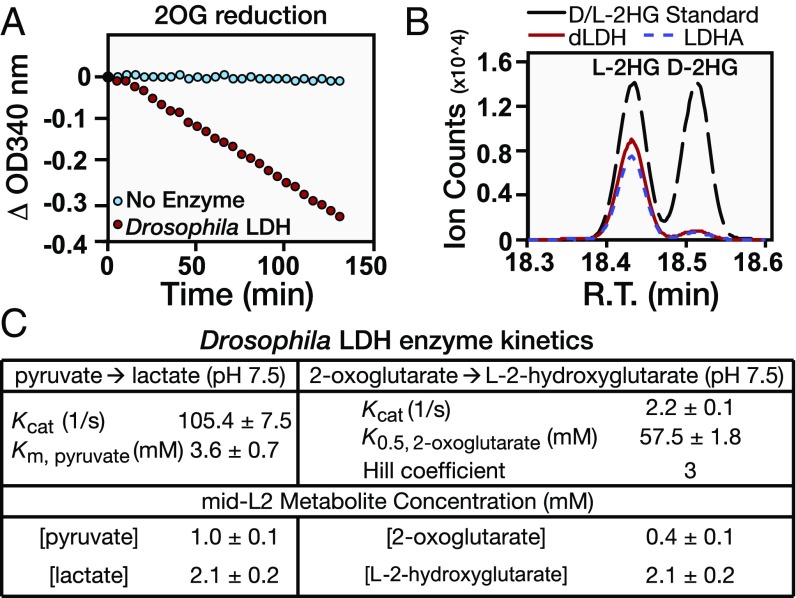
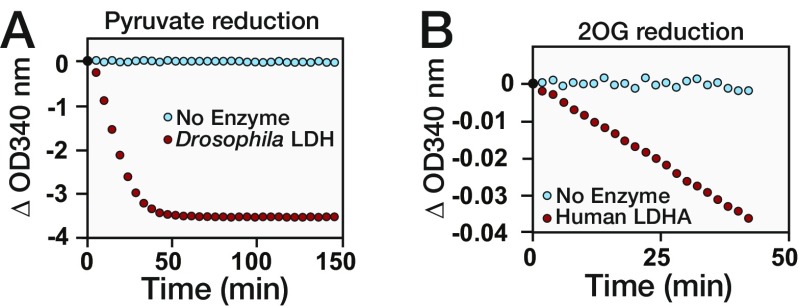
Our findings that dLDH is both necessary and sufficient for L-2HG accumulation suggests that this enzyme could be directly responsible for synthesizing L-2HG. We tested this possibility by incubating purified dLDH with NADH and either pyruvate or 2OG, which serves as the precursor for L-2HG in mammalian cells (17, 21). Based on changes in both NADH concentration (340-nm absorbance) and end-point GC-MS analysis, dLDH not only converts pyruvate to lactate but also synthesizes L-2HG from 2OG (Fig. 3 A and B and Fig. S5A). In agreement with earlier studies (16, 21), we also observed that human LDHA catalyzed the reaction of 2OG to L-2HG, thereby demonstrating that LDH generates L-2HG via an evolutionarily conserved enzymatic mechanism (Fig. 3B and Fig. S5B).
Fig. 3.
dLDH directly catalyzes the formation of L-2HG from 2OG. (A) Purified dLDH was incubated with NADH and 2OG. The ability of dLDH to reduce 2OG was monitored by changes in NADH concentration (absorbance at 340 nm). (B) GC-MS was used to conduct an end-point analysis of D-2HG and L-2HG accumulation in the reactions catalyzed by dLDH and human LDHA. R.T., retention time. (C) Kinetic parameters for the conversion of pyruvate to lactate and 2OG to 2HG by purified dLDH (pH 7.5). Note that dLDH exhibits non-Michaelis–Menten kinetics for the 2OG-to-2HG reaction. The Km, pyruvate value deviates from previous reports due to differences in pH of the in vitro reactions.
Fig. S5.
LDH enzyme activity assays. (A) Purified dLDH was incubated with NADH and pyruvate. The ability of dLDH to reduce pyruvate was monitored by changes in NADH concentration (absorbance at 340 nm). (B) Ability of human LDHA to reduce 2OG was monitored based on changes in NADH concentration.
During the course of these kinetic analyses, we discovered an unexpected relationship between lactate and L-2HG synthesis. Although dLDH converted pyruvate to lactate with normal Michaelis–Menten kinetics (Km, pyruvate = 3.6 mM at pH 7.5; Fig. 3C), dLDH catalyzed the reduction of 2OG with a much lower efficiency and displayed non-Michaelis–Menten kinetics (K0.5, 2OG = 57.5 mM; Hill coefficient = 3; Fig. 3C). However, despite the ability of dLDH to synthesize lactate at a much faster rate than L-2HG, both of these compounds are found at nearly identical concentrations in midsecond-instar larvae (Fig. 3C), indicating that lactate and L-2HG levels are coordinately regulated.
Drosophila L-2-Hydroxyglutarate Dehydrogenase Regulates L-2HG Accumulation in a Lactate-Sensitive Manner.
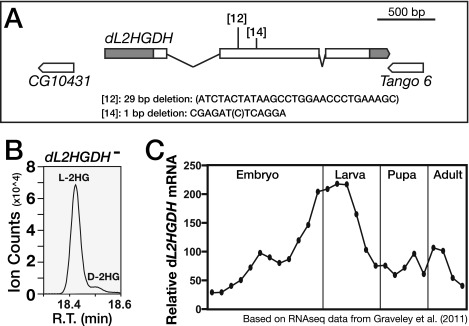
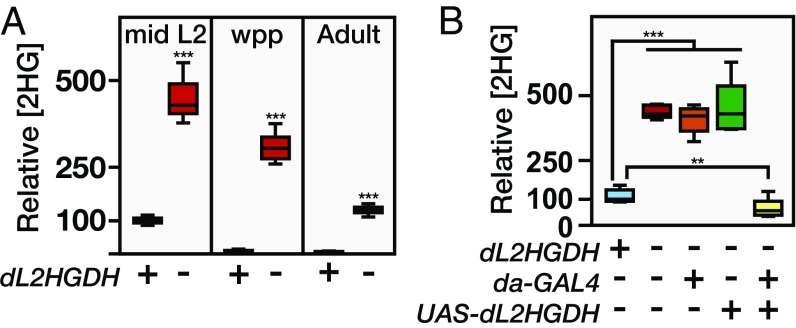
Considering that dLDH acts on 2OG with a relatively low efficiency, we hypothesized that the larval L-2HG pool represents a combination of increased synthesis and decreased degradation. In mammals, the mitochondrial enzyme L2HGDH controls L-2HG levels by converting this compound to 2OG (13, 19). To determine if Drosophila L-2HG levels are controlled by a similar mechanism, we generated two mutations in the sole fly L2HGDH ortholog (dL2HGDH; also known as CG10639; Fig. S6A). Animals that carry a trans-heterozygous combination of these mutations, dL2HGDH12 and dL2HGDH14, are viable and display significantly higher L-2HG levels throughout the fly life cycle (Fig. 4A and Fig. S6B). Furthermore, ubiquitous overexpression of UAS-dL2HGDH in a dL2HGDH12/dL2HGDH14 mutant background completely rescued this metabolic phenotype (Fig. 4B), demonstrating that dL2HGDH is responsible for degrading L-2HG. The most dramatic aspect of the dL2HGDH mutant phenotype, however, was found in early prepupae, where L-2HG levels were elevated nearly 20-fold in dL2HGDH12/dL2HGDH14 mutants (Fig. 4A), a difference that reflects the stage-specific regulation of L-2HG metabolism. Although control larvae experience a 90% decrease in L-2HG immediately before metamorphosis (Fig. 1A), this metabolic switch fails in dL2HGDH mutants and L-2HG levels remain at levels normally associated with larval stages (Fig. 4A).
Fig. S6.
Generation of the dL2HGDH mutations. (A) CRISPR/Cas9 was used to generate two dL2HGDH loss-of-function alleles independently. Unless noted, a transheterozygous genotype of dL2HGDH12/dL2HGDH14 was used for all analyses. (B) Relative abundance of D-2HG and L-2HG levels in dL2HGDH mutant midsecond-instar larvae was measured using GC-MS. L-2HG is the primary 2HG enantiomer present in these mutants. R.T., retention time. (C) Relative mRNA expression data for dL2HGDH from a study by Graveley et al. (27) is plotted across developmental time. Values are normalized to the mean value of all time points.
Fig. 4.
dL2HGDH controls the stage-specific accumulation of L-2HG. (A) Relative 2HG levels in staged samples of mid-L2, white prepupae (wpp), or adult males (3 d posteclosion) between w1118 controls (+) and dL2HGDH12/dL2HGDH14 (−) mutants. (B) Relative 2HG levels in mid-L2 larvae for the following five genotypes: w1118, dL2HGDH12/dL2HGDH14, dL2HGDH12/dL2HGDH14; da-GAL4, dL2HGDH12/dL2HGDH14; UAS-dL2HGDH, and dL2HGDH12/dL2HGDH14; da-GAL4 UAS-dL2HGDH. Data are represented as box plots (n = 6). **P < 0.01; ***P < 0.001.
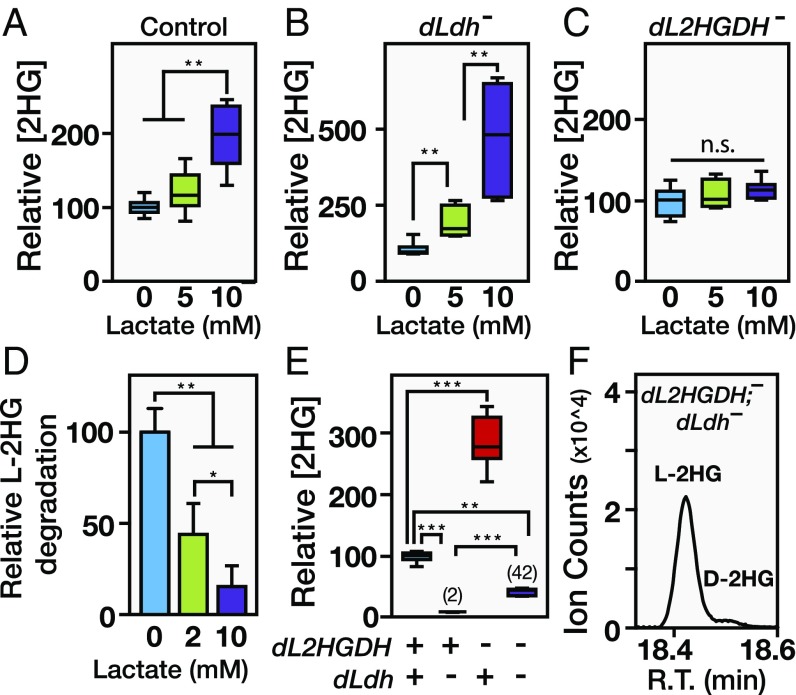
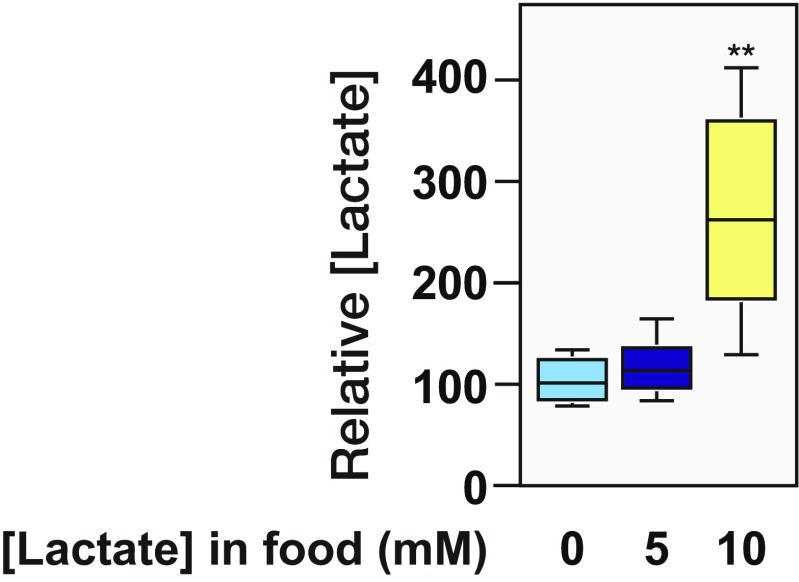
The manner by which L-2HG levels drop at the onset of metamorphosis suggests that dL2HGDH enzymatic activity is relatively low in larvae compared with pupae. This stage-specific regulation, however, does not occur at a transcriptional level, as dL2HGDH mRNA levels peak during larval development and actually drop before puparium formation (27) (Fig. S6C), indicating that larval L-2HG degradation is controlled at a posttranscriptional level. Considering that both lactate and L-2HG are structurally similar α-hydroxy acids, we hypothesized that lactate might regulate L-2HG levels by acting as a competitive inhibitor of dL2HGDH. Therefore, we raised larvae on food supplemented with increasing lactate concentrations and measured the relative abundance of both lactate and L-2HG. Although both control and dLdh mutant larvae exhibited significantly elevated levels of L-2HG when raised on high-lactate food (Fig. 5 A and B and Fig. S7), L-2HG levels in dL2HGDH mutants were resistant to this dietary treatment (Fig. 5C), suggesting that lactate-mediated L-2HG accumulation requires dL2HGDH. Consistent with this hypothesis, lactate inhibited the activity of partially purified dL2HGDH in vitro. A concentration of lactate similar to the concentration found in midsecond-instar larvae, 2 mM, induced an ∼50% decrease in dL2HGDH activity, whereas the addition of 10 mM lactate nearly eliminated L-2HG degradation (Fig. 5D).
Fig. 5.
dL2HGDH activity is inhibited by lactate. (A–C) 2HG levels in mid-L2 larvae raised on semidefined media containing 0, 5, or 10 mM lactate. Dietary lactate induced elevated 2HG levels in both w1118 controls and dLdh16/dLdh17 (dLdh−) mutants, but not dL2HGDH12/dL2HGDH14 (dL2HGDH−) mutants. (D) Ability of lactate to inhibit L-2HG degradation was assessed by incubating partially purified dL2HGDH with 2 mM L-2HG and 0, 2, or 10 mM lactate (n = 6, data presented as mean ± SD). (E) Relative 2HG levels in mid-L2s of w1118 controls, dL2HGDH12/14; dLdh16/17 single mutants, and dL2HGDH12/14; dLdh16/17 double mutants. (F) Relative abundance of D-2HG and L-2HG levels in dL2HGDH; dLdh mutant midsecond-instar larvae was measured using GC-MS. In A–C and E, data are represented as box plots (n = 6). *P < 0.05; **P < 0.01; ***P < 0.001.
Fig. S7.
Drosophila larvae absorb dietary lactate. Lactate levels were measured in mid-L2 w1118 larvae that were raised on semidefined media containing 0, 5, or 10 mM L-lactate. Data are represented as box plots (n = 6). **P < 0.01.
These findings hint at an elegant model for how dLDH can generate such high levels of L-2HG accumulation despite its low affinity for 2OG. If lactate inhibits dL2HGDH activity, then the stage-specific dLdh expression could both increase L-2HG synthesis and inhibit dL2HGDH activity via lactate production, thereby stabilizing the larval L-2HG pool. Such a model would also explain why both dERR and dLdh mutant larvae exhibit such low L-2HG levels, because the loss of dLDH activity would result in both decreased synthesis and increased degradation. Indeed, when we measured L-2HG abundance in dL2HGDH; dLdh double mutants, where loss of dL2HGDH renders larvae unable to degrade L-2HG, we found that L-2HG levels were increased 20-fold compared with the dLdh single mutant (Fig. 5 E and F). Overall, these results reveal a metabolic feed-forward mechanism, wherein dLDH both synthesizes L-2HG and indirectly inhibits L-2HG degradation via the production of lactate.
L-2HG Regulates PEV.
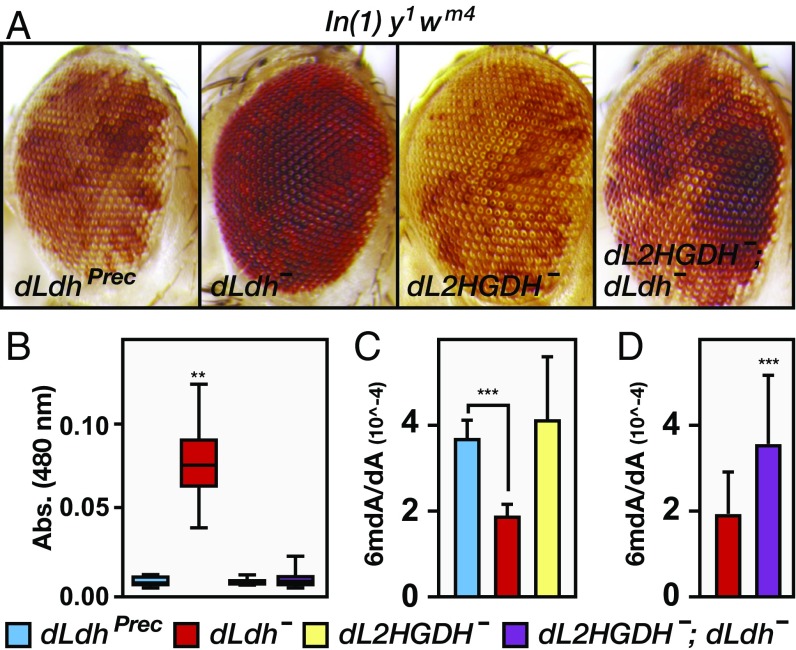
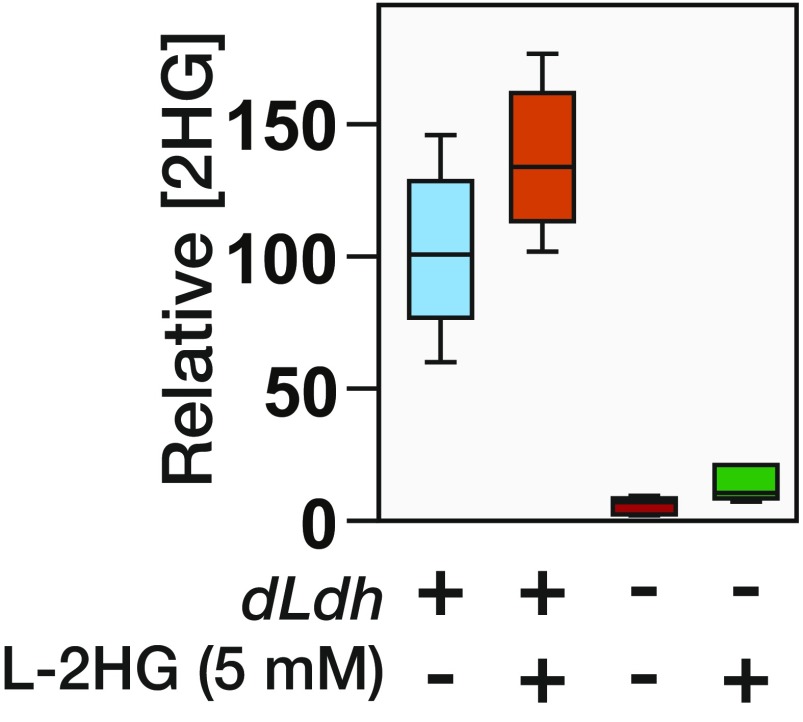
The 2HG accumulation in mammalian cells is associated with changes in epigenetic modifications and chromatin architecture (6, 7), suggesting that the larval L-2HG pools function in a similar capacity. We tested this possibility using the In(1) y1 wm4 inversion of the X chromosome as a readout of heterochromatin formation. In flies that harbor this chromosome, the white (w) locus is positioned near the centromere, and as a result, w expression is silenced by the pericentric heterochromatin. This phenomenon is known as PEV, and the resulting changes in w gene expression are primarily influenced by heterochromatin formation (reviewed in ref. 29). Our analysis revealed that dLdh mutations are very strong recessive suppressors of PEV (Fig. 6 A and B), demonstrating that dLDH activity normally promotes heterochromatin formation. In contrast, the dL2HGDH mutations do not consistently alter PEV under these conditions (Fig. 6 A and B), suggesting that this phenomenon is sensitive to loss of L-2HG, but not excess amounts of this compound. Such a result is not unexpected because the larval concentration of L-2HG exceeds the reported IC50 values of most 2OGDs, and increased levels would likely have a minimal effect on the activity of target enzymes (6). Because Drosophila larvae absorb minimal amounts of L-2HG from their food (Fig. S8), we assessed the PEV phenotype in dL2HGDH; dLdh double mutants, which accumulate much higher L-2HG levels than the dLdh single mutant (Fig. 5 E and F). We found that this double-mutant strain exhibits the same level of eye pigmentation as wild-type controls (Fig. 6 A and B), indicating that the ability of dLdh mutations to suppress the PEV phenotype is due to loss of L-2HG.
Fig. 6.
L-2HG influences PEV and DNA methylation. (A) Control and mutant flies harboring the In(1) y1 wm4 inversion were grown on semidefined media, and adult males were aged for 3 d before imaging the eye pigment distribution. (B) PEV phenotype of adult male flies from was quantified based on the concentration of red eye pigment (480-nm absorbance). Data are graphically represented as box plots (n > 20 adult male heads per genotype). (C and D) Ratios of 6mdA/dA in adult genomic DNA were detected by LC-tandem MS (MS/MS). Data are presented as mean ± SD (n ≥ 7). **P < 0.01; ***P < 0.001.
Fig. S8.
The dLdh mutant larvae are unable to absorb dietary L-2HG. The 2HG levels were measured in dLdhprec control and dLdh16/dLdh17 mutant larvae that were raised for 24 h on semidefined media containing 0 or 5 mM L-2HG. Data are represented as box plots (n = 6).
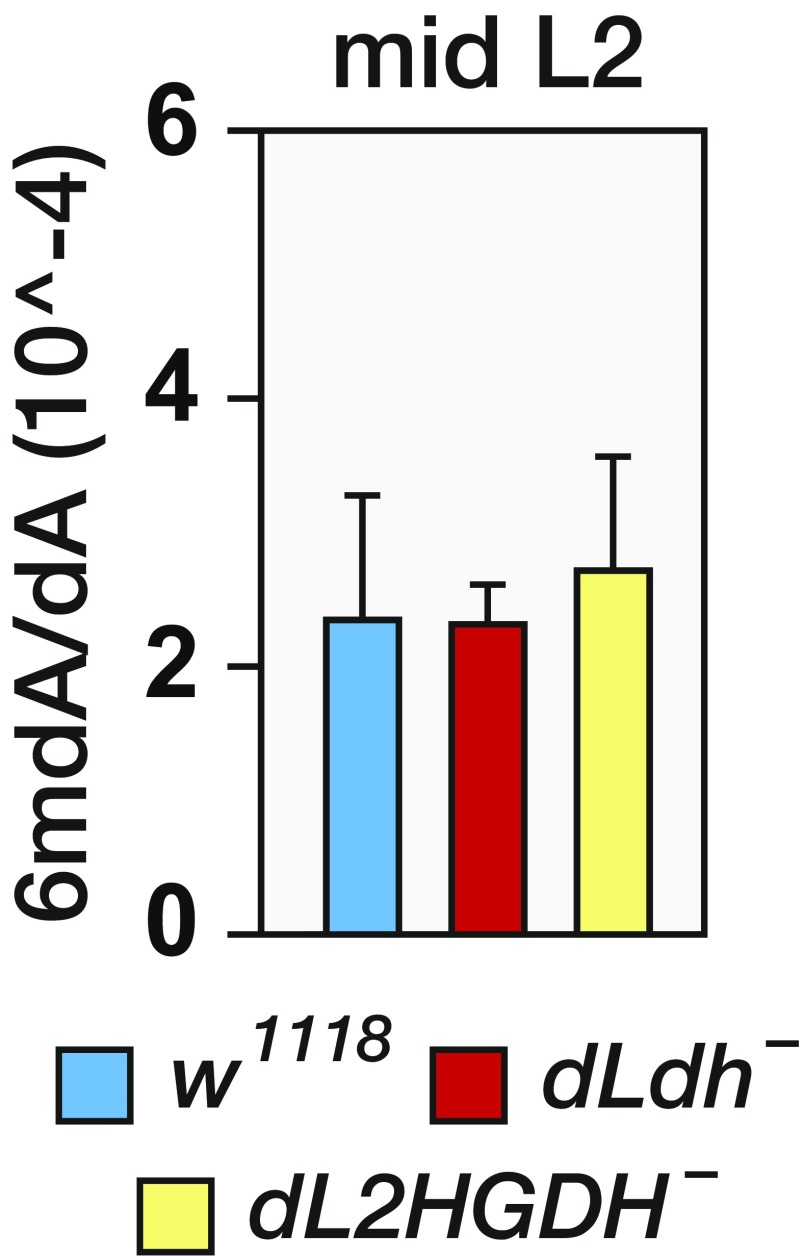
Intriguingly, we found a similar correlation between L-2HG production and DNA methylation. Although the Drosophila genome contains very low levels of 5-methylcytosine, the Drosophila Tet-family homolog was recently found to regulate N-6-methyldeoxyadenosine (6mdA) abundance in embryos (30). Therefore, we used LC-tandem MS to measure 6mdA quantitatively in larval and adult genomic DNA. Although dLdh mutants maintained normal 6mdA levels during larval development (Fig. S9), the abundance of 6mdA in adult genomic DNA was decreased in the absence of dLDH activity (Fig. 6C), suggesting that L-2HG production during larval development influences 6mdA levels in cells that will form adult tissue. In contrast, the dL2HGDH mutations did not consistently alter 6mdA levels (Fig. 6C), suggesting that similar to the PEV result, DNA methylation is sensitive to loss of L-2HG, but not to elevated amounts of this compound. Finally, the dL2HGDH; dLdh double-mutant strain exhibited significantly higher 6mdA levels than the dLdh single mutant (Fig. 6D), indicating that the dLdh mutant genomes contain fewer 6mdA residues as the result of decreased L-2HG accumulation, and revealing a direct link between synthesis of this compound and the regulation of epigenetic modifications.
Fig. S9.
Levels of 6mdA are normal in dLdh mutant larvae. The ratios of 6mdA/deoxyadenosine (dA) in mid L2 larval genomic DNA were detected by LC-tandem MS (MS/MS). Data are presented as mean ± SD (n = 7).
Discussion
L-2HG was long considered a metabolic waste product, as eukaryotic genomes lack enzymes devoted to synthesizing this molecule, most cell types quickly degrade L-2HG, and L-2HG accumulation in humans is primarily associated with disease states (3, 12, 15). Recent studies, however, indicate that L-2HG can function as a metabolic signaling molecule and demonstrate a need to better understand the normal cellular functions of this compound (17, 20, 21). Our findings establish Drosophila as a model for studying L-2HG and provide a genetic framework for conducting in vivo studies of this putative oncometabolite.
Unlike previous reports of L-2HG production in cancer cells and diseased tissues (10, 14), flies generate L-2HG in a controlled fashion, demonstrating that studies of larval metabolism can be used to elucidate the endogenous molecular mechanisms that regulate L-2HG accumulation. Intriguingly, although our analyses reveal that a majority of the larval L-2HG pool is derived from glucose oxidation, L-2HG accumulation is dependent on the normoxic production of lactate, which is a hallmark of aerobic glycolysis. These observations indicate that rapid tissue growth in flies relies on the complex integration of glucose-dependent biosynthesis, lactate production, and mitochondrial metabolism. Furthermore, our findings highlight the importance of recent stable isotope tracer studies of in vivo cancer metabolism, which revealed that tumors not only generate lactate but are also reliant on significant levels of glucose oxidation (31, 32). Because endogenous tumor metabolism appears to strike a balance between lactate production and the shuttling of pyruvate into the mitochondria, our results suggest the metabolic mechanism that generates L-2HG in flies could also function in cancer cells.
In addition to describing a metabolic feed-forward mechanism that promotes L-2HG accumulation, our findings reveal that the nuclear receptor dERR is capable of promoting L-2HG accumulation. Although recent studies in both T lymphocytes and mammalian cell culture have focused on the role of HIF1α in promoting L-2HG metabolism (17, 20, 21), siRNA targeting of HIF1α in human lung fibroblasts is not sufficient to prevent hypoxia-induced L-2HG production, hinting at an alternative mechanism that promotes synthesis of this compound. Our findings indicate that the ERR family could serve this role and suggest that future studies of L-2HG in mammalian systems should examine this conserved family of nuclear receptors.
Considering that many aspects of glucose metabolism are conserved between flies and mammals, the amount of L-2HG present in larvae is striking. Cultured mammalian cells maintain very low levels of L-2HG (17, 21), and although certain organs seem predisposed to accumulating this molecule (e.g., testis, brain) (13, 16), L-2HG is efficiently degraded in most tissues. There is a clear link, however, between disruption of mitochondrial metabolism and L-2HG production, as hypoxia, activation of HIFα signaling (21), disruption of the electron transport chain, and defects in citrate transport result in elevated L-2HG synthesis (17, 20–23). Although our study demonstrates that flies can generate L-2HG under normoxic conditions, larvae likely experience regular bouts of hypoxia, both while immersed in their food and as a direct result of rapidly increasing body size (33). Furthermore, dERR is both required for the hypoxia response in larvae and physically interacts with HIF1α (34), indicating that larval metabolism is acutely prepared to deal with a low-oxygen environment. Therefore, we propose a model wherein larvae constitutively express dLdh and generate L-2HG both as a means of supporting biosynthesis and preempting the need to frequently mount a hypoxia response. This model is supported by our findings that larval L-2HG is generated from glucose oxidation. By converting 2OG into L-2HG, larvae can couple glucose catabolism with biosynthetic processes that rely on the mitochondria (e.g., synthesis of fatty acids) regardless of oxygen availability.
L-2HG can likely inhibit dozens of enzymes, indicating that this compound could act as a means of coordinating metabolic flux with a wide range of cellular processes. Consistent with this possibility, our preliminary studies suggest that this compound regulates epigenetic modifications. Intriguingly, the manner by which dLDH activity modifies the PEV phenotype indicates that L-2HG can influence heterochromatin formation in cells that will form the adult body. Therefore, future studies of dLDH and L-2HG could serve as a model for understanding how dietary cues can influence gene expression and metabolic disease symptoms over extended periods of time. In conclusion, our findings suggest that L-2HG is more than a metabolic waste product; rather, it serves to coordinate glycolytic flux with 2OG-dependent processes, such as heterochromatin formation and gene expression.
Materials and Methods
Drosophila Husbandry and Strain Creation.
Fly stocks were maintained on Bloomington Stock Center food. Unless noted, all strains were constructed in a w1118 background and all larvae were raised on yeast paste spread over molasses agar and incubated at 25 °C. L-2HG and lactate feeding experiments were conducted using previously described semidefined media (SI Materials and Methods). The dLdh mutations were generated using standard techniques to excise the p-element {EPgy2}EY07426. All experiments used a trans-heterozygous combination of the dLdh16 and dLdh17 alleles, and a precise excision allele (dLdhprec) was used as a control. The dL2HGDH mutations were generated using CRISPR/Cas9 (SI Materials and Methods). All experiments used flies that harbored a trans-heterozygous combination of dL2HGDH12 and dL2HGDH14, which was generated by crossing homozygous dL2HGDH12 males with dL2HGDH14 virgin females.
Metabolite Analysis.
The initial detection of metabolites was conducted using previously described GC-MS protocols (35). The resulting data are presented as box plots with n = 6 samples per data point. For the enantiomer-specific analysis and 2HG quantification, each sample tube containing 25 larvae was supplemented with 8 μg of disodium (R,S)-[2,3,3-2H3]-2-hydroxyglutarate ([2H3]-2HG; C/D/N ISOTOPES) and metabolite extraction was performed as described (35). Dried samples were derivatized with R-2-butanol and acetic anhydride according to a previous report (36).
Quantification of LDH Enzyme Activity.
The Drosophila LDH cDNA was amplified from Drosophila Genomics Resource Center clone LD20346 and inserted into pGEX-4T1 (Amersham). Drosophila LDH was expressed in and purified from BL21-competent Escherichia coli using standard procedures (SI Materials and Methods). The reactions catalyzed by the purified Drosophila LDH and purchased recombinant human LDHA (BioVision) were monitored by measuring NADH consumption (OD340 using a plate reader; BioTek) at 25 °C in 200 mM Tris buffer (pH 7.5). The reaction products were confirmed by GC-MS using the methods described above.
L-2HG Degradation Assay.
Drosophila lysate was prepared according to the reported method with a little modification (19). Details are provided in SI Materials and Methods. The levels of L-2HG were detected by GC-MS as described above.
Additional details and methods are included in SI Materials and Methods.
SI Materials and Methods
Statistical Analysis.
A two-tailed Student’s t test or Wilcoxon rank test was used to determine the statistical significance according to the data distribution. P values were corrected for multiple comparisons using Bonferroni correction. We used P < 0.05 as the cutoff for statistical significance.
Drosophila Strains.
The dERR-GFP strain was a generous gift from Henry Krause, University of Toronto, Toronto. All experiments using dERR mutations used a transheterozygous combination of dERR1/dERR2. The following strains from the Bloomington Drosophila Stock Center were used for this study:
16829 y[1] w[67c23]; P{w[+mC] y[+mDint2] = EPgy2}EY07426
32578 In(1)w[m4], y[1]
33640 y[1] v[1]; P{y[+t7.7] v[+t1.8] = TRiP.HMS00039}attP2 (Ldh RNAi)
52669 y[1] M{vas-Cas9.S}ZH-2A w[1118]
Cell Culture.
Drosophila Kc167 cells were maintained in HyQ CCM3 medium (Thermo Fisher; SH3006502), whereas BG1-c1 cells were maintained in M3 + bacto peptone yeast extract (BPYE) media supplemented with 10% (vol/vol) fetal bovine serum (HyClone) and 10 μg/mL insulin. For MS experiments, cells were washed four times in PBS before processing.
Drosophila Media Preparation.
Yeast paste was prepared by mixing Fleischmann’s Dry Active Baking Yeast with distilled water. Molasses agar plates were prepared by boiling 700 mL of distilled water, 115 mL of molasses, and 29 g of agar on a hot plate for 15 min. The mixture was then cooled to 70 °C in a water bath. Ten milliliters of tegosept (methyl-p-hydroxy benzoate) and 25 mL of an acid mix (20 mL of phosphoric acid, 209 mL of propionic acid, 771 mL of water) were added to the mixture before pouring into the appropriate plates. The semidefined media used for feeding 13C-labeled compounds, L-2HG, and lactate are based on a recipe that can be found on the Bloomington Drosophila Stock Center web site (flystocks.bio.indiana.edu/Fly_Work/media-recipes/germanfood.htm).
Quantitative RT-PCR Primers.
The following primer sets were used to measure the relative abundance of dLdh mRNA:
rp49 forward: AAGTGTGCGGCTCGTATTTCG
rp49 reverse: TCATCTTGAAGCAGGTTGGGC
dLdh forward: ATACACCTCCTGGGCCATTG
dLdh reverse: CAATGCCATGTTCGCCCAAA
Generation of Genetic Reagents.
The dL2HGDH mutations were generated using CRISPR/Cas9. Briefly, guide RNA constructs that targeted two unique regions of dL2HGDH (5′-gctggcatctactataagcc-3′ and 5′-gatcgaaggcagcgagattc-3′) were designed using the Fly CRISPR Optimal Target Finder (37). Oligonucleotides containing these sequences were inserted into pU6-BbsI-chiRNA (Addgene no. 45946), and the resulting plasmid was independently injected into Bloomington Stock no. 52669 (Rainbow Transgenic Flies). Mutations were identified using a PCR-based method. For UAS-dL2HGDH, the coding region of CG10639 was PCR-amplified from Drosophila Genomics Resource Center (DGRC) clone LD39082, sequenced, and inserted into pUAST-attB. The dLdh rescue construct was generated by amplifying 7.5 kb of genomic DNA from BAC clone BACR30A03 and inserting the resulting PCR product into pAttB. A complete list of strains and reagents is provided above.
Eye Pigment Assay.
Eye pigment was quantified according to a previously described method (38). Briefly, adult male flies were aged at 25 °C for 3 d posteclosion, frozen in liquid nitrogen, and stored at −80 °C. For each genotype, a minimum of 20 flies were manually decapitated, and individual heads were extracted in 100 μL of 30% acidified ethanol (pH 2, adjusted with HCl), homogenized with a pestle, and incubated in the dark for 48 h at 25 °C. Each sample was centrifuged to clear debris, and the absorbance at 480 nm of the supernatant was measured using a BioTek Cytation 3 plate reader.
Chiral Derivatization and Detection of D-2HG and L-2HG.
Quantification of D-2HG and L-2HG was based on a previously described protocol (36) in which 0.1 mL of R-2-butanol (Sigma) and 0.01 mL of 37% HCl (Sigma) were added to each dried sample, and the samples were incubated at 90 °C for 3 h at 300 rpm using a ThermoMixer F1.5 (Eppendorf). After cooling, samples were extracted twice with 0.5 mL of n-hexane (Sigma). The collected organic phase was dried with a Speed-Vac (Savant), and 60 μL of pyridine (EMD Millipore) and 60 μL of acetic anhydride (Sigma) were then added with heating at 80 °C for 1 h. After evaporation, the residues were suspended with 60 μL of n-hexane in preparation for GC-MS analysis.
GC-MS analysis was performed on an Agilent GC6890-5973i mass spectrometer equipped with a Gerstel MPS autosampler. The chromatographic separation was achieved on a Phenomex ZB5-5 MSi column. Selected ion monitoring for quantitation was chosen to record the ions at m/z 173 for 2HG and m/z 176 for [2H3]-2HG. The quantitation was determined by comparison with [2H3]-2HG internal standard and normalized by the mass of fresh larval pellets. The density of larval pellets was estimated as the density of water.
13C-Isotope Labeling Experiments.
Larvae were incubated in Semi-Defined Food containing 50% U-13C-glucose or 64% (10 mg/mL) of U-13C-proline (Cambridge Isotope Laboratories). Metabolites were detected using GC-MS, and the labeled fraction was calculated as reported previously (39). The isotopologue distributions were corrected based on the natural abundance of elements.
Calculating the Contribution of Labeled Carbon to the L-2HG Pool.
The 2-HG isotopologue distributions are as follows: (M + 0, M + 1, M + 2, M + 3, M + 4, M + 5) = (m0, m1, m2, m3, m4, m5), where mi (i = 0, 1, 2, 3, 4, 5) is the percentage of the corresponding isotopologue (m0 + m1 + m2 +m3 + m4 + m5 = 1) and p is the percentage of U-13C-glucose or U-13C-proline in the food:
Purification of Drosophila LDH.
The dLDH cDNA was amplified from DGRC clone LD20346 using oligos 5′-atgaattcatggccgccattaaggacagtctg-3′ and 5′-tagcggccgccttagaacttcagaccagcctggac-3′, and the resulting fragment was inserted into the EcoR I and Not I sites of pGEX-4T1 (Amersham). The dLDH was expressed in and purified from BL21-competent Escherichia coli as follows. Cells were grown in LB containing 200 μg/mL ampicillin at 37 °C with shaking until OD550 = 0.6. Then, the temperature was changed to 20 °C, and protein expression was induced by adding isopropyl β-d-1-thiogalactopyranoside (IPTG) to a final concentration of 0.5 mM for about 16 h. After IPTG induction, cells were resuspended in buffer A [140 mM NaCl, 2.7 mM KCl, 10 mM Na2HPO4, 1.8 mM KH2PO4 (pH 7.3), 0.5% Triton X-100, 1 cOmplete Tablet/10 mL (Protease Inhibitor Mixture Tablets from Roche), 4 mM DTT] and lysed by sonication in an ice water bath. The 10,000 × g supernatant was loaded on Glutathione Sepharose 4B resin (GE Healthcare) for protein binding according to the manufacturer’s instructions and washed for 10 column volumes with buffer B [140 mM NaCl, 2.7 mM KCl, 10 mM Na2HPO4, 1.8 mM KH2PO4 (pH 7.3)]. After buffer B wash, the column was incubated with 0.08 U/μL thrombin (T1063; Sigma) dissolved in buffer B at room temperature for 16 h. Then, the column was eluted with buffer B, and the eluate was collected. The protein of interest was identified by SDS/PAGE, and the known reaction was catalyzed by LDH from pyruvate to lactate.
dLDH Kinetic Measurements.
For measurement of kinetic parameters, the enzymatic constants of the reaction from pyruvate to lactate were fit to the Michaelis–Menten equation by nonlinear least squares using R. The reaction from 2OG to L-2HG catalyzed by dLDH does not obey the Michaelis–Menten equation, so the kinetic parameters were fit to the Hill equation with Hill coefficient of 3.
Lactate Feeding Experiment.
Embryos were transferred to semidefined media that were supplemented with indicated concentrations of lactate (Sigma; the pH of the lactate solution was adjusted to 7.0) and incubated at 25 °C. Media for dLdh mutant larvae were also supplemented with 0.1 mM L-2HG (Sigma). Midsecond larvae (∼60 h after egg lay) for control and dL2HGDH mutant and early L2 larvae (∼48 h after egg lay) for dLdh mutant were analyzed using GC-MS.
L-2HG Degradation Assay.
Fifty male w1118 flies aged 3 d posteclosion were gently homogenized in 700 μL of lysis buffer [20 mM Hepes (pH 7.1), one tablet per 10 mL of protease inhibitor mixture tablets (Roche), 0.1% Triton X-100] with a motor and pestle on ice. The lysate was centrifuged at 100 × g for 3 min at 4 °C, and the supernatant was transferred to a new Eppendorf tube for in vitro analysis. All of the reactions were performed at 25 °C in a previously described reaction buffer [20 mM Hepes buffer (pH 7.1), 2 mM L-2HG (Sigma), 0.4 mM FAD (Sigma), 1.5 mM iodonitrotetrazolium chloride (Sigma), varied concentrations of lactate (Sigma)] for 2 h. The reactions were quenched by the addition of 1 mL of methanol (−20 °C), and the samples were dried in a SpeedVac (Savant). The levels of L-2HG were detected by GC-MS.
Synthesis of L-2HG.
Enantiomerically pure L-2HG was generated using base-catalyzed ring opening of S-(-)-5-oxo-2-tetrahydrofurancarboxylic acid (catalog no. 301469; Sigma–Aldrich). Each reaction contained 2 g of precursor in 50 mL of 0.4 M NaOH (EMD Millipore). Reactions were incubated at 95 °C for 2 h and then rapidly cooled on ice. The cooled mixtures were dried under N2(g) to concentrate contents into a 3- to 4-mL slurry. The L-2HG was separated from residual precursor on a preparative Intelliflash (Varian) flash chromatography system. The concentrated slurry was loaded onto an Agela Technologies column packed with 12 g of amino-silica beads. The mobile phase contained 95% HPLC grade MeOH (Fisher) and 5% acetic acid. The first three 15-mL fractions were saved to retain the unreacted precursor for subsequent rounds of ring opening. The column was washed with 10 column volumes with the mobile phase, and pure L-2HG was then eluted by loading the column with 15 mL of HPLC-water preheated to 55 °C, incubating for 15 min, and repeating with an additional 15 mL of preheated water. Successful separation of product from precursor was verified using LC-MS. Pure L-2HG was concentrated by drying under N2(g) and quantified by LC-MS.
DNA Methylation Analysis with Ultra-Performance Liquid Chromatography–Tandem MS.
Genomic DNA was extracted using a Wizard Genomic DNA Purification Kit (Promega). DNA samples were prepared and analyzed as described previously (40), with a little modification. One microgram of DNA was digested into single nucleosides with 5 units of DNA Degradase Plus (ZymoResearch) at 37 °C for 16 h. The digested DNA was extracted with 200 μL of cold 90% methanol three times. The supernatants were pooled together and dried by SpeedVac. The dried samples were dissolved with 25 μL of resuspension solution [water/methanol/formic acid (95:5:0.1)]. The ultra-performance liquid chromatography (UPLC)–tandem MS analysis was performed on an ultra-HPLC system coupled with a QTRAP 4000 triple-quadrupole mass spectrometer with an electrospray ion source (Sciex), operating in positive mode. Five microliters of nucleosides was injected into a reverse phase UPLC column (HSS T3 C18, 2.1 × 100 mm, 1.8-μm particle size; Waters) using isocratic conditions [water/methanol/formic acid (95:5:0.1), 300 μL⋅min−1, 45 °C column temperature] for separation provided by a Dionex Ultimate 3000 HPLC system (Dionex Corporation). The following multiple reaction monitoring transitions were monitored: m/z 252.1→136.1 for deoxyadenosine and m/z 266.1→150.1 for 6mdA. Quantification was obtained by standard curve. Analyst 1.5 software was used to calculate the quantitative results.
Acknowledgments
We thank the University of Utah Metabolomics Core, the Bloomington Drosophila Stock Center, the Drosophila Genomics Resource Center, and the Indiana University Mass Spectrometry Facility. We also thank J. Evans, A. Ordway, A. Ball, R. Sommer, K. Beebe, N. Sokol, A. Zelhof, and B. Calvi for technical assistance and advice. O.Z., A.P.R, and A.A.C. were supported by the Canadian Institutes for Health Research and the National Science and Engineering Research Council of Canada. A.A.C. is supported by the Canadian Foundation for Innovation and the Leaders Opportunity Fund and is the Canada Research Chair in Metabolomics for enzyme discovery. J.M.T was supported by a pilot/feasibility study grant from the Michigan Regional Comprehensive Metabolomics Resource Core, National Institute of General Medical Sciences/NIH R00 Pathway to Independence Award R00GM101341, and NIH R35 Maximizing Investigators’ Research Award 1R35GM119557.
Footnotes
The authors declare no conflict of interest.
This article is a PNAS Direct Submission.
This article contains supporting information online at www.pnas.org/lookup/suppl/doi:10.1073/pnas.1614102114/-/DCSupplemental.
References
- 1.Pavlova NN, Thompson CB. The emerging hallmarks of cancer metabolism. Cell Metab. 2016;23(1):27–47. doi: 10.1016/j.cmet.2015.12.006. [DOI] [PMC free article] [PubMed] [Google Scholar]
- 2.Warburg O. On the origin of cancer cells. Science. 1956;123(3191):309–314. doi: 10.1126/science.123.3191.309. [DOI] [PubMed] [Google Scholar]
- 3.Losman JA, Kaelin WG., Jr What a difference a hydroxyl makes: Mutant IDH, (R)-2-hydroxyglutarate, and cancer. Genes Dev. 2013;27(8):836–852. doi: 10.1101/gad.217406.113. [DOI] [PMC free article] [PubMed] [Google Scholar]
- 4.Struys EA, et al. Kinetic characterization of human hydroxyacid-oxoacid transhydrogenase: Relevance to D-2-hydroxyglutaric and gamma-hydroxybutyric acidurias. J Inherit Metab Dis. 2005;28(6):921–930. doi: 10.1007/s10545-005-0114-x. [DOI] [PubMed] [Google Scholar]
- 5.Dang L, et al. Cancer-associated IDH1 mutations produce 2-hydroxyglutarate. Nature. 2009;462(7274):739–744. doi: 10.1038/nature08617. [DOI] [PMC free article] [PubMed] [Google Scholar]
- 6.Chowdhury R, et al. The oncometabolite 2-hydroxyglutarate inhibits histone lysine demethylases. EMBO Rep. 2011;12(5):463–469. doi: 10.1038/embor.2011.43. [DOI] [PMC free article] [PubMed] [Google Scholar]
- 7.Xu W, et al. Oncometabolite 2-hydroxyglutarate is a competitive inhibitor of α-ketoglutarate-dependent dioxygenases. Cancer Cell. 2011;19(1):17–30. doi: 10.1016/j.ccr.2010.12.014. [DOI] [PMC free article] [PubMed] [Google Scholar]
- 8.Lu C, et al. IDH mutation impairs histone demethylation and results in a block to cell differentiation. Nature. 2012;483(7390):474–478. doi: 10.1038/nature10860. [DOI] [PMC free article] [PubMed] [Google Scholar]
- 9.Figueroa ME, et al. Leukemic IDH1 and IDH2 mutations result in a hypermethylation phenotype, disrupt TET2 function, and impair hematopoietic differentiation. Cancer Cell. 2010;18(6):553–567. doi: 10.1016/j.ccr.2010.11.015. [DOI] [PMC free article] [PubMed] [Google Scholar]
- 10.Shim EH, et al. L-2-Hydroxyglutarate: An epigenetic modifier and putative oncometabolite in renal cancer. Cancer Discov. 2014;4(11):1290–1298. doi: 10.1158/2159-8290.CD-13-0696. [DOI] [PMC free article] [PubMed] [Google Scholar]
- 11.Moroni I, et al. L-2-hydroxyglutaric aciduria and brain malignant tumors: A predisposing condition? Neurology. 2004;62(10):1882–1884. doi: 10.1212/01.wnl.0000125335.21381.87. [DOI] [PubMed] [Google Scholar]
- 12.Rzem R, Vincent MF, Van Schaftingen E, Veiga-da-Cunha M. L-2-hydroxyglutaric aciduria, a defect of metabolite repair. J Inherit Metab Dis. 2007;30(5):681–689. doi: 10.1007/s10545-007-0487-0. [DOI] [PubMed] [Google Scholar]
- 13.Rzem R, et al. A mouse model of L-2-hydroxyglutaric aciduria, a disorder of metabolite repair. PLoS One. 2015;10(3):e0119540. doi: 10.1371/journal.pone.0119540. [DOI] [PMC free article] [PubMed] [Google Scholar]
- 14.Van Schaftingen E, Rzem R, Veiga-da-Cunha M. L: -2-Hydroxyglutaric aciduria, a disorder of metabolite repair. J Inherit Metab Dis. 2009;32(2):135–142. doi: 10.1007/s10545-008-1042-3. [DOI] [PubMed] [Google Scholar]
- 15.Linster CL, Van Schaftingen E, Hanson AD. Metabolite damage and its repair or pre-emption. Nat Chem Biol. 2013;9(2):72–80. doi: 10.1038/nchembio.1141. [DOI] [PubMed] [Google Scholar]
- 16.Teng X, Emmett MJ, Lazar MA, Goldberg E, Rabinowitz JD. Lactate dehydrogenase C produces S-2-hydroxyglutarate in mouse testis. ACS Chem Biol. 2016;11(9):2420–2427. doi: 10.1021/acschembio.6b00290. [DOI] [PMC free article] [PubMed] [Google Scholar]
- 17.Intlekofer AM, et al. Hypoxia induces production of L-2-hydroxyglutarate. Cell Metab. 2015;22(2):304–311. doi: 10.1016/j.cmet.2015.06.023. [DOI] [PMC free article] [PubMed] [Google Scholar]
- 18.Schatz L, Segal HL. Reduction of alpha-ketoglutarate by homogeneous lactic dehydrogenase X of testicular tissue. J Biol Chem. 1969;244(16):4393–4397. [PubMed] [Google Scholar]
- 19.Rzem R, et al. A gene encoding a putative FAD-dependent L-2-hydroxyglutarate dehydrogenase is mutated in L-2-hydroxyglutaric aciduria. Proc Natl Acad Sci USA. 2004;101(48):16849–16854. doi: 10.1073/pnas.0404840101. [DOI] [PMC free article] [PubMed] [Google Scholar]
- 20.Tyrakis PA, et al. S-2-hydroxyglutarate regulates CD8(+) T-lymphocyte fate. Nature. 2016;540(7632):236–241. doi: 10.1038/nature20165. [DOI] [PMC free article] [PubMed] [Google Scholar]
- 21.Oldham WM, Clish CB, Yang Y, Loscalzo J. Hypoxia-mediated increases in L-2-hydroxyglutarate coordinate the metabolic response to reductive stress. Cell Metab. 2015;22(2):291–303. doi: 10.1016/j.cmet.2015.06.021. [DOI] [PMC free article] [PubMed] [Google Scholar]
- 22.Mullen AR, et al. Oxidation of alpha-ketoglutarate is required for reductive carboxylation in cancer cells with mitochondrial defects. Cell Reports. 2014;7(5):1679–1690. doi: 10.1016/j.celrep.2014.04.037. [DOI] [PMC free article] [PubMed] [Google Scholar]
- 23.Nota B, et al. Deficiency in SLC25A1, encoding the mitochondrial citrate carrier, causes combined D-2- and L-2-hydroxyglutaric aciduria. Am J Hum Genet. 2013;92(4):627–631. doi: 10.1016/j.ajhg.2013.03.009. [DOI] [PMC free article] [PubMed] [Google Scholar]
- 24.Tennessen JM, Baker KD, Lam G, Evans J, Thummel CS. The Drosophila estrogen-related receptor directs a metabolic switch that supports developmental growth. Cell Metab. 2011;13(2):139–148. doi: 10.1016/j.cmet.2011.01.005. [DOI] [PMC free article] [PubMed] [Google Scholar]
- 25.Cai Q, Lin T, Kamarajugadda S, Lu J. Regulation of glycolysis and the Warburg effect by estrogen-related receptors. Oncogene. 2013;32(16):2079–2086. doi: 10.1038/onc.2012.221. [DOI] [PMC free article] [PubMed] [Google Scholar]
- 26.Michalek RD, et al. Estrogen-related receptor-α is a metabolic regulator of effector T-cell activation and differentiation. Proc Natl Acad Sci USA. 2011;108(45):18348–18353. doi: 10.1073/pnas.1108856108. [DOI] [PMC free article] [PubMed] [Google Scholar]
- 27.Graveley BR, et al. The developmental transcriptome of Drosophila melanogaster. Nature. 2011;471(7339):473–479. doi: 10.1038/nature09715. [DOI] [PMC free article] [PubMed] [Google Scholar]
- 28.Rechsteiner MC. Drosophila lactate dehydrogenase and alpha-glycerolphosphate dehydrogenase: Distribution and change in activity during development. J Insect Physiol. 1970;16(6):1179–1192. doi: 10.1016/0022-1910(70)90208-8. [DOI] [PubMed] [Google Scholar]
- 29.Elgin SC, Reuter G. Position-effect variegation, heterochromatin formation, and gene silencing in Drosophila. Cold Spring Harb Perspect Biol. 2013;5(8):a017780. doi: 10.1101/cshperspect.a017780. [DOI] [PMC free article] [PubMed] [Google Scholar]
- 30.Zhang G, et al. N6-methyladenine DNA modification in Drosophila. Cell. 2015;161(4):893–906. doi: 10.1016/j.cell.2015.04.018. [DOI] [PubMed] [Google Scholar]
- 31.Hensley CT, et al. Metabolic heterogeneity in human lung tumors. Cell. 2016;164(4):681–694. doi: 10.1016/j.cell.2015.12.034. [DOI] [PMC free article] [PubMed] [Google Scholar]
- 32.Davidson SM, et al. Environment impacts the metabolic dependencies of Ras-driven non-small cell lung cancer. Cell Metab. 2016;23(3):517–528. doi: 10.1016/j.cmet.2016.01.007. [DOI] [PMC free article] [PubMed] [Google Scholar]
- 33.Callier V, Hand SC, Campbell JB, Biddulph T, Harrison JF. Developmental changes in hypoxic exposure and responses to anoxia in Drosophila melanogaster. J Exp Biol. 2015;218(Pt 18):2927–2934. doi: 10.1242/jeb.125849. [DOI] [PubMed] [Google Scholar]
- 34.Li Y, et al. HIF- and non-HIF-regulated hypoxic responses require the estrogen-related receptor in Drosophila melanogaster. PLoS Genet. 2013;9(1):e1003230. doi: 10.1371/journal.pgen.1003230. [DOI] [PMC free article] [PubMed] [Google Scholar]
- 35.Tennessen JM, Barry WE, Cox J, Thummel CS. Methods for studying metabolism in Drosophila. Methods. 2014;68(1):105–115. doi: 10.1016/j.ymeth.2014.02.034. [DOI] [PMC free article] [PubMed] [Google Scholar]
- 36.Gibson KM, et al. Stable-isotope dilution analysis of D- and L-2-hydroxyglutaric acid: Application to the detection and prenatal diagnosis of D- and L-2-hydroxyglutaric acidemias. Pediatr Res. 1993;34(3):277–280. doi: 10.1203/00006450-199309000-00007. [DOI] [PubMed] [Google Scholar]
- 37.Gratz SJ, et al. Highly specific and efficient CRISPR/Cas9-catalyzed homology-directed repair in Drosophila. Genetics. 2014;196(4):961–971. doi: 10.1534/genetics.113.160713. [DOI] [PMC free article] [PubMed] [Google Scholar]
- 38.Ephrussi B, Herold JL. Studies of eye pigments of Drosophila. I. Methods of extraction and quantitative estimation of the pigment components. Genetics. 1944;29(2):148–175. doi: 10.1093/genetics/29.2.148. [DOI] [PMC free article] [PubMed] [Google Scholar]
- 39.Nanchen A, Fuhrer T, Sauer U. Determination of metabolic flux ratios from C-13-experiments and gas chromatography-mass spectrometry data: Protocol and principles. Methods Mol Biol. 2007;358:177–197. doi: 10.1007/978-1-59745-244-1_11. [DOI] [PubMed] [Google Scholar]
- 40.Capuano F, Mülleder M, Kok R, Blom HJ, Ralser M. Cytosine DNA methylation is found in Drosophila melanogaster but absent in Saccharomyces cerevisiae, Schizosaccharomyces pombe, and other yeast species. Anal Chem. 2014;86(8):3697–3702. doi: 10.1021/ac500447w. [DOI] [PMC free article] [PubMed] [Google Scholar]


