Abstract
Introduction:
Badly broken or structurally compromised posterior teeth are frequently associated with crown/root fracture. Numerous restorative materials have been used to fabricate indirect full-coverage restorations for such teeth. This study aims to evaluate and compare the effect of restorative materials on the stress distribution pattern in a mandibular first molar tooth, under varying loading conditions and to compare the stress distribution pattern in five commonly used indirect restorative materials.
Materials and Methods:
Five three-dimensional finite element models representing a mandibular first molar tooth restored with crowns of gold, porcelain fused to metal, composite (Artglass), alumina-based zirconia (In-Ceram Zirconia [ICZ]), and double-layered zirconia-based materials (zirconia core veneered with porcelain, Lava) were constructed, using a Finite Element Analysis Software (ANSYS version 10; ANSYS Inc., Canonsburg, PA, USA). Two loading conditions were applied, simulating maximum bite force of 600 N axially and normal masticatory bite force of 225 N axially and nonaxially.
Results:
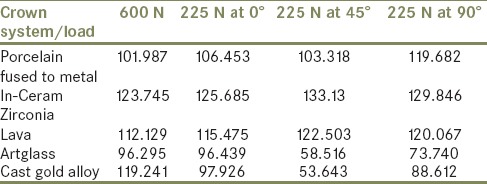
Both all-ceramic crowns allowed the least amount of stress distribution to the surrounding tooth structure. In maximum bite force-simulation test, alumina-based all-ceramic crown displayed the highest von Mises stresses (123.745 MPa). In the masticatory bite force-simulation test, both all-ceramic crowns (122.503–133.13 MPa) displayed the highest von Mises stresses.
Conclusions:
ICZ crown displayed the highest peak von Mises stress values under maximum and masticatory bite forces. ICZ and Lava crowns also allowed the least amount of stress distribution to the surrounding tooth structure, which is indicative of a favorable response of the underlying tooth structure to the overlying full-coverage indirect restorative material. These results suggest that ICZ and Lava crowns can be recommended for clinical use in cases of badly damaged teeth.
Keywords: Dental ceramic, dental crowns, finite element analysis, In-Ceram Zirconia crown, Lava crown
INTRODUCTION
Esthetic single-tooth restorations are a major focus of contemporary restorative dentistry. It is evident that material properties are one of the major factors that govern clinical judgment while fabricating a crown.[1,2,3] Vast strides have been made, exploring better materials to restore badly damaged posterior teeth.
In the present day, esthetic acceptability and biocompatibility are the primary concerns in the consideration of restorative options, thus making all-ceramic restorations immensely popular even in the posterior region. However, conventional esthetic materials have demonstrated a high incidence of fracture when subjected to time-dependent stress. To overcome this drawback, double-layered crown systems have been developed, such as alumina-based (In-Ceram Zirconia [ICZ]) and zirconia-based (Lava) materials.[4,5]
Besides all-ceramic materials, cast gold alloy, porcelain fused to metal, and ceramic-filled polymer crowns (Artglass)[6,7,8] are being routinely used in clinical practice. Furthermore, it has been documented that cast gold alloy crowns have the best longevity of all fixed restorations.[9,10]
Various studies have been conducted investigating failure behavior of individual restorative materials and the stress distribution pattern using finite element analysis (FEA).[5,11,12,13] However, negligible research has been conducted to record the response of the underlying tooth structure to stresses transmitted through different restorative materials. Moreover, there has been limited comparative evaluation of the stress distribution pattern in the aforementioned restorative materials in the past literature.
This study aimed at a comparative evaluation of the stress distribution pattern in the dentinal portion of a mandibular first molar tooth restored with five different restorative materials and a comparative evaluation of the maximum stress values induced within these restorative materials, following different loading conditions.
MATERIALS AND METHODS
The study was performed using a three-dimensional (3D) FEA.[14] A 3D cross-sectional model that consisted of 70217 nodes and 49264 elements representing the mandibular right first molar was constructed, using an FEA Software (ANSYS version 10; ANSYS Inc., Canonsburg, PA, USA). This model was then modified accordingly to incorporate approximate dimensions of different crown systems. The crown systems involved in this study are as follows:
Porcelain fused to base metal alloy (Nickel–Chromium alloy) crown (PFM)
Alumina-based all-ceramic crown: ICZ (Vident, Brea, CA, USA)
Zirconia-based all-ceramic crown: Lava (3M ESPE Dental Products, St. Paul, MN, USA) (Lava)
Indirect hybrid polymer crown: Artglass (Heraeus Kulzer Dental Ltd., Beijing, China) (ART)
Complete cast type III gold alloy crown [Gold].
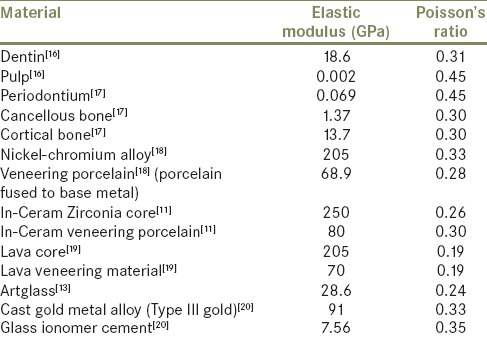
The shape and dimensions used to model the tooth and the different crown preparations were obtained from Wheeler's dental anatomy, physiology, and occlusion[15] and from Contemporary fixed prosthodontics,[9] respectively. The models also included the pulp chamber (distance from the floor of the pulp chamber to the furcation is 3 mm; the ceiling of the pulp chamber is at the level of the cementoenamel junction and height of pulp chamber is 2 mm), the periodontal ligament (0.25 mm), cortical (1.5 mm), cancellous portion of the alveolar bone (3 mm) and glass ionomer cement layer (100 µm). The dimensions for the crown systems are presented in Table 1. Elastic properties of materials and structures modeled in the study (Elastic modulus [E] and Poisson's ratio [v]) were determined from literature and are presented in Table 2.
Table 1.
Dimensions for the crown systems used in the study
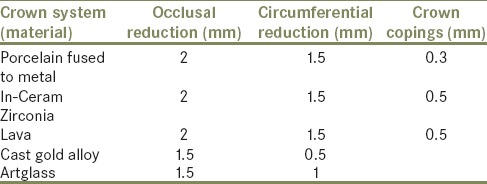
Table 2.
Material properties
The models were fixed in the nodes at the surfaces of the alveolar bone and the following assumptions were included in the finite element model: (1) all solids are homogeneous, isotropic, and linear elastic; (2) no slip was permitted between components (perfect bonding), (3) the cement layer is of uniform thickness; and (4) there are no flaws in any component.
The loading protocol followed in this study was according to previously conducted studies by Imanishi et al.[5] and Nakamura et al.[13] A distributed load simulating maximum bite force of 600 N was applied in the axial (vertical) direction. Eight different loading points were selected: three points on the outer inclines of the buccal cusps, three points on the inner inclines of the buccal cusps, and two points on the inner inclines of the lingual cusps, as shown in Figure 1a. A load of 75 N was allotted for each point. Thereafter, a distributed load simulating normal masticatory bite force of 225 N was applied axially and nonaxially: 0° to the tooth axis (vertically) (axially) [Figure 1b], 45° to the tooth axis (angularly) (non-axially) [Figure 1c], and 90° to the tooth axis (horizontally) (non-axially) [Figure 1d]. Three loading points were selected on the outer inclines of the buccal cusps and a load of 75 N for each point was applied.
Figure 1.
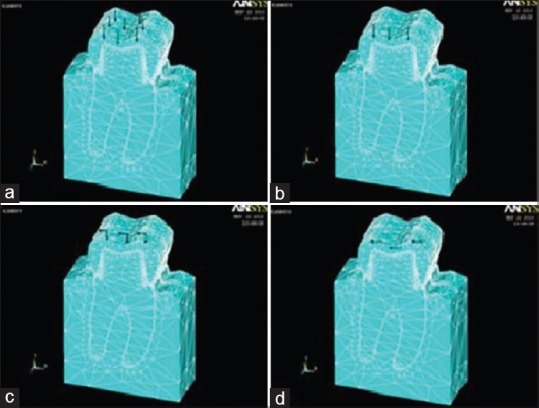
Loading protocol followed in the study, load simulating (a) maximum bite force of 600 N; (b) masticatory bite force of 225 N at 0°; (c) masticatory bite force of 225 N at 45°; (d) masticatory bite force of 225 N at 90°
Results were determined by considering von Mises criteria. The FEA revealed stresses at every node in each model. These results were displayed as stress contours overlaid on the original model. The calculated numeric data of stress in the models were transformed into color graphics. The respective numerical values of the stresses (MPa) have been given in the appendix using the color code for the respective conditions. The peak von Mises stress values in the dentinal portion of the restored tooth and the peak von Mises stress values induced within the five restorative materials were then tabulated, as indicated in Tables 3 and 4, respectively.
Table 3.
The peak von Mises stress values (MPa) in the dentinal portion of a restored tooth
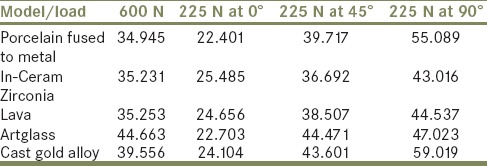
Table 4.
The peak von Mises stress values (MPa) induced within the crown
RESULTS
A consistent pattern of stress distribution was noted across all the models. The results of the von Mises stress values reveal that areas of maximum stress concentration were located in cervical third root region (in proximity to the cervical line) when the restored mandibular first molar tooth was subjected to a load of 600 N and 225 N directed axially. However, when the masticatory bite force was applied nonaxially, the areas of maximum stress concentration were located in the middle third crown region. In addition, higher stress values were noted in the cervical third portion of the roots when subjected to nonaxial masticatory bite force.
Estimation of the Von Mises Stress values in the dentinal portion of a restored mandibular first molar tooth revealed the following
Under a load simulating maximum bite force, highest value was recorded for the model simulating Artglass crown (44.66 MPa) [Figure 5d] and the lowest stress value was recorded for PFM alloy crown (34.95 MPa) [Figure 4d]. ICZ crown (35.23 MPa) [Figure 2d] and Lava crown (35.25 MPa) [Figure 3d] exhibited stress values close to PFM alloy crown. Complete cast gold alloy crown exhibited a peak von Mises stress value of 39.56 MPa [Figure 6d].
Figure 5.
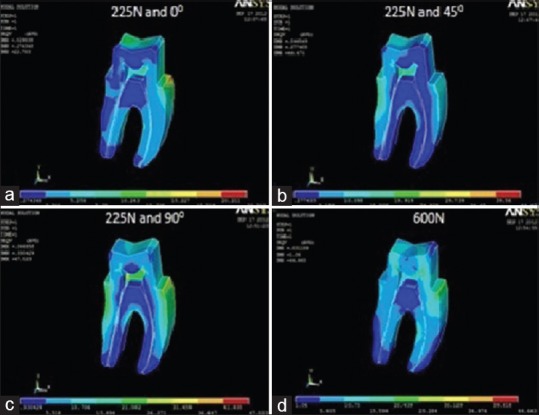
von Mises stress distribution in dentine for Artglass crown at (a) masticatory bite force of 225 N at 0°; (b) masticatory bite force of 225 N at 45°; (c) masticatory bite force of 225 N at 90°; (d) maximum bite force of 600 N
Figure 4.
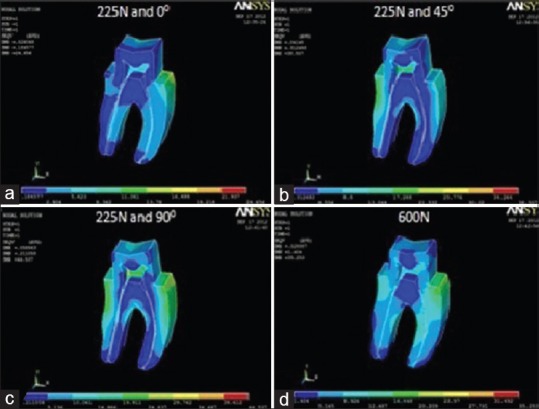
von Mises stress distribution in dentine for porcelain-fused-to-base metal crown at (a) masticatory bite force of 225 N at 0°; (b) masticatory bite force of 225 N at 45°; (c) masticatory bite force of 225 N at 90°; (d) maximum bite force of 600 N
Figure 2.
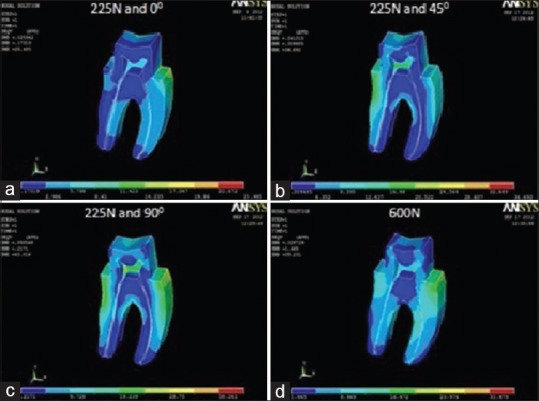
von Mises stress distribution in dentine for In-Ceram Zirconia crown at (a) masticatory bite force of 225 N at 0°; (b) masticatory bite force of 225 N at 45°; (c) masticatory bite force of 225 N at 90°; (d) maximum bite force of 600 N
Figure 3.
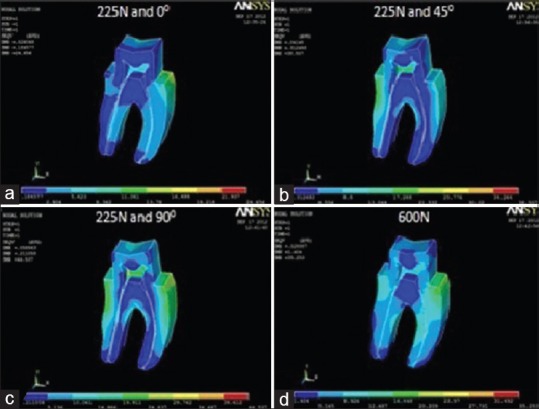
von Mises stress distribution in dentine for Lava crown at (a) masticatory bite force of 225 N at 0°; (b) masticatory bite force of 225 N at 45°; (c) masticatory bite force of 225 N at 90°; (d) maximum bite force of 600 N
Figure 6.
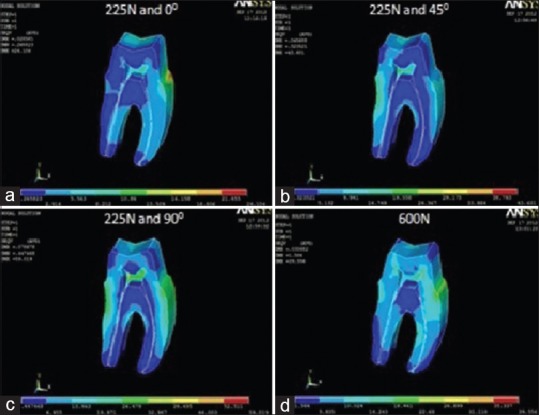
von Mises stress distribution in dentine for cast gold alloy crown at (a) masticatory bite force of 225 N at 0°; (b) masticatory bite force of 225 N at 45°; (c) masticatory bite force of 225 N at 90°; (d) maximum bite force of 600 N
Under a load simulating normal masticatory bite force, a 3-fold analysis of the von Mises stresses was conducted according to the angulation of the applied force. The first part reveals peak von Mises stress values at 225 N applied at 0° angulation. The highest stress value was recorded for ICZ crown (25.49 MPa) [Figure 2a], followed by Lava crown (24.66 MPa) [Figure 3a], complete cast gold alloy crown (24.10 MPa) [Figure 6a], and Artglass crown (22.70 MPa) [Figure 5a]. The lowest value was recorded for PFM alloy crown (22.40 MPa) [Figure 4a]. The second part reveals von Mises stress values at 225 N applied at 45° angulation. The highest stress value was recorded for Artglass crown (44.47 MPa) [Figure 5b], followed by complete cast gold alloy crown (43.60 MPa) [Figure 6b], PFM alloy crown (39.72 MPa) [Figure 4b], and Lava crown (38.5 MPa) [Figure 3b]. The lowest value was recorded for ICZ crown (36.69 MPa) [Figure 2b]. The third part reveals von Mises stress values at 225 N applied at 90° angulation. The highest stress value was recorded for PFM alloy crown (55.09 MPa) [Figure 4c], followed by complete cast gold alloy crown (55.02 MPa) [Figure 6c], Artglass crown (47.02 MPa) [Figure 5c], and Lava crown (44.54 MPa) [Figure 3c]. The lowest value was recorded for ICZ crown (43.02 MPa) [Figure 2c].
Estimation of the Von Mises Stress values induced within the five different restorative materials revealed the following
Under a load simulating maximum bite force, highest von Mises stress value was recorded in ICZ crown (123.75 MPa) [Figure 7d], followed by complete cast gold alloy crown (119.24 MPa) [Figure 11d], Lava crown (112.13 MPa) [Figure 8d], and PFM alloy crown (101.99 MPa) [Figure 9d]. The lowest stress value was recorded in Artglass crown (96.30 MPa) [Figure 10d].
Figure 7.
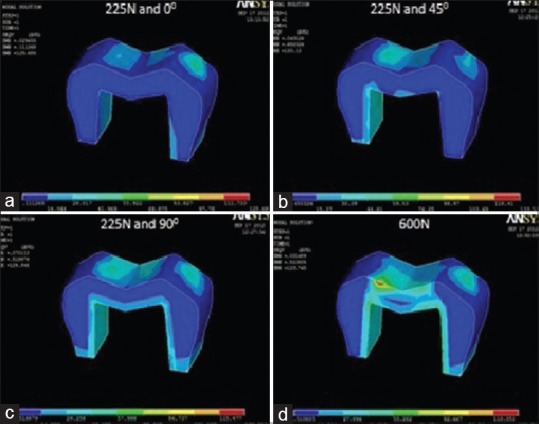
von Mises stress distribution in In-Ceram Zirconia crown at (a) masticatory bite force of 225 N at 0°; (b) masticatory bite force of 225 N at 45°; (c) masticatory bite force of 225 N at 90°; (d) maximum bite force of 600 N
Figure 11.
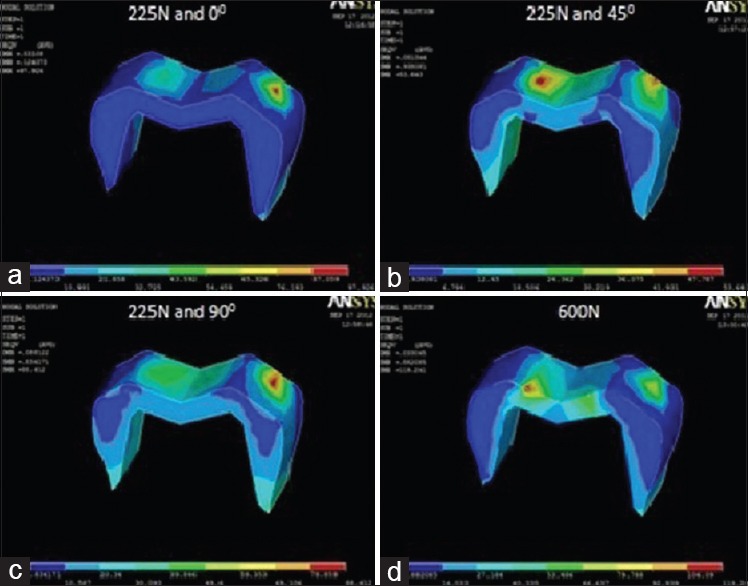
von Mises stress distribution in cast gold alloy crown at (a) masticatory bite force of 225 N at 0°; (b) masticatory bite force of 225 N at 45°; (c) masticatory bite force of 225 N at 90°; (d) maximum bite force of 600 N
Figure 8.
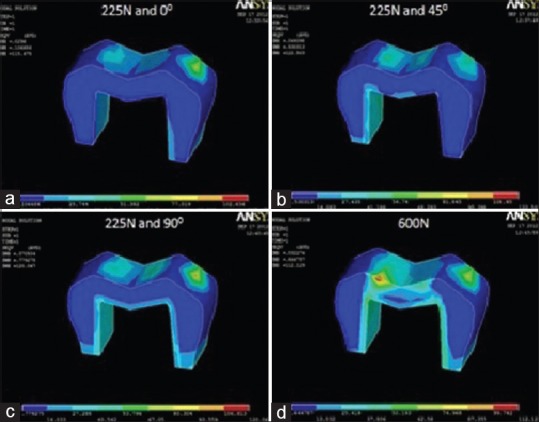
von Mises stress distribution in Lava crown at (a) masticatory bite force of 225 N at 0°; (b) masticatory bite force of 225 N at 45°; (c) masticatory bite force of 225 N at 90°; (d) maximum bite force of 600 N
Figure 9.
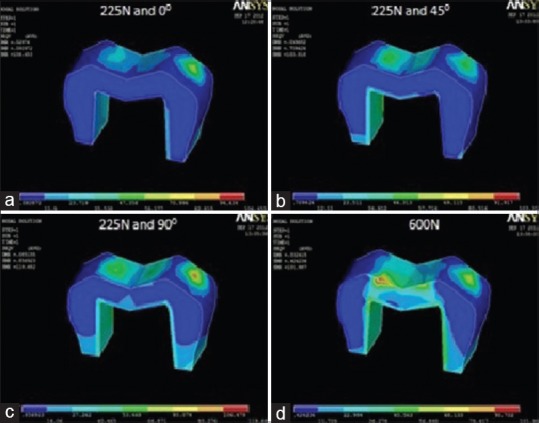
von Mises stress distribution in porcelain-fused-to-base metal crown at (a) masticatory bite force of 225 N at 0°; (b) masticatory bite force of 225 N at 45°; (c) masticatory bite force of 225 N at 90°; (d) maximum bite force of 600 N
Figure 10.
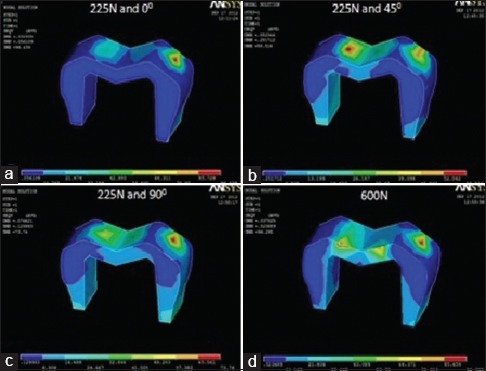
von Mises stress distribution in Artglass crown at (a) masticatory bite force of 225 N at 0°; (b) masticatory bite force of 225 N at 45°; (c) masticatory bite force of 225 N at 90°; (d) maximum bite force of 600 N
Under a load simulating normal masticatory bite force, the von Mises stresses recorded can be divided into the following three parts. The first part reveals stress values at 225 N applied at 0° angulation. The highest value was recorded in ICZ crown (125.69 MPa) [Figure 7a], followed by Lava crown (115.48 MPa) [Figure 8a], PFM alloy crown (106.45 MPa) [Figure 9a], and complete cast gold alloy crown (97.93 MPa) [Figure 11a]. The lowest value was recorded in Artglass crown (96.44 MPa) [Figure 10a]. The second part reveals stress values at 225 N applied at 45° angulation. The highest value was recorded in ICZ crown (133.13 MPa) [Figure 7b], followed by Lava crown (122.50 MPa) [Figure 8b], PFM alloy crown (103.32 MPa) [Figure 9b], and Artglass crown (58.52 MPa) [Figure 10b]. The lowest value was recorded in complete cast gold alloy crown (53.64 MPa) [Figure 11b]. The third part reveals stress values at 225 N applied at 90° angulation. The highest stress value was recorded in ICZ crown (129.85 MPa) [Figure 7c], followed by Lava crown (120.07 MPa) [Figure 8c], PFM alloy crown (119.68 MPa) [Figure 9c], and complete cast gold alloy crown (88.61 MPa) [Figure 11c]. The lowest value was recorded in Artglass crown (73.74 MPa) [Figure 10c].
DISCUSSION
The results support the rejection of the null hypothesis that the type of restorative material used to fabricate a posterior complete coverage crown would not affect the stress distribution pattern within the tooth-restoration complex of a mandibular first molar tooth. It was observed that these materials have an effect on the stress distribution pattern within the restoration-tooth complex when subjected to different loading conditions.
The analysis of the von Mises stress values revealed that ICZ and Lava crowns allowed the least amount of stress distribution to the surrounding tooth structure, followed by PFM crowns. Complete cast gold alloy crown allowed lesser amount of stress distribution to the surrounding structures compared to Artglass crown. In addition, the present study revealed areas of maximum stress concentration in cervical third root region when the restored tooth simulation was subjected to maximum bite force and vertical masticatory bite force. However, the areas of maximum stress concentration were located in the middle third crown region when the models were subjected to angular and horizontal masticatory bite force. Furthermore, higher values of stress were also noted in the cervical third portion of the roots when subjected to angular and horizontal masticatory bite force. This finding was in agreement with a past report proposed by Hojjatie and Anusavice. They attributed this phenomenon to the bending and deformation of the tooth toward the lingual side, upon horizontal loading.[21]
On analysis of the peak von Mises stress values induced within the five different restorative materials, the results in the present study support previous findings. ICZ and Lava crowns exhibited the highest peak von Mises stress values induced within the restorative material. This indicates that these crowns endured maximum stress values before distributing them to the underlying tooth structure. These results can be used to complement the purpose of the present study. Areas of maximum stress concentration were located at the loading points of the crowns for all model simulations. Moreover, increased levels of stress were also located at the cervical third of the crown when the direction of the masticatory bite force was changed from angular to horizontal direction. This was in agreement with previous FEM studies.[5,13]
Literature review reveals various FEM studies[5,11,13,18] conducted to evaluate the stress distribution pattern in different restorative crown materials used to restore a posterior tooth. Nevertheless, the objectives of the present study have been intended to complement the abovementioned studies since it seeks to examine effects that differ from those mentioned in the above studies.
The stress distribution analysis in the present study was performed by means of the quantitative association of the main maximum stresses by the von Mises criteria. When a restoration-tooth complex is subjected to loading, a combination of shear and maximum principal stresses develop within the system (known as the complex stress state). Since von Mises criteria method depends on the entire stress field, it has been commonly used as indicator for the possibility of damage occurrence.[17] In addition, since restorative materials and the underlying tooth structure are subjected to complex loading conditions including both functional and parafunctional stresses, this study aims to simulate these conditions by subjecting the computer models to a maximum bite force of 600 N and mean normal masticatory force of 225 N at three different angulations, namely, 0°, 45°, and 90°.[13] Hence, this analysis can be considered as the estimation of the worst case scenario.
A load of 600 N was employed in this study to simulate the maximum bite force. Hagberg[22] reported an average maximum bite force of 600–750 N between the molar teeth in western populations. Tortopidis et al.[23] recorded the maximum biting forces of 580 N between the molars bilaterally. Thus, 600 N is considered to represent an average maximum bite force in the molar region. The present study also included a load of 225 N to simulate the masticatory bite force. This was in agreement with Imanishi et al.[5] They considered a load of 225 N to simulate the masticatory bite force in their study. This was followed based on a report by Lungren and Laurell who stated that the usual masticatory force was approximately 37% of the maximum biting force of 600 N.[24]
The study had the following limitations. In this study, the 3D finite element models were constructed using standard anatomical data in literature. However, complicated geometrical features of the teeth were simplified during the manual construction of the FE models. In addition, several assumptions were made during designing of the models. Since the stress distribution pattern directly depends on the model design and the materials' properties assigned to each layer of the model, any inaccuracy may be directly reflected in the results. The magnitude and direction of the maximum bite force and masticatory bite force considered in this study are averaged values and may not match the in vivo conditions accurately. In addition, this study included simulations that were modeled with ideal shape of the tooth preparation and which provided an accurate fit for the restoration to the underlying tooth structure. These variables, however, may not be replicated in a badly damaged posterior tooth in a clinical situation.
Mechanical problems relating to fracture of the tooth/root have been reported as one of the complications for single crown restorations, in addition to porcelain fracture, loss of retention, periodontal disease, caries, and need for endodontic treatment.[25,26] Most clinical situations causing restoration of a single posterior tooth with a complete coverage crown may be a consequence of previous treatment procedure such as endodontic treatment or a large existing restoration that has failed due to caries or fracture. As a consequence, these conditions can result in a decrease in the load-bearing capacity of the underlying tooth structure.[27]
The tooth-restoration complex is subjected to occlusal loads which vary dramatically in magnitude, frequency, and duration.[28] This can result in considerable stress concentration within the tooth-restoration complex, which can further result in crack formation and propagation causing fracture and structural failure. Thus, the stress distribution within a system can be used as an indicator of its biomechanical behavior.[29] Failure of the restoration-tooth complex can occur in the form of noncarious cervical lesions in the tooth, cervical bone loss, and even tooth fracture. Since ICZ and Lava crowns exhibited least amount of stress distribution in the dentinal portion of the tooth upon angular and horizontal masticatory bite force loading and revealed stress values closest to PFM crown upon maximum bite force loading, these all-ceramic restorative materials can be considered as biomechanically favorable restorative materials for fabrication of a full coverage crown on a mandibular first molar tooth, in terms of stress distribution. This study suggests that all-ceramics crowns can be recommended for clinical use in cases of badly damaged or structurally compromised teeth. However, it has been reported that ceramic materials are subjected to time-dependent stress failure which is attributed to the degradation of this material in aqueous environment due to subcritical crack growth (stress corrosion). Thus, it is of utmost importance to investigate fatigue properties of dental ceramics in an aqueous environment before employing these materials in routine restorative dentistry for posterior prosthetic reconstructions.[30] Various clinical studies have been conducted in the recent years to assess the clinical performance of zirconia crowns in the oral environment.[31,32,33,34] It was noted that a number of factors affected the clinical performance of these crowns, namely, marginal integrity, color match, secondary dental caries, wear of crown and opposing dentition, and cracks in the crown. However, fracturing of the veneering porcelain was noted to be the most predominant factor, resulting in the introduction of monolithic, anatomical contour design for zirconia crowns.[34]
CONCLUSION
Within the limitations of the present study, the following conclusions were drawn:
ICZ and Lava crowns allowed the least amount of stress distribution to the underlying dentine when subjected to nonaxial masticatory bite force, followed by PFM crown. PFM crown allowed the least amount of stress distribution to the dentine when subjected to axial maximum and normal masticatory bite force. However, ICZ and Lava crowns had similar stress values to the PFM crown when subjected to maximum bite force
ICZ crown displayed the highest peak von Mises stress values under maximum bite force directed axially, followed by Gold, Lava, PFM, and ART
ICZ and Lava crowns displayed the highest peak von Mises stress values when subjected to axial and non-axial masticatory bite force, followed by PFM, Gold, and ART.
Financial support and sponsorship
Nil.
Conflicts of interest
There are no conflicts of interest.
REFERENCES
- 1.Marquardt P, Strub JR. Survival rates of IPS empress 2 all-ceramic crowns and fixed partial dentures: Results of a 5-year prospective clinical study. Quintessence Int. 2006;37:253–9. [PubMed] [Google Scholar]
- 2.Bindl A, Mörmann WH. An up to 5-year clinical evaluation of posterior in-ceram CAD/CAM core crowns. Int J Prosthodont. 2002;15:451–6. [PubMed] [Google Scholar]
- 3.McLaren EA, White SN. Survival of in-ceram crowns in a private practice: A prospective clinical trial. J Prosthet Dent. 2000;83:216–22. doi: 10.1016/s0022-3913(00)80015-3. [DOI] [PubMed] [Google Scholar]
- 4.Conrad HJ, Seong WJ, Pesun IJ. Current ceramic materials and systems with clinical recommendations: A systematic review. J Prosthet Dent. 2007;98:389–404. doi: 10.1016/S0022-3913(07)60124-3. [DOI] [PubMed] [Google Scholar]
- 5.Imanishi A, Nakamura T, Ohyama T, Nakamura T. 3-D finite element analysis of all-ceramic posterior crowns. J Oral Rehabil. 2003;30:818–22. doi: 10.1046/j.1365-2842.2003.01123.x. [DOI] [PubMed] [Google Scholar]
- 6.Behr M, Rosentritt M, Handel G. Fiber-reinforced composite crowns and FPDs: A clinical report. Int J Prosthodont. 2003;16:239–43. [PubMed] [Google Scholar]
- 7.Bohlsen F, Kern M. Clinical outcome of glass-fiber-reinforced crowns and fixed partial dentures: A three-year retrospective study. Quintessence Int. 2003;34:493–6. [PubMed] [Google Scholar]
- 8.Rammelsberg P, Spiegl K, Eickemeyer G, Schmitter M. Clinical performance of metal-free polymer crowns after 3 years in service. J Dent. 2005;33:517–23. doi: 10.1016/j.jdent.2004.11.012. [DOI] [PubMed] [Google Scholar]
- 9.Rosenstiel SF, Land MF, Fujimoto J. Contemporary Fixed Prosthodontics. 4th ed. St. Louis: Mosby; 2007. pp. 209–323. [Google Scholar]
- 10.Christensen GJ. Longevity versus esthetics: The great restorative debate. J Am Dent Assoc. 2007;138:1013–5. doi: 10.14219/jada.archive.2007.0299. [DOI] [PubMed] [Google Scholar]
- 11.Proos KA, Swain MV, Ironside J, Steven GP. Finite element analysis studies of an all-ceramic crown on a first premolar. Int J Prosthodont. 2002;15:404–12. [PubMed] [Google Scholar]
- 12.Proos KA, Swain MV, Ironside J, Steven GP. Finite element analysis studies of a metal-ceramic crown on a first premolar tooth. Int J Prosthodont. 2002;15:521–7. [PubMed] [Google Scholar]
- 13.Nakamura T, Imanishi A, Kashima H, Ohyama T, Ishigaki S. Stress analysis of metal-free polymer crowns using the three-dimensional finite element method. Int J Prosthodont. 2001;14:401–5. [PubMed] [Google Scholar]
- 14.Krishnamoorthy CS. Finite Element Analysis: Theory and Programming. 2nd ed. New Delhi: Tata McGraw-Hill Publishing Company Limited; 2007. [Google Scholar]
- 15.Ash M. Wheeler's Dental Anatomy, Physiology and Occlusion. 7th ed. Noida: Harcourt Asia Pte. Ltd; 1999. pp. 274–307. [Google Scholar]
- 16.Dejak B, Mlotkowski A. Three-dimensional finite element analysis of strength and adhesion of composite resin versus ceramic inlays in molars. J Prosthet Dent. 2008;99:131–40. doi: 10.1016/S0022-3913(08)60029-3. [DOI] [PubMed] [Google Scholar]
- 17.Oruc S, Eraslan O, Tukay HA, Atay A. Stress analysis of effects of nonrigid connectors on fixed partial dentures with pier abutments. J Prosthet Dent. 2008;99:185–92. doi: 10.1016/S0022-3913(08)60042-6. [DOI] [PubMed] [Google Scholar]
- 18.Aykul H, Toparli M, Dalkiz M. A calculation of stress distribution in metal-porcelain crowns by using three-dimensional finite element method. J Oral Rehabil. 2002;29:381–6. doi: 10.1046/j.1365-2842.2002.00826.x. [DOI] [PubMed] [Google Scholar]
- 19.Coelho PG, Bonfante EA, Silva NR, Rekow ED, Thompson VP. Laboratory simulation of Y-TZP all-ceramic crown clinical failures. J Dent Res. 2009;88:382–6. doi: 10.1177/0022034509333968. [DOI] [PMC free article] [PubMed] [Google Scholar]
- 20.Kamposiora P, Papavasilious G, Bayne SC, Felton DA. Finite element analysis estimates of cement microfracture under complete veneer crowns. J Prosthet Dent. 1994;71:435–41. doi: 10.1016/0022-3913(94)90179-1. [DOI] [PubMed] [Google Scholar]
- 21.Hojjatie B, Anusavice KJ. Three-dimensional finite element analysis of glass-ceramic dental crowns. J Biomech. 1990;23:1157–66. doi: 10.1016/0021-9290(90)90008-q. [DOI] [PubMed] [Google Scholar]
- 22.Hagberg C. Assessment of bite force: A review. J Craniomandib Disord. 1987;1:162–9. [PubMed] [Google Scholar]
- 23.Tortopidis D, Lyons MF, Baxendale RH, Gilmour WH. The variability of bite force measurement between sessions, in different positions within the dental arch. J Oral Rehabil. 1998;25:681–6. doi: 10.1046/j.1365-2842.1998.00293.x. [DOI] [PubMed] [Google Scholar]
- 24.Lundgren D, Laurell L. Occlusal force pattern during chewing and biting in dentitions restored with fixed bridges of cross-arch extension. II. Unilateral posterior two-unit cantilevers. J Oral Rehabil. 1986;13:191–203. doi: 10.1111/j.1365-2842.1986.tb00651.x. [DOI] [PubMed] [Google Scholar]
- 25.Goodacre CJ, Bernal G, Rungcharassaeng K, Kan JY. Clinical complications in fixed prosthodontics. J Prosthet Dent. 2003;90:31–41. doi: 10.1016/s0022-3913(03)00214-2. [DOI] [PubMed] [Google Scholar]
- 26.Selby A. Fixed prosthodontic failure. A review and discussion of important aspects. Aust Dent J. 1994;39:150–6. doi: 10.1111/j.1834-7819.1994.tb03083.x. [DOI] [PubMed] [Google Scholar]
- 27.Kumar P, Rao RN. Three-dimensional finite element analysis of stress distribution in a tooth restored with metal and fiber posts of varying diameters: An in-vitro study. J Conserv Dent. 2015;18:100–4. doi: 10.4103/0972-0707.153061. [DOI] [PMC free article] [PubMed] [Google Scholar]
- 28.Misch CE. Dental Implant Prosthetics. 1st ed. St. Louis: Mosby; 2005. p. 91. [Google Scholar]
- 29.Soares PV, Santos-Filho PC, Gomide HA, Araujo CA, Martins LR, Soares CJ. Influence of restorative technique on the biomechanical behavior of endodontically treated maxillary premolars. Part II: Strain measurement and stress distribution. J Prosthet Dent. 2008;99:114–22. doi: 10.1016/S0022-3913(08)60027-X. [DOI] [PubMed] [Google Scholar]
- 30.Yoshinari M, Dérand T. Fracture strength of all-ceramic crowns. Int J Prosthodont. 1994;7:329–38. [PubMed] [Google Scholar]
- 31.Rinke S, Schäfer S, Roediger M. Complication rate of molar crowns: A practice-based clinical evaluation. Int J Comput Dent. 2011;14:203–18. [PubMed] [Google Scholar]
- 32.Groten M, Huttig F. The performance of zirconium dioxide crowns: A clinical follow-up. Int J Prosthodont. 2010;23:429–31. [PubMed] [Google Scholar]
- 33.Haselton DR, Diaz-Arnold AM, Hillis SL. Clinical assessment of high-strength all-ceramic crowns. J Prosthet Dent. 2000;83:396–401. doi: 10.1016/s0022-3913(00)70033-3. [DOI] [PubMed] [Google Scholar]
- 34.Øilo M, Kvam K, Gjerdet NR. Load at fracture of monolithic and bilayered zirconia crowns with and without a cervical zirconia collar. J Prosthet Dent. 2016;115:630–6. doi: 10.1016/j.prosdent.2015.11.017. [DOI] [PubMed] [Google Scholar]


