Abstract
Background
Ultrasonic imaging is an integral and routine procedure in many medical applications. An increased awareness of the need for quality assurance in this field has led to numerous tests being proposed. Due to the complexity of the problem, the tests directly measuring the important parameters of resolution and contrast of low-echoic structures are not unified, often more qualitative than quantitative, and are performed at large periodic intervals. Uniform sensitivity of an array transducer is a necessary but insufficient requirement for imaging quality of an ultrasound probe. Good probe uniformity should in no way be confused with meaning the ultrasound probe is working as it should.
Methods
In this paper, side lobes in the elevation direction and side and grating lobes in the lateral direction are discussed. Both may provide uniform element response across the scanner, yet result in a loss of resolution and contrast. To resolve problems of these resolution and contrast-relevant parameters being overlooked, a crossed filament phantom is introduced.
Results
The cross-filament phantom provides the determination of resolution- and contrast-relevant parameters of a scanner, by directly measuring the main, side and grating-lobes of the beam in 3D. The main lobe 3D-data allows the determination of lateral and elevational resolution at different depths and thus the focal settings. In combination with the side and grating lobe information, the contrast for a small non-echoic object (i.e. a cyst) in an echoic environment may be explained.
Conclusion
We argue that regarding system acceptance, system baseline quality assurance and routine quality assurance, the analysis of the beam shape should be part of the comprehensive assessment. Combining the results with void resolution and contrast measurements is recommended.
Keywords: Ultrasound image quality, filament phantom, beam shape, side lobes, grating lobes, void phantom, uniformity, contrast, resolution
Introduction
Ultrasonic imaging is an integral and routine procedure in many medical applications. An increased awareness of the need for quality assurance has led to numerous tests being proposed. Due to the complexity of the problem, the tests directly measuring the important parameters of resolution and contrast of low-echoic structures are not unified, often more qualitative than quantitative, and are performed at large periodic intervals.1,2
Ultrasound beams are governed by interference processes which determine beam divergence angles, side lobes, grating lobes, and the Fresnel-zones with their complex interference patterns.3,4 Although wide bandwidth scanners, with their energy spread over a wide spectrum, have improved the situation, these interference effects still provide the most important limitations to ultrasound image quality. A short summary of the most important effects and their relevance for array transducers provides the arguments for introducing our proposed tests.
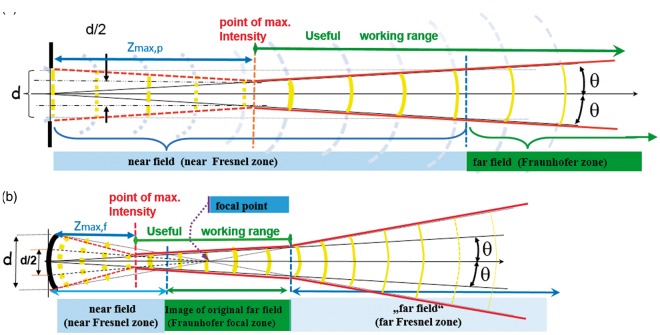
The divergence angle θ of the main beam for a plane, rectangular emitting surface is given by θ = λ/d, where λ is the wavelength and d is the width of the active transducer aperture.
The useful working range for imaging starts at the point of maximum intensity at the distance Zmax, also called the natural focus. For a circular, plane, unfocussed transducer Zmax,p = d2/4λ. The schematic diagram (Figure 1(a)) constructs these points geometrically. The Fraunhofer zone starts where the phase shifts at the centre of the beam no longer exceed λ/2· In the Fresnel zone, interference effects become more and more dominant as the transducer is approached, until they finally frustrate any imaging. In Figure 1(b), all parallel rays are shown tilted towards the focal point. Focussing moves the useful working range nearer to the transducer according to the lens equation 1/Zmax,f = 1/Zmax,p + 1/f where f is the focal length of the lens. Focussing, however, also opens up a second Fresnel zone with its increased interference patterns distal to the Fraunhofer zone.
Figure 1.
Useful working range of a transducer. (a) unfocused and (b) focused.
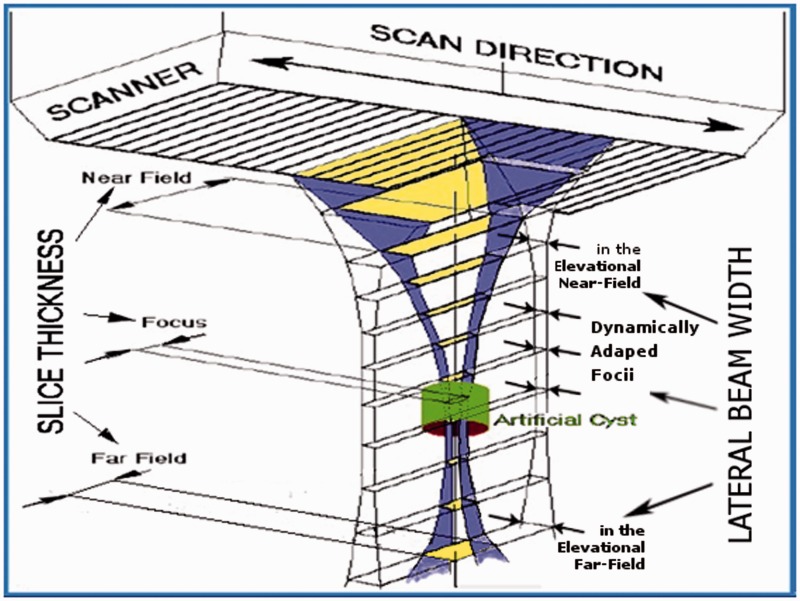
The focal distances for the lateral and elevational directions may be set independently (Lateral in this document means sideways within the B image). Linear and 1D phased arrays permit control of the focal length in the lateral plane using electronic time delays. Their focal length in the elevation direction is fixed by the cylindrical lens and cannot be changed. Overall omni-directional resolution always depends on the direction with lowest resolution; thus the useful working range is restricted to the region where the lateral and elevation ranges overlap (i.e. generally the useful working range of the cylindrical lens). Only objects larger than the slice thickness (see Figure 2) may be resolved outside this range, even if the lateral beam width is narrow there. Good visibility of a low echoic, fluid-filled structure, such as a cyst as shown in Figure 2 (referred to as a “void” in this paper), is only obtained if most of the beam enters the void.
Figure 2.
Main beam as emitted by linear arrays with a cylindrical lens and dynamic lateral focus.
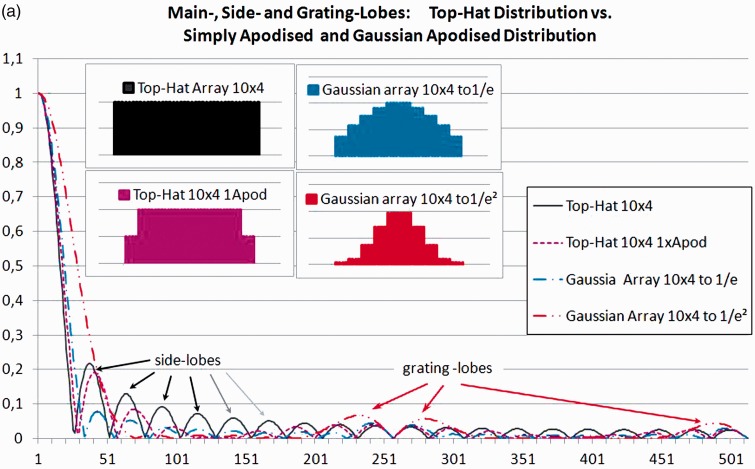
Diffraction not only determines the angle of divergence of the main beam, it also creates side and grating lobes. The fraction of energy going into the side lobes for an ideal probe without apodisation (i.e. for a top-hat-distribution) will be 16.1% at the focal distance5 if the lateral and elevational focus coincide (see Figure 3(a)). The side lobe power increases as we move from the focus towards the Fresnel zone. For strongly focussed beams, the working range will also be limited beyond the focal region, not only by the increase in divergence angle (see the red line in the far-field in Figure 1(b)), but also by drastically rising side lobes in the far Fresnel zone.3 When looking at voids (see Figure 2), this side lobe power adds to the echoes from the tissue surrounding the voids, thus reducing contrast and void visibility.
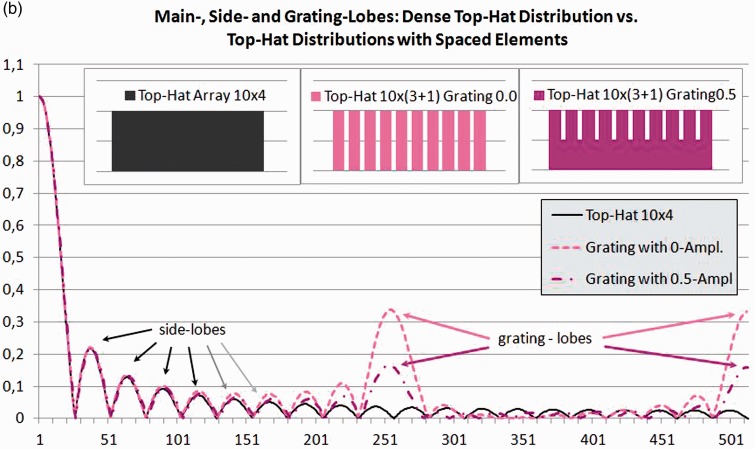
Figure 3.
One-dimensional beam profiles calculated using linear digital Fourier transform.
Apodising the amplitudes across the elements of the active arrays will reduce the side lobes but increase the main lobe width. Additionally, this apodisation introduces amplitude steps at the edge of each element (see inlays in Figure 3(a)), giving rise to grating lobes (Figure 3(a)). These grating lobes will be additionally enhanced by the phase shifts, necessary for electronically focussing or tilting the beam.
The one-dimensional digital Fourier transform (DFT)a gives the intensity distribution for a single frequency in the focal plane. (Transmit/Receive configuration: 10 elements each 4 data-points wide at the centre of an array of 1024.)
To be able to control adjacent elements in an array separately, they need good decoupling. This means that the elements, in most cases, are separate slices from a piezo crystal (Szabo chpt.5.2.3).3 The amplitude in between the separate elements depends on how and whether the gaps are filled and how the antireflection layers and the lens (i.e. the acoustic stack) contribute to the cross-coupling. Even small changes to the ultrasound probe manufacturing process can provide a considerable increase in side and grating lobes. Thus, probe manufacture is concomitant with specific and unavoidable quality tolerances.
Figure 3(b) shows calculations for a width/pitch factor for the array elements of 3:4. The power in the resulting gap was set to 0% and 50%. The grating lobes shown at the centre and on the right side of Figure 3(b) are very prominent. They will reduce void contrast and may lead to artefacts.
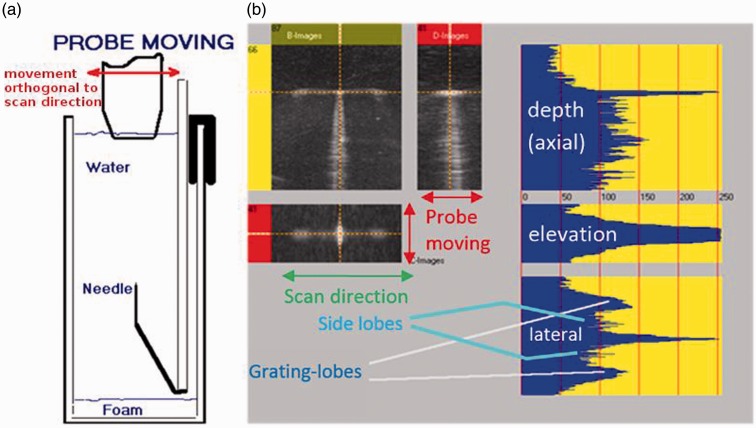
Figure 4 shows the 3D point-spread-function (PSF) measurement of a linear probe with non-adjacent defective elements using a water tank with a fixed needle reflector as described in IEC/TS 62558.6 (For a description of the test set-up, please refer to The hardware and software used for the tests section.) This test provides three orthogonal grey-scale images: the B images (Figure 4(b) – top left), i.e. the image in the plain exhibited on the systems monitor, the D image, i.e. an orthogonal image in the elevation direction (top right) and the C image, i.e. the image parallel to the scan surface at right angles to B and D (bottom left). The grey-scale profiles (blue plots) clearly show a difference of lateral and elevational width of the main beam and the relation of the main, side and grating lobes (bottom right). Grating lobes show prominently in the grey-scale image, the amplitudes being the logarithmically scaled signal amplitudes.
Figure 4.
Lateral and elevational grating lobes measured with a needle reflector. (a) Set-up; (b) 3D grey-scale images and beam profiles.
Non-functioning elements, especially if they are non-adjacent, can drastically increase grating lobes. However, even the spacing of correctly working elements (see Figure 3(b)) and the phase shifts required for focussing and tilting the beam will create grating lobes, although less prominent than in Figure 4. Simple profile measurements only providing the main lobe and the first side-lobes will miss any grating lobes, as they occur further out.
The electronics for sequential arrays will supply the same set of electronic pulses to each of the sequentially selected groups of elements. To achieve good quality, all elements in an array must produce an identical response. The response uniformity of each element, as it couples to the body, is therefore an essential requirement. Reduction or loss of response can occur during use of the transducers. This will lead to a reduction in beam quality.1,2,7
Numerous methods to determine element uniformity have been proposed, including electronic transducer testers,7 in air scan methods1 and methods measuring the uniformity of coupling to a uniform body-equivalent backscatterer or to the human body itself.6 Each method has its advantages and disadvantages.8
Uniformity on its own, although an important criterion, does not yet ensure the highest quality for the following reasons:
Experience shows that even for new systems, when comparing the same scanner and probe-type, not all probes with good uniformity will show maximal possible contrast on a void.
The influence that electronic focusing and electronic apodisation (Figure 3(a)) have on beam quality will not be detected by any uniformity tests. A change in the setting of the system for an application by the operator or software updates, including changes to the beam-forming, will change resolution and contrast without ever showing up in uniformity tests.
Quality differences due to identical changes for each element cannot be detected by uniformity tests. Deterioration of all piezo elements at about the same rate or aging of the materials in the acoustic stack would not necessarily show in a uniformity test, although some of this may be picked up by routine testing against baseline values if parameters such as return signal amplitude, capacitance or reverberation pattern in air are monitored.1 Uniformity tests can point to problem zones, but passing the uniformity test cannot yet provide the verification that all is well.
Current routine test methods, however, do not cover any changes applied to electronic focussing and changes in the elevational direction, which may still go undetected. Even the changes detected by routine tests do not directly correlate to image quality. To calculate the effect on beam forming and image quality, a detailed knowledge of the transducer design and defect would be necessary.
The goal of this work is to point out the absolute necessity to include an additional test, directly measuring beam shape or resolution and contrast, into acceptance testing and baseline testing (including routine testing using a subset of baseline testing), to be able to obtain the information relevant to ultrasound diagnostics. In particular, this study shows an efficient way of providing this additionally required information on beam quality (i.e. main lobe geometry and side and grating lobes) using a novel test object.
Methods
The traditional approach to measuring beam quality is to determine the point spread function (PSF) of a needle tip or a ball reflector as shown in Figure 4. This can only be done for one depth at a time. The required time for covering a single beam, measuring at depth intervals of 0.5 cm to 1.0 cm, will take too long for reasonable routine tests.
The hardware and software used for the tests
The hardware and software used for this work were supplied by Tissue Characterisation and Consulting (Lenaustraße 20, 4850 Timelkam, Austria), and are later versions of those used for IEC TS 62558.4
The hardware comprises a platform, a frame grabber and the phantoms. The transducer under test is mounted on the platform which is moved slowly across the respective phantom. The movement is perpendicular to the scan direction. The platform is driven manually by evenly turning a crank. The crank drives a spindle moving the platform.
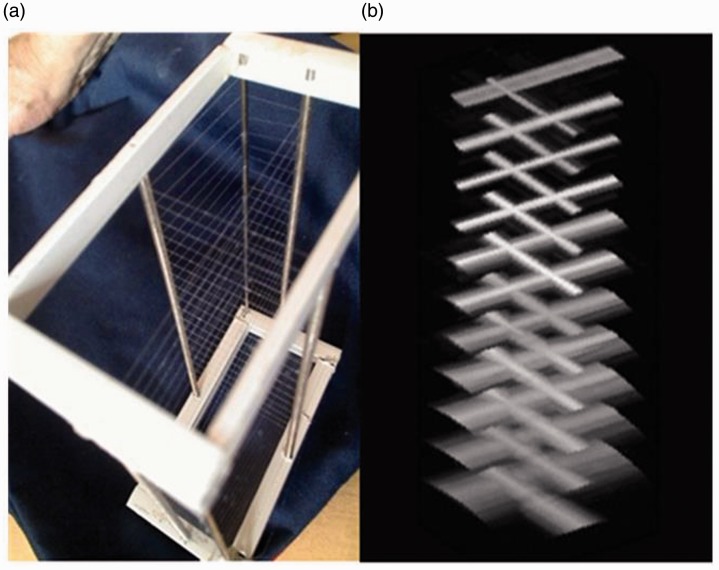
The filament phantom has filaments, positioned as shown in Figure 5(a), allowing measurement of the PSF at all depths simultaneously, thereby resolving the problem of tedious multiple measurements. To be accurate, the filaments provide line-spread functions (LSF). The omni-directionality of the back-reflection of a filament is only given at a 90° angle to the filament direction. The reflection of a wave from the filament is specular in the direction of the filament, only returning a signal to the transducer for incidence angles near to 90°. Thus the lateral profiles of a filament look very similar to the profile of the PSF of a point reflector. The filaments are so thin that the disturbance of the sound field behind the filament can be neglected, thus allowing the filaments to be placed one beneath the other. As the filaments only provide a profile at 90°, we need to two orthogonal sets of filaments to obtain beam profiles in the lateral and elevation directions simultaneously.
Figure 5.
(a) TCC Crossed filament phantom and (b) 3D volume image.
The random-void phantom consists of an open pore foam with random pore sizes filled with degassed saline solution in a sealed housing.
To pick up the B-mode image, a digital or analogue frame grabber is used (in cases where there is no access to the monitor signal using a HD video-camera is possible). The software records the B-mode images at set time intervals. Calibration of the B-mode image is done using the on-screen scale. Calibration of the translation movement of the transducer is achieved by recording a signal from the platform every millimetre. The 3D dataset is then recalculated and stored for further evaluation. Using the ultrasound B-mode image as the source of information allows 3D testing of any ultrasound imaging device in the same way independent of the scanner used.
Beam shape analysis using a crossed filament phantom
The use of filaments to replace the true PSF in the lateral direction is already documented and described in the AIUM publication ‘Methods for measuring the performance of pulse echo imaging equipment. Part II Digital methods’9 Using filaments in a scatter-free medium (e.g. saline solution) will allow recording of the profiles with all necessary details – i.e. down to very low power levels in the side lobes.
Results
The 3-D view (Figure 5(b)) shows alternating orthogonal profiles. The lateral profile is determined at a single lateral position. To allow extrapolation of the result, scanner uniformity is required. The software includes a uniformity package.
Uniformity will not work with phased arrays. As they need increased phase shifts for larger angles, side lobe generation increases at those angles, requiring additional measurements to check the respective quality reduction. For all other cases, a single 3D acquisition provides the complete information. The profiles can be plotted in 2D or 3D views (Figures 5 and 6).
Figure 6.
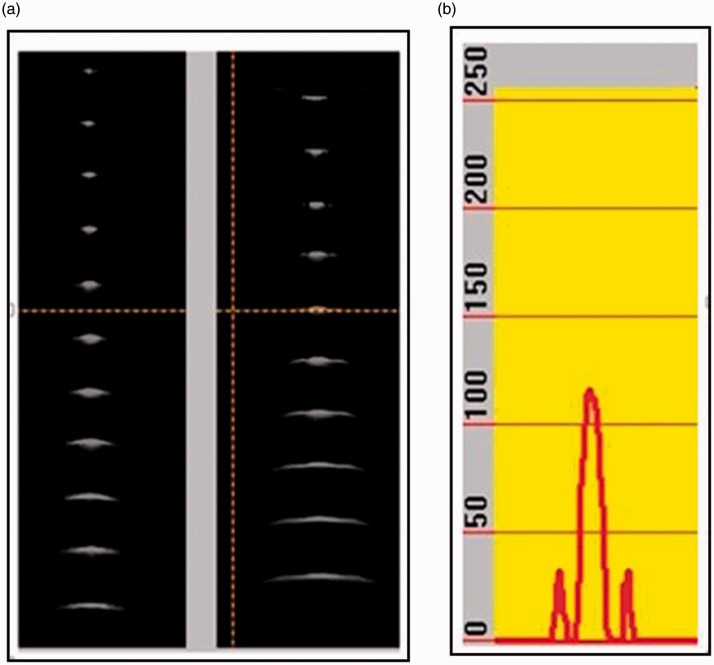
(a) Lateral and elevational beam profiles and (b) elevational amplitude plot.
The lateral profiles of all filaments in the elevation direction are shown in the B image and the elevation profiles in the D image. Grey-scale amplitude profiles can be plotted for the cursor position (see Figure 6(b)) providing more detailed and quantitative information.
At the top of the grey-scale images in Figure 6(a), we see a narrow beam in the lateral direction and a much wider beam in elevation direction. The elevation image clearly shows the fixed focus located near the third filament. The beam above and below this point widens, limiting the resolution, independently of any adaption in the lateral direction. In the amplitude plot, the side lobes in the elevation direction are clearly shown.
These distributions can be used to estimate the effect on resolution. Comparing these results with the void detectability measurements obtained according to IEC TS 625586 and with clinical results will help to improve the understanding of detection limits and probe performance.
LSF (PSF) measurements, being based on specular reflection, are very sensitive and one can often detect a reduction of quality before any test methods based on contrast and resolution can do so, as these have to cope with statistical variation in the speckle pattern.
Comparing the increase in elevation side lobes and the effect on void detection
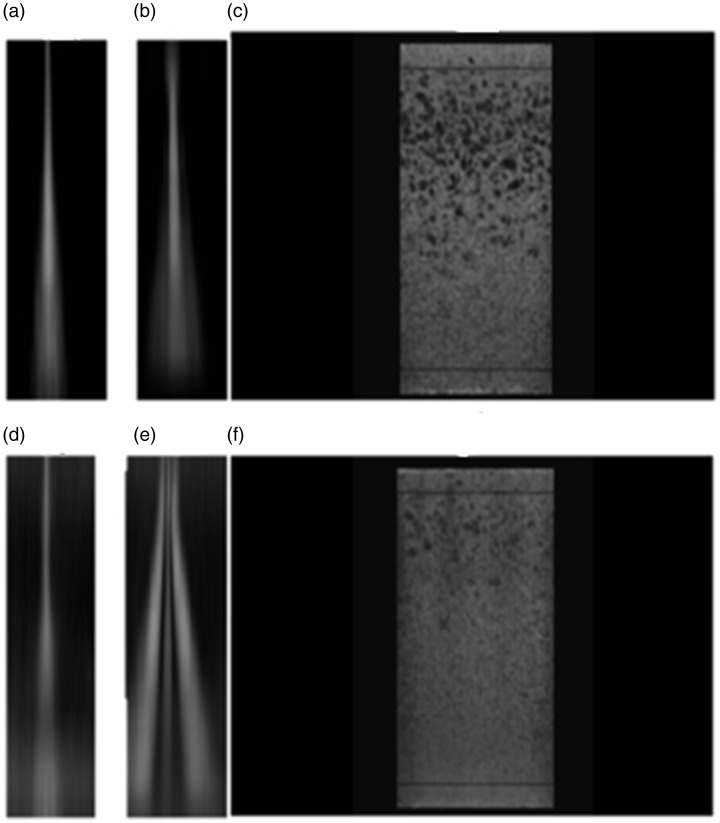
As the beam profile changes only gradually between the single filaments, it is possible to interpolate the values between two successive points. Creating a grey-scale image using these interpolations provides an improved visualisation of the side lobes (see images (a) to (e) on the left in Figure 7).
Figure 7.
Beam profiles and random void image for a transducer with intact lens (top) and of lens with a defect simulated (bottom).
Figure 7 comprises two sets of composite images showing what could be expected for a good and for a poor lens performance. The upper images in Figure 7 present the interpolated lateral (a) and elevation (b) beam profiles of an intact lens with good image quality. Within the working range, it shows low side lobes in both directions. The corresponding transparency image of a 3D volume of a random void phantom Figure 7(c) gives an excellent visualisation of void resolution in the corresponding working range. This rendered image will, however, not provide quantitative information on the beam shape.
Figure 7(d) and (e) shows the beam profiles of the same transducer after simulating the acoustic lens being disconnected along both long edges by covering the latter with an absorbing tape. A uniformity measurement would still show identical coupling for all elements. It is noteworthy that the two profiles (a) and (d) present almost equal lateral beam cross sections. Figure 7(b) and (e) on the other hand shows a pronounced change in elevation side lobes introduced by the simulation of the defect. Figure 7(f) shows the dramatic effect this change had on the void visibility (i.e. resolution) and the drastic reduction in contrast of the voids still resolved.
Discussion
Numerous parameters influence the resolution and contrast of ultrasound systems, as discussed above in the Introduction section. The number of parameters and the complexity of beam generation pose a problem when trying to devise simple acceptance and quality assurance tests. The importance of resolution and contrast for detection of small objects has been accepted for many years, but no measurement tool has yet been accepted as the gold standard. The argument given for getting round common test requirements is that there is a low correlation between some clinical results and test results2 stemming from the great variety of requirements and the tendency to cover all of these with one test.
A 3D beam shape analysis may offer the potential of one resolution-oriented test covering different aspects of resolution, providing the information needed for each specific application. Using the results, physicists can now explain why a specific probe will perform better for a specific task and why some phantoms give good quality correlation for one application and have little correlation for another.
The statistical distribution is inherent to speckle patterns. Below a certain contrast, cyst detection depends on statistical variations. Resolving or detecting one or several small objects of a given size does not necessarily mean that all objects of that size will be detectable. For low contrast or detectability ratio, there is a likelihood of false negative diagnosis. Tissue-equivalent phantoms are still important, as the filament phantom does not provide information on how the inherent speckle pattern is shown in the grey-scale image and how the signal is damped by the tissue. Looking at the maximum achievable void contrast in a void phantom should show the integral effect of side and grating lobes under tissue-equivalent conditions.
Healthcare should not accept ultrasound probes unfit for diagnostic use. The clinicians will need to define which objects should be reliably detectable for a specific application, defining minimum size, shape, orientation and contrast. The physicist can then start defining requirements for acceptance tests. The beam shapes measured on different transducers and systems will help to preselect the range of the transducers to be considered. Choosing adequate body-equivalent phantoms (like the random void phantom also shown in Figure 7) will allow the physicist to demonstrate the limits in detection reliability to the clinician, as they may have difficulties in switching from 3D-beam information to effective image quality with diffuse backscatter from tissue.
A reduction in image quality does not necessarily mean the probe needs to be taken out of service. The definition of resolution requirements for each ultrasound imaging application in conjunction with the tests proposed will lead to cost-effective probe management, allowing the use of a probe to be restricted to those applications to which it is fit.
For the manufacturers and service companies, the information provided by these tests will be valuable, because tracing a problem to its origin will be easier than otherwise trying to interpret clinical results or a result from any type of body-equivalent resolution phantom.
Conclusions
We know that beam shape directly correlates with the contrast and resolution of the images. A crossed-filament phantom with 3D acquisition software and hardware as described above can provide these measurements of the beam shape in a reasonable time. These data will help understand different limitations inherent to each ultrasound system and provide a sensitive tool to monitor change, be it due to change to the probe or to the electronic system and its settings. Measuring the main, side and grating lobes in an undisturbed surrounding as provided by a crossed filament phantom is so sensitive a test method, and it allows the detection of changes, even before they clearly show in the diagnostic image, as this is limited by the statistical distribution of the speckle signal. Small differences in contrast and resolution in a speckle image can only be recognised by highly experienced observers.
We therefore suggest it be recommended to incorporate a beam profile measurement based on the cross-filament phantom into the routine testing of all probes including new, old and repaired, thus covering the influences of all the resolution and contrast-determining parameters. Assessment of the main, side and grating lobes and diffuse spread of the beam intensity at all depths should form part of the comprehensive acceptance test protocol, providing both the information on the status on acceptance and a baseline for routine testing.
The useful working range depends on the elevation focus of the lens (see Figures 1 and 2). This can be measured using the cross-filament phantom. We suggest that any probe having its lens repaired should be tested against its baseline beam shape with special consideration given to the correct reproduction of the lens focal length.
More prominent side and especially grating lobes might appear as artefacts in an image (see Figures 3 and 4) when reflected from high echoic structures. These artefacts may result in misdiagnosis. Undetected side and grating lobes can thus present a trap for the unwary. The high-quality beam profile measurements of the crossed filament phantom provide the warning.
Currently, interpretation of the results of the PSF/LSF measurement needs the input from the physicist, thus including the test into the user test does not yet seem advisable. As the tests can monitor the beam shape, thus covering most resolution relevant parameters, shorter test intervals would seem useful to get an early warning for transducer decay. Further improvements in the test procedures may allow them to be included in the users’ tests.
We hope to further our investigation into defects generating side and grating lobes by carrying out a multicentre study to help detect defective or inadequately focused probes in clinical use and to correlate phantom studies to clinical findings.
Acknowledgements
We are grateful to the reviewers, who have greatly helped us to improve this document by a major and a smaller revision. We thank Dr Kevin Martin for supporting us with his advice and input whenever needed and helping us to get the final edition ready.
Note
Calculated by the author using Excel® integrated add-on ‘data-analysis package’.
Declaration of Conflicting Interests
The author(s) declared the following potential conflicts of interest with respect to the research, authorship, and/or publication of this article: JS is a manufacturer of the PSF and Contrast phantoms. PC is a distributor and GD has no commercial interest.
Funding
The author(s) received no financial support for the research, authorship, and/or publication of this article.
Ethical approval
Not applicable
Guarantor
GD
Contributorship
Most of the supporting experimental evidence used to underpin the argumentation was supplied by PC. Following a first draft, all of the rigorous modeling and calculation was developed by GD including the calculated profiles shown in Figure 3 using Excel® integrated add-on ‘data-analysis package’. JS provided the basic images and background information that were used for creating Figures 2, 4 and 7. During the evolution of this paper, new test methods, such as 3D PSF and acoustical contrast from JS, have thrown new light on side lobes making their understanding ever more urgent. All authors reviewed and approved the final version of the manuscript.
References
- 1.Institute of Physics and Engineering in Medicine Report 102. Quality assurance of ultrasound imaging systems. Stephen Russell (ed.). York, UK: IPEM, 2010.
- 2.Dall B, Dudley N, Hanson M, et al. NHS Cancer Screening Programmes 2011. Guidance notes for the acquisition and testing of ultrasound scanners for use in the NHS breast screening programme. NHS Breast Screening Programme Publication No 70. Sheffield: NHS Cancer Screening Programmes, 2011.
- 3.Szabo T. Diagnostic ultrasound imaging: inside out, London, UK: Elsevier Academic Press, 2004. [Google Scholar]
- 4.Bhargava SK. Principles and practice of ultrasound, New Delhi, India: Jaypee Brothers Medical Publishers, 2002. [Google Scholar]
- 5.Melles Griot Optics Guide 5. Irvine, CA: Melles Griot, 1990. ISSN1051-4384 1876115M 1290.
- 6.IEC/TS 62558. Ultrasonics – real-time pulse-echo scanners – phantom with cylindrical, artificial cysts in tissue-mimicking material and method for evaluation and periodic testing of 3D-distributions of void-detectability ratio. Geneva: International Electrotechnical Commission, 2011.
- 7.Martensson M, Olsson M, Segall B, et al. High incidence of defective ultrasound transducers in use in routine clinical practice. Eur J Echocardiogr 2009; 10: 389–394. [DOI] [PubMed] [Google Scholar]
- 8.Weigang B, Moore GW, Gessert J, et al. The methods and effects of transducer degradation on image quality and the clinical efficacy of diagnostic sonography. J Diagn Med Sonogr 2003; 19: 3–13.
- 9. AIUM Technical Standard Committee. Methods for measuring performance of pulse echo imaging equipment. Part II: Digital methods. USA: AIUM Standard, 1995


