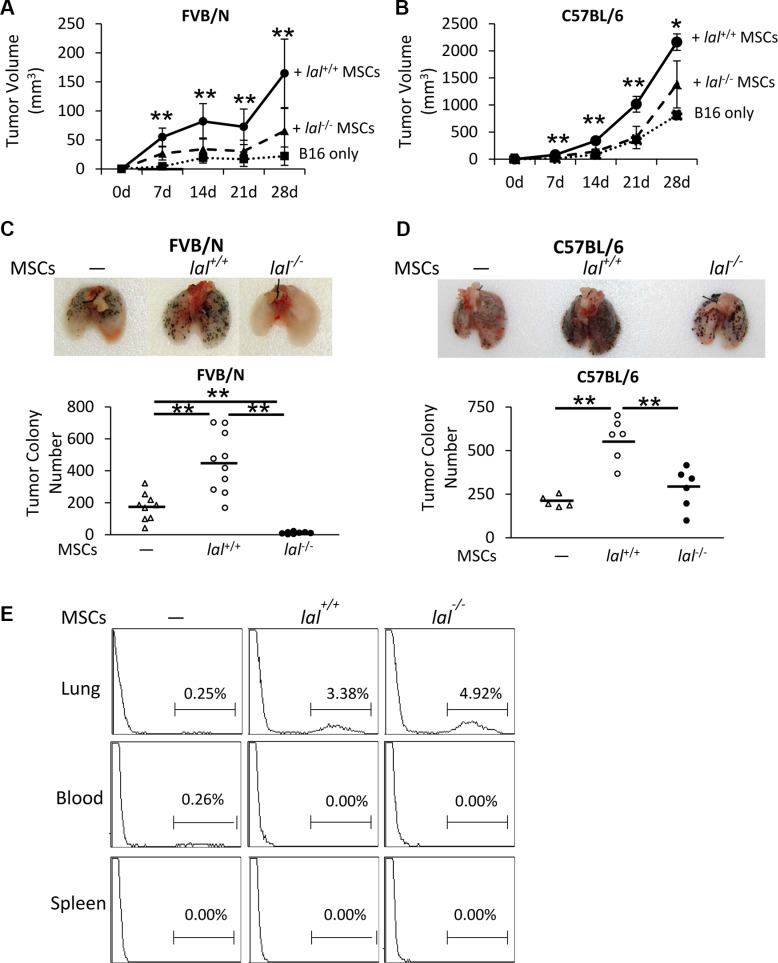
Figure 1. LAL is required for MSCs′ stimulation of tumor cell growth and metastasis.
(A) Statistical analysis of tumor volume (in cubic millimeters) at 7, 14, 21 and 28d post-injection in FVB/N mice. MSCs (6 × 10⁵) from lal +/+ or lal −/− FVB/N mice and B16 melanoma cells (2 × 10⁵) were mixed, and then injected subcutaneously into the flank region of 3-month old lal +/+ FVB/N mice. Data were expressed as mean ± SD; n = 6~10. **P < 0.01 vs. lal −/− MSCs. (B) Statistical analysis of tumor volume at 7, 14, 21 and 28d post-injection in C57BL/6 mice. The experimental condition was the same in (A). Data were expressed as mean ± SD; n = 3~6. *P < 0.05, **P < 0.01 vs. lal −/− MSCs. (C) Quantitative analysis of the melanoma colony numbers in the lungs of FVB/N mice. MSCs (8 × 10⁵) from lal +/+ or lal −/− FVB/N mice and B16 melanoma cells (4 × 10⁵) were intravenously injected into lal +/+ FVB/N mice for 2 weeks. Representative lungs are shown. Data were expressed as mean ± SD; n = 9 ~ 10. **P < 0.01. (D) Quantitative analysis of the melanoma colony numbers in the lungs of lal +/+ C57BL/6 mice. The experimental condition was the same in (C). Representative lungs are shown. Data were expressed as mean ± SD; n = 5 ~ 6. *P < 0.05, **P < 0.01. (E) Flow cytometry analysis of MSCs in the lung, spleen and blood of FVB/N mice. CMFDA-labeled lal +/+ or lal −/− FVB/N MSCs (1 × 10⁶) were intravenously co-injected with B16 melanoma cells (5 × 10⁵) into FVB/N lal +/+ mice. Sixteen hours later, the mice were sacrificed and single cells from the lung, spleen and blood were harvested for flow cytometry analysis of the existence of MSCs. Representative pictures are shown. n = 4.

