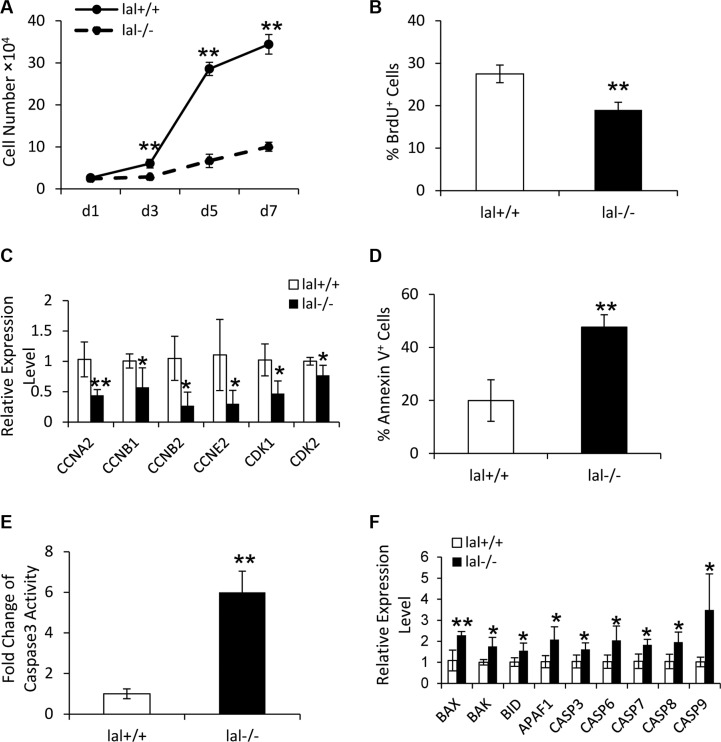
Figure 2. LAL is required for MSC proliferation.
(A) lal +/+ and lal −/− MSCs growth at d1, d3, d5 and d7. MSCs were seeded at a density of 5 × 10⁴ cells/well in 6 well plates on day 0. On day 1, 3, 5, and 7, MSCs were trypsinized and counted with a hemocytometer. The cell growth curve was then established by a graphical analysis of the data. (B) The percentage of BrdU incorporation into lal +/+ or lal −/− MSCs by flow cytometry. For both (A) and (B), data were expressed as mean ± SD; n = 5. **P < 0.01. (C) Real-time PCR analysis of mRNA expression levels of cell cycle-related molecules in lal +/+ vs. lal −/− MSCs. (D) The percentage of Annexin V+ cells in lal +/+ or lal −/− MSCs by flow cytometry analyses. Data were expressed as mean ± SD; n = 4. **P < 0.01. (E) The caspase 3 activity in lal +/+ or lal −/− MSCs. Data were normalized to lal +/+ MSCs and expressed as mean ± SD; n = 5. **P < 0.01. (F) Real-time PCR analysis of mRNA expression levels of apoptosis-related molecules in lal +/+ vs. lal −/− MSCs. For both (C) and (F), the relative gene expression was normalized to GAPDH mRNA, and analysis was performed by the 2−ΔΔCT method. Data were expressed as mean ± SD; n = 4. *P < 0.05, **P < 0.01.

