
Figure 2. Global gene expression patterns during the seven consecutive stages of human pre-implantation development.
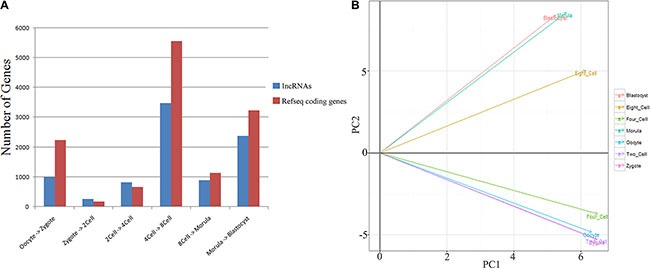
(A) Bar graph showing the total number of differentially expressed genes between successive developmental stages (q-value < 0.01 and log2 fold change > 1). (B) Principal component (PC) analysis based on lncRNA expression profiles of human pre-implantation embryos.