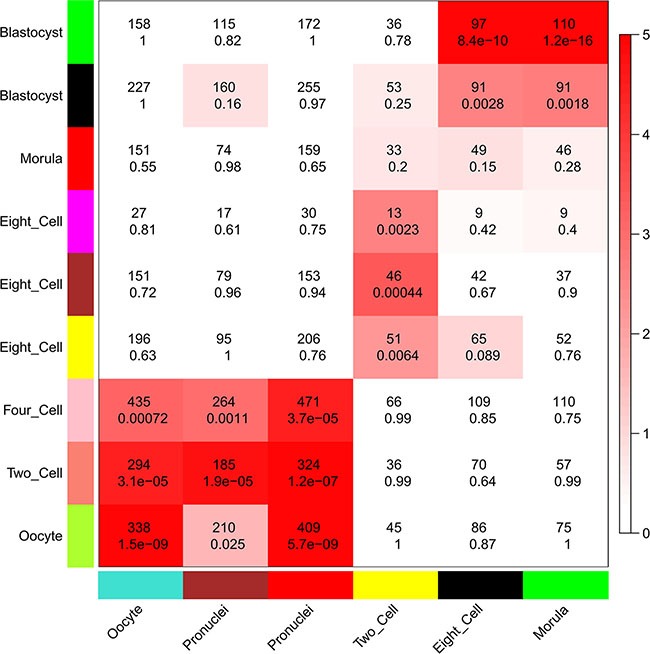
Figure 7. Comparison of modules in human and mouse early embryonic development.

Heatmap showing the significance of gene overlaps between independently constructed human and mouse modules. The x axis shows only mouse stage-specific modules (n = 6), and the y axis shows all human modules (n = 9). Each cell contains the number of intersecting genes and the P-value of the intersection. Color legend represents −log10–transformed P-values based on a hypergeometric test.
