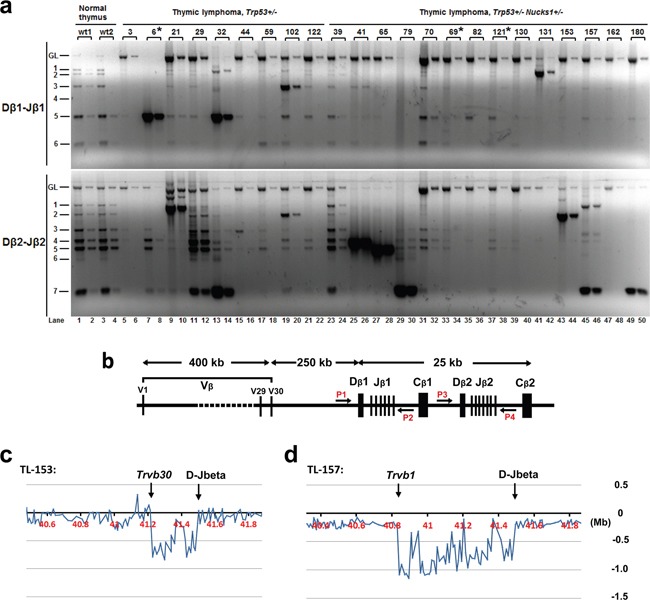
Figure 6. Analyses of Dβ-Jβ clonality at Tcrb in IR-induced TLs of Trp53+/− and Trp53+/− Nucks1+/− mice.

a. Representative agarose gels from semi-quantitative PCR analyses to assess Dβ1-Jβ1 and Dβ2-Jβ2 rearrangements at Tcrb using primer pairs P1 and P2 (Dβ1-Jβ1) and P3 and P4 (Dβ2-Jβ2), respectively, as show in (b). Fifty (odd lanes) and 5 ng (even lanes) of genomic DNA isolated from the thymi of normal wild type mice (wt1, wt2) and from IR-induced TLs of mice, with genotypes as indicated, were used. Asterisks: indicate TLs not analyzed by array-CGH. b. Schematic of the mouse Tcrb locus with relative genomic positions of the Vβ segments and Dβ-Jβ-Cβ clusters, and of PCR primers (P1, P2, P3 and P4). c, d. Tcrb rearrangements were also assessed by array-CGH analysis (representative expanded array-CGH profiles for TL-153 and TL-157 are shown). Note: For all TLs with genomic loss at Tcrb, the regions of loss spanned the Vβs and Dβ-Jβ clusters, indicative of Vβ to Jβ1 or Vβ to Jβ2 rearrangements. Minimal genomic loss was found in TL-153, as shown in c., which included Trvb30 segment, and maximal genomic loss was detected in TL-153, as shown in (d), which included the Trvb1 segment.
