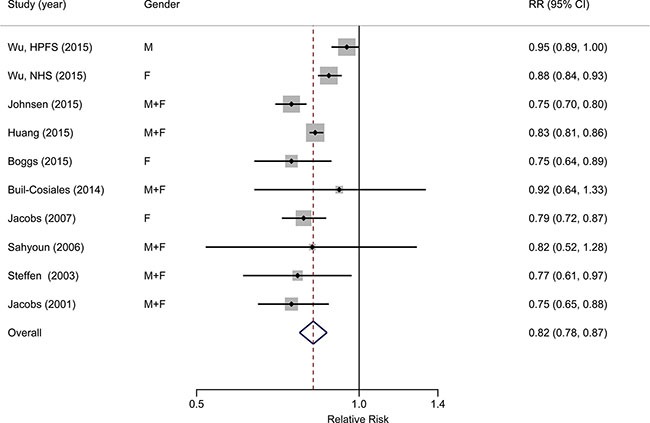
Figure 2. Forest plot (random-effects model) of the association between whole grain intake (highest category vs. lowest) and all-cause mortality.

Black points indicate study-specific RRs (the size of the square reflects the study-specific statistical weight); horizontal lines indicate 95% CIs; the diamond indicates the summary estimate with its 95% CI.
