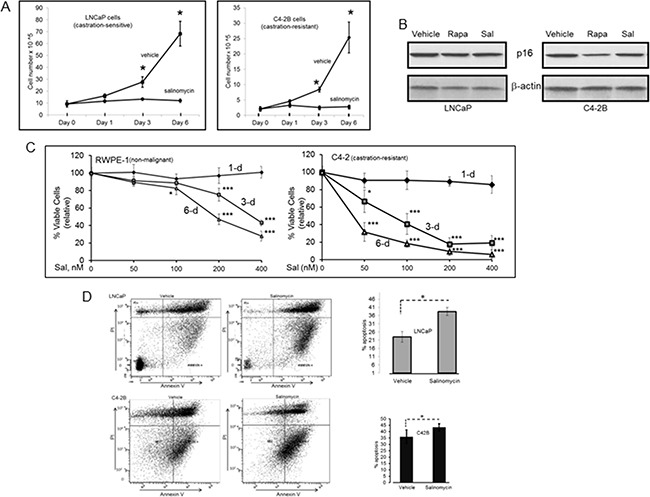
Figure 1. Salinomyin inhibited proliferation and increased apoptosis of prostate cancer cells, but did not induce cellular senescence.

A. Cell numbers at day-1, -3 and -6 post-treatment. Each point is average of three biological replicates; Cell number for an individual experiment is average from duplicate wells. At day-0, cells were seeded at equal numbers in all wells. Plots show viable cells relative to the starting number of seeded cells. * p<0.05. B. p16 western blotting to assess cellular senescence. C. RWPE-1 and C4-2 viable cells over 1-, 3- and 6-day periods at 50 nM, 100 nM, 200 nM and 400 nM Sal. Each data point is average of three biological replicates. * p<0.05; *** p<0.001. D. Early apoptotic cells. Dual parameter dot plots combined AnnexinV-Fluorescein isothiocyanate (FITC) and propidium iodide (PI) fluorescene. Viable cells (AnnexinV−PI−), lower left quadrant; early apoptotic cells (AnnexinV+PI−), lower right quadrant; upper right and left quadrants, late apoptotic/necrotic cells. Bar graphs show early-apoptosis cell numbers at 3-day post-treatment; *p<0.05. Sal: salinomycin; Rapa: rapamycin.
