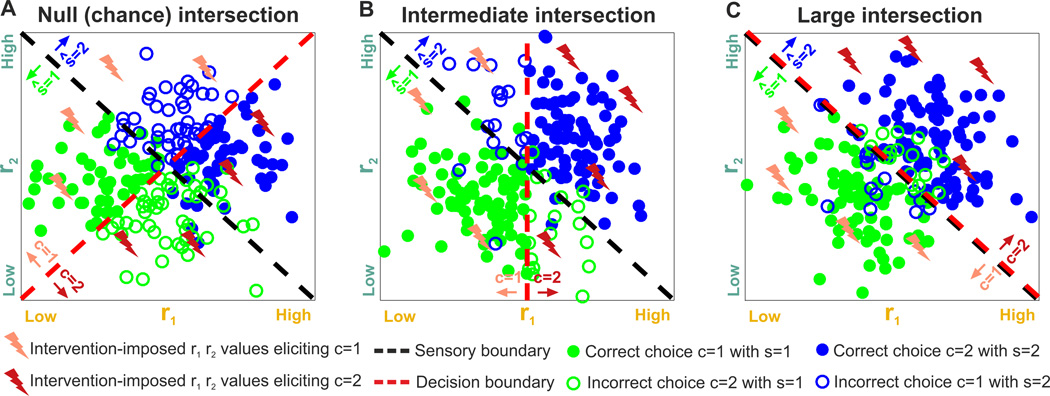
Fig 5. Schematic of an experimental design to probe intersection information with intervention.
Three examples of neural responses (quantified by features r1, r2) to two stimuli, with conventions as in Fig. 3. We assume that some patterns of neural activity are evoked by interventional manipulation in some other trials. The “lightning bolts” indicate activity patterns in r1, r2 space evoked by intervention: they are color-coded with the choice that they elicited (as determined by the decision boundary – the dashed red line). Choice c=1 is color-coded as pink, and c=2 as dark red. The choices evoked by the intervention can be used to determine, in a causal manner, the position of the decision boundary (as the line separating different choices). The correspondence between the stimulus that would be decoded from the neural responses to the intervention-induced choice can be used to compute interventional intersection information. A) A case with no interventional intersection information (the sensory and decision boundary are orthogonal). B) A case with intermediate intersection (the sensory and decision boundary are partly aligned). C) A case with large intersection (the sensory and decision boundary are fully aligned).

