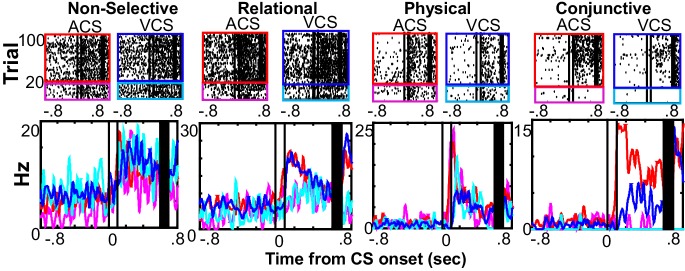
Figure 4. Single prefrontal neurons showed selectivity for the different features of the memory.
Representative raster plots and peri-stimulus time histograms (1 ms bins, smoothed with a 50 ms Hanning window) for each of four conditions (the presentation of auditory CS alone, magenta; pairings of the auditory CS and US, red; the presentation of visual CS alone, turquois; pairings of the visual CS and US, blue). Although some neurons showed the same CS-evoked firing patterns across four conditions (Non-selective), others were found with firing rate changes dependent on a relational feature (Relational, rates in CS-US paired trials differed from rates in CS-alone trials), a physical feature (Physical, rates in trials with the ACS differed from those with the VCS), or their conjunction (Conjunction, rates in one condition differed from the other conditions). Two black lines indicate CS onset and offset, and black bars mask the artifact induced by the US.
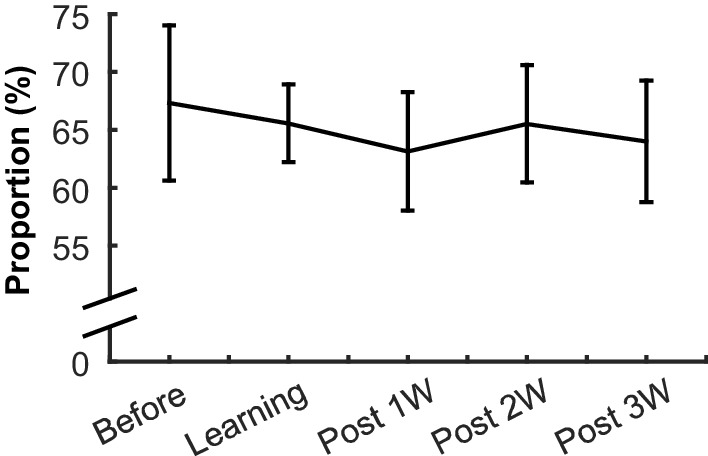
Figure 4—figure supplement 1. The proportion of neurons responding to the CS in each learning stage.


