Abstract
BACKGROUND AND PURPOSE:
Infantile neuronal ceroid lipofuscinosis is a devastating neurodegenerative storage disease caused by palmitoyl-protein thioesterase 1 deficiency, which impairs degradation of palmitoylated proteins (constituents of ceroid) by lysosomal hydrolases. Consequent lysosomal ceroid accumulation leads to neuronal injury, resulting in rapid neurodegeneration and childhood death. As part of a project studying the treatment benefits of a combination of cysteamine bitartrate and N-acetyl cysteine, we made serial measurements of patients' brain volumes with MR imaging.
MATERIALS AND METHODS:
Ten patients with infantile neuronal ceroid lipofuscinosis participating in a treatment/follow-up study underwent brain MR imaging that included high-resolution T1-weighted images. After manual placement of a mask delineating the surface of the brain, a maximum-likelihood classifier was applied to determine total brain volume, further subdivided as cerebrum, cerebellum, brain stem, and thalamus. Patients' brain volumes were compared with those of a healthy population.
RESULTS:
Major subdivisions of the brain followed similar trajectories with different timing. The cerebrum demonstrated early, rapid volume loss and may never have been normal postnatally. The thalamus dropped out of the normal range around 6 months of age; the cerebellum, around 2 years of age; and the brain stem, around 3 years of age.
CONCLUSIONS:
Rapid cerebral volume loss was expected on the basis of previous qualitative reports. Because our study did not include a nontreatment arm and because progression of brain volumes in infantile neuronal ceroid lipofuscinosis has not been previously quantified, we could not determine whether our intervention had a beneficial effect on brain volumes. However, the level of quantitative detail in this study allows it to serve as a reference for evaluation of future therapeutic interventions.
Neurodegeneration is a devastating manifestation in most of the >50 known lysosomal storage disorders. Among the neurodegenerative lysosomal storage disorders, neuronal ceroid lipofuscinoses,1–3 also known as Batten disease,4,5 are the most common. Mutations in at least 13 different genes (ceroid-lipofuscinosis, neuronal [CLN]) cause various types of neuronal ceroid lipofuscinoses.6 Among these genes, CLN1, CLN2, CLN10, and CLN13 encode lysosomal enzymes; CLN4 and CLN14 encode peripherally associated cytoplasmic proteins; CLN5 encodes a soluble lysosomal protein; CLN11 encodes a protein in the secretory pathway; and several transmembrane proteins with varying subcellular localizations are encoded by CLN3, CLN6, CLN7, CLN8, and CLN12.7 The infantile type, infantile neuronal ceroid lipofuscinosis (INCL),8 has an early age of onset and rapid progression to death. INCL is caused by mutations in the CLN1 gene,9 which encodes palmitoyl-protein thioesterase 1. Patients with INCL appear healthy at birth, but by 11–18 months of age, they exhibit developmental delay, followed by loss of developmental milestones. Many develop seizures. By 2 years of age, they are blind due to retinal degeneration, and they reach a persistent vegetative state at around 4 years of age, manifested by an isoelectric electroencephalogram (EEG) (including visual-evoked potentials).10 This grim trajectory highlights the desirability of developing an effective therapy for this disease.
The pathologic findings include intralysosomal accumulation of autofluorescent material (ceroid), rapidly progressing brain atrophy resulting predominantly from loss of neurons in the cerebral cortex, and neuroinflammatory findings11 in the early stages. The accumulation of ceroid results in the formation of granular osmiophilic deposits,12,13 which can be visualized in the brain and other tissues by using electron microscopy.
Previous in vitro studies demonstrated that phosphocysteamine had a beneficial effect on INCL-derived cell cultures, resulting in depletion of ceroid deposits and suppression of apoptosis.14 The antioxidant N-acetyl cysteine has been reported to be beneficial in other neurogenerative diseases.15 These 2 observations led us to conceive a study of a combination therapy with these 2 drugs. Because INCL is a rare disease (1 in >100,000 births) with a short life expectancy, recruitment of a large study group is impractical; this issue led to a “compassionate use” type of experimental design in which all patients received treatment, without a control group. The intention was to compare with the natural history and future treatment interventions by using behavioral and developmental assessments and quantifiable measures such as electroencephalography, electroretinography, MR imaging–derived brain volume measurements, MR spectroscopy, and quantification of intralysosomal ceroid deposits. An overview of the study results has been published recently16; the current report details the MR imaging–derived brain volume measurements.
Materials and Methods
Study Participants
Recruitment and inclusion criteria for this study have been described in detail elsewhere (ClinicalTrials.gov number NCT00028262).16 Ten patients were recruited for the study, 9 of whom had treatment initiated after the baseline study and returned for follow-up; the other patient dropped out of the study after the baseline evaluation and did not undergo treatment. The CLN1 gene mutations represented in our patient sample were C451T, T29A, A364T, A169i, and 798+2T>C. The patients were all younger than 3 years of age on entry to the study.
Treatment
Following initial evaluation, the 9 patients who continued in the study began oral treatment with cysteamine bitartrate (Cystagon) at 10 mg/kg per day, escalated weekly to a target of 60 mg/kg per day. After achieving this target dose, oral treatment with N-acetyl cysteine (Mucomyst) was added at 10 mg/kg per day and escalated weekly to a target of 60 mg/kg per day. Treatment was discontinued after demonstration of an isoelectric electroencephalogram or when the patient was too sick to travel for follow-up appointments; this was an interval of 8–75 months after initiation of treatment, at which time follow-up also stopped.
MR Imaging
Patients.
Eight patients were studied by using a 1.5T Signa scanner (GE Healthcare, Milwaukee, Wisconsin) with a quadrature transmit-receive head coil. Two patients were studied by using a 3T Achieva scanner (Philips Healthcare, Best, the Netherlands) with an 8-channel SENSE head coil. A standard noncontrast clinical MR imaging examination was performed in all patients; this included either axial or sagittal 3D-SPGR images or axial 3D-MPRAGE images. Axial or sagittal 3D-SPGR images were acquired with the following parameters: FOV = 200 × 200 mm or 240 × 240 mm, acquisition matrix = 256 × 256, reconstruction matrix = 256 × 256, section thickness = 1–2 mm, NEX = 1, TE = 2.2–5.5 ms, TR = 9.5–12.8 ms. Axial 3D-MPRAGE images were acquired with the following parameters: FOV = 220 × 220 mm, acquisition matrix = 256 × 131, reconstruction matrix = 256 × 256, section thickness = 1 mm, NEX = 2, TE = 6.6 ms, TR = 11.5 ms, echo-train length = 131.
Sedation
Because all patients were young children, most examinations were performed with the patient under sedation with propofol.17 Some late-stage patients did not require sedation for the MR imaging examinations.
Brain Volume Measurement
Brain volumes were calculated by using the 3D-SPGR or 3D-MPRAGE images. Medical Image Processing, Analysis, and Visualization software18 (MIPAV; http://mipav.cit.nih.gov/) was used to manually generate a mask that stripped the skull, meninges, and other tissues away from the brain; a shading correction was applied to compensate for radiofrequency transmission nonuniformity; and finally, a single-channel 3-tissue maximum likelihood classifier was applied to the area within the mask to estimate the volume of the brain parenchyma. The mask was manually subdivided into cerebrum, cerebellum, and brain stem to separately measure these volumes. For healthy controls, we used images from 23 healthy volunteers (12 girls, 11 boys; 1.1–9.6 years of age) participating in other research studies at our institution who had been scanned using imaging parameters similar to ours; control brain volumes were measured in the same manner as the brains of patients with INCL.
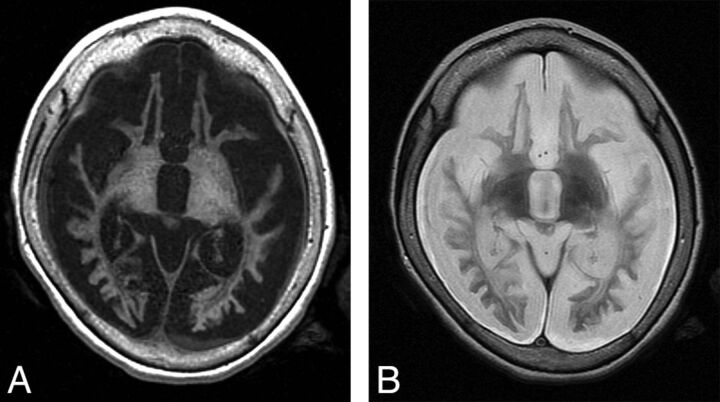
Measurement of the thalamus volumes was challenging due to the abnormal intrinsic tissue contrast that obscures the boundaries between the deep nuclei and adjacent structures (Fig 1); this issue becomes worse as the disease advances. Therefore, we devised a scheme based on using surface landmarks to draw 3 perpendicular diameters of an ellipsoid to approximate the volume of the thalamus (On-line Fig 1). The same measurements were performed on our images of healthy volunteers.
Fig 1.
MR imaging findings in end-stage INCL. T1-weighted (A) and T2-weighted (B) images in the plane defined by the anterior and posterior commissures. These images demonstrate findings that include extreme atrophy, near-complete lack of gray matter, extensive abnormal signal in the white matter, loss of internal landmarks separating the basal ganglia, and subdural effusions.
Statistical Tests
We applied the Student t test to our total and segmental brain volumes to check for sexual dimorphism in our patients and healthy volunteers. The SD of the healthy volunteers (difference from the fitted curve) was also calculated.
Curve Fitting
For both patients and healthy volunteers, linear, quadratic, power, and logarithmic curves were fitted to the volume measurements as a function of age. For each measurement, the curve with the highest r value (Pearson correlation coefficient) is shown in the relevant figure.
Results
Demographics
Forty-five scans were obtained in 10 patients; 43 of these scans could be used for volume calculations, while the other 2 had motion artifacts severe enough to exclude them from the analysis. Of the 43 useable scans, 25 were obtained in girls, and 18, in boys; the number of volume calculations performed for each patient ranged from 1 to 8. The overall age range of the patients at the time of the examination was 0.88–8.40 years. Applying the Student t test to the total brain volume and to the segmental brain volumes did not reveal sexual dimorphism in our sample; therefore, further analysis combined the results for boys and girls. Plotting segmental volumes for each mutation separately revealed overlapping curves with similar slopes (On-line Fig 2), confirming previous observations that these genotypes produce a uniform phenotype19; therefore, further analysis combined the results of all genotypes.
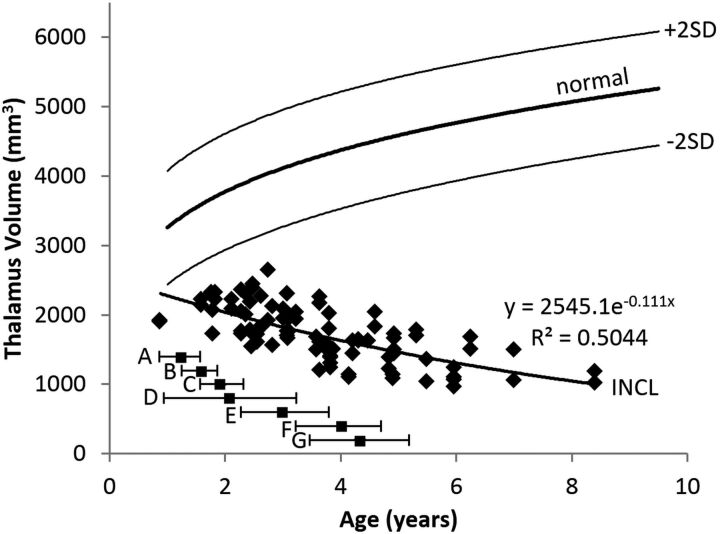
Thalamus Volume
The evolution of thalamus volumes is shown in Fig 2. The plot shows that the measurements on even the youngest patients were out of the normal range; the curve extrapolates into the normal range, suggesting that thalamus volume could have been normal (or near-normal) for a few months after birth. The initial decline in thalamus volume was gradual, and the rate of decline decreased with age. The pattern was best described by an exponential equation.
Fig 2.
Thalamus volume measurements in patients with INCL. Due to lack of visible boundaries of the thalamus (secondary to disease-related alterations in intrinsic contrast), an ellipsoidal approximation to the volume was made on the basis of brain surface landmarks. Thalamus volumes were out of the normal range by the time of our earliest measurements and further decreased with time. The equation for the best curve fit is shown. We did not detect a difference between INCL in boys and girls (P = .98). The normal curve reflects thalamus volumes measured on 23 healthy volunteers 1.1–9.6 years of age participating in other studies at our institution; for the healthy volunteers, we did not find a statistical difference between boys and girls (P = .89) or between right and left (P = .86) (dark line = mean, light lines = ±2 SDs). For comparison, the onset ages of major clinical findings (mean and 95% CI) observed in our patients are plotted below the volume curve. A indicates developmental regression; B, cerebral atrophy noted in clinical MR imaging report; C, myoclonic jerks and seizures; D, loss of vision; E, deceleration of head growth; F, isoelectric visual-evoked potentials; and G, isoelectric EEG or electroretinogram.
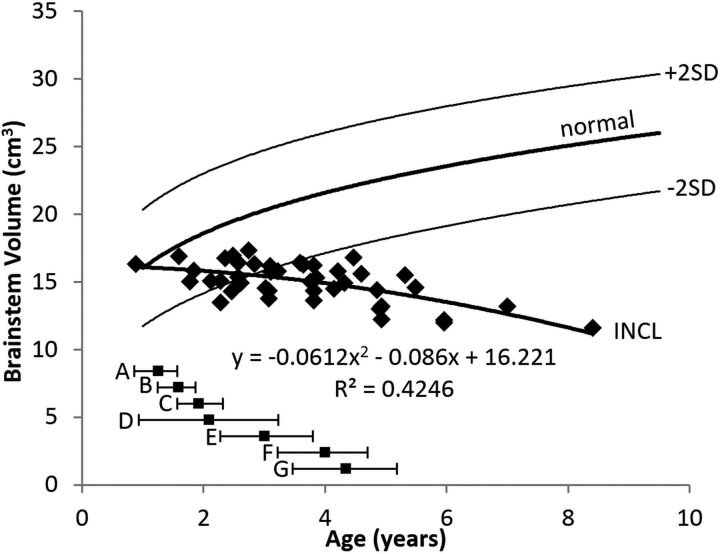
Brain Stem Volume
The evolution of brain stem volumes is shown in Fig 3. The plot shows that the measurements on the youngest patients fell within the normal range; therefore, we presume that the evolution before our measurements was normal. The initial decline in the brain stem volume was gradual, but the rate of decline increased with age. The pattern was best described by a quadratic equation. The patients' average fell out of the normal range (below the 2.5th percentile) by 3 years of age.
Fig 3.
Brain stem volume measurements in patients with INCL. Brain stem volumes decreased with time, dropping below the 2.5th percentile before 3 years of age. The equation for the best curve fit is shown. We did not detect a difference between INCL in boys and girls (P = .88). We defined the brain stem as including the cerebral peduncles, midbrain, pons, and medulla. The normal curve reflects brain stem volumes measured on 23 healthy volunteers 1.1–9.6 years of age participating in other studies at our institution; for the healthy volunteers, we did not find a statistical difference between boys and girls (P = .94) (dark line = mean, light lines = ±2 SDs). For comparison, the onset ages of major symptoms (mean and 95% CI) observed in our patients are plotted below the volume curve. A indicates developmental regression; B, cerebral atrophy noted in clinical MR imaging report; C, myoclonic jerks and seizures; D, loss of vision; E, deceleration of head growth; F, isoelectric visual-evoked potentials; and G, isoelectric EEG or electroretinogram.
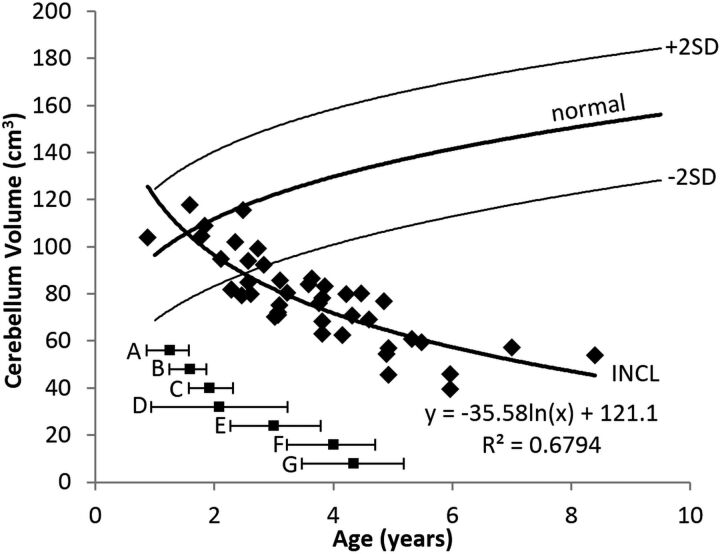
Cerebellum Volume
The evolution of the cerebellum volumes is shown in Fig 4. Our measurements of the youngest patients were in the normal range; therefore, we presume that the evolution before our measurements was normal. The decline in cerebellum volume was initially rapid (the patients' average dropped out of the normal range just after age 2 years) and slowed later. The pattern was best described by a logarithmic equation.
Fig 4.
Cerebellum volume measurements in patients with INCL. Cerebellar volumes were initially near normal but decreased with time and dropped below the 2.5th percentile by about 2.5 years of age. The equation for the best curve fit is shown. We did not detect a difference between INCL in boys and girls (P = .94). We included the cerebellar peduncles in our measurement of cerebellar volume. The normal curve reflects cerebellum volumes measured on 23 healthy volunteers 1.1–9.6 years of age participating in other studies at our institution; for the healthy volunteers, we did not find a statistical difference between boys and girls (P = .91) (dark line = mean, light lines = ±2 SDs). For comparison, the onset ages of major symptoms (mean and 95% CI) observed in our patients are plotted below the volume curve. A indicates developmental regression; B, cerebral atrophy noted in clinical MR imaging report; C, myoclonic jerks and seizures; D, loss of vision; E, deceleration of head growth; F, isoelectric visual-evoked potentials; and G, isoelectric EEG or electroretinogram.
Cerebrum Volume
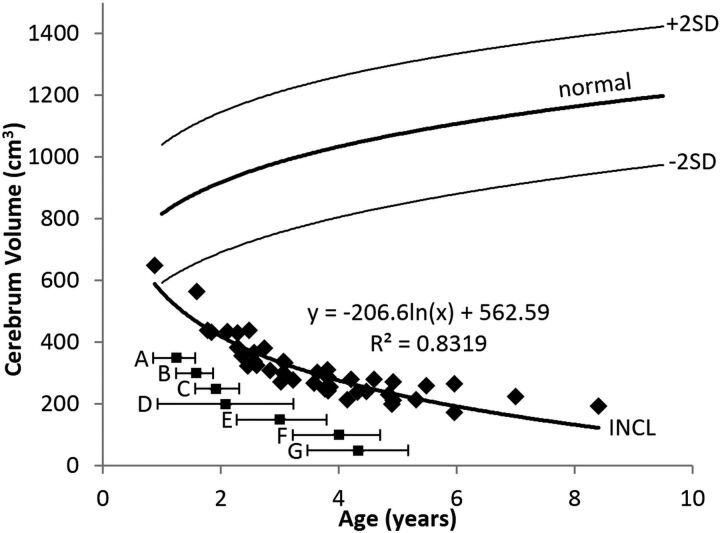
The evolution of the cerebrum volumes is shown in Fig 5. Only the baseline measurement of our youngest patient (at 10 months of age) was above the 2.5th percentile; all other measurements of cerebral volume were far below normal, and extrapolation of the curve to intersect the normal curve suggests that if the cerebral volumes were ever normal in the patients with INCL, it would have been only in the first few months after birth. The initial decline in cerebral volume was rapid, slowing later (possibly becoming asymptotic). The pattern was best described by a logarithmic equation.
Fig 5.
Cerebrum volume measurements in patients with INCL. Even our earliest measurements of cerebral volumes were lower than normal, and volumes decreased dramatically with time. The equation for the best curve fit is shown. We did not detect a difference between INCL in boys and girls (P = .94). We defined the cerebrum as including the deep nuclei but not the cerebral peduncles. The normal curve reflects cerebrum volumes measured on 23 healthy volunteers 1.1–9.6 years of age participating in other studies at our institution; for the healthy volunteers, we did not find a statistical difference between boys and girls (P = .78) (dark line = mean, light lines = ±2 SDs). For comparison, the onset ages of major symptoms (mean and 95% CI) observed in our patients are plotted below the volume curve. A indicates developmental regression; B, cerebral atrophy noted in clinical MR imaging report; C, myoclonic jerks and seizures; D, loss of vision; E, deceleration of head growth; F, isoelectric visual-evoked potentials; and G, isoelectric EEG or electroretinogram.
Total Brain Volume
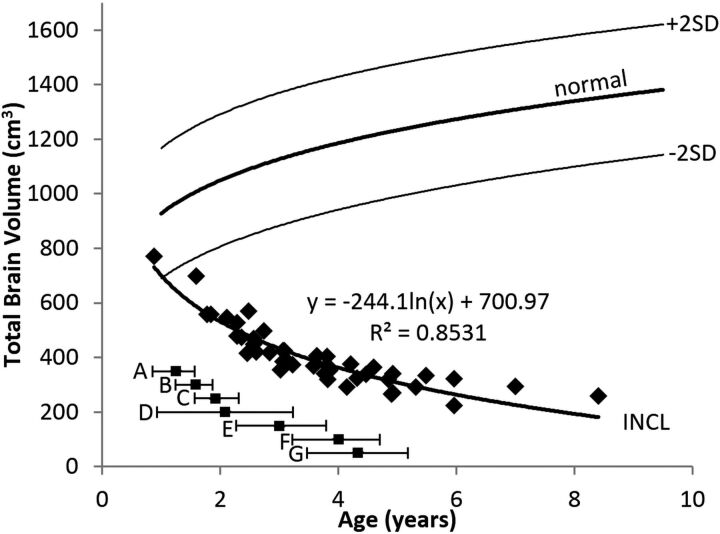
Because the total brain volume is thoroughly dominated by the cerebral volume, the pattern for the total brain volume closely followed that of the cerebral volume, with a rapid initial decline and slower decline later. However, because the decline of the cerebellum started later and did not proceed as rapidly, we did not observe asymptotic behavior in the total brain volume within the timeframe of the study. The pattern was best described by a logarithmic equation. The evolution of the total brain volume is shown in Fig 6.
Fig 6.
Total brain volume measurements in patients with INCL. Total brain volumes (dominated by the cerebral volume) were initially lower than normal and decreased dramatically with time. The equation for the best curve fit is shown. We did not detect a difference between INCL in boys and girls (P = .96). The normal curve reflects total brain volumes measured on 23 healthy volunteers 1.1–9.6 years of age participating in other studies at our institution; for the healthy volunteers, we did not find a statistical difference between boys and girls (P = .80) (dark line = mean, light lines = ±2SD). For comparison, the onset ages of major symptoms (mean and 95% CI) observed in our patients are plotted below the volume curve. A indicates developmental regression; B, cerebral atrophy noted in clinical MR imaging report; C, myoclonic jerks and seizures; D, loss of vision; E, deceleration of head growth; F, isoelectric visual-evoked potentials; and G, isoelectric EEG or electroretinogram.
Ratio of Segmental Volumes to Cerebrum Volume
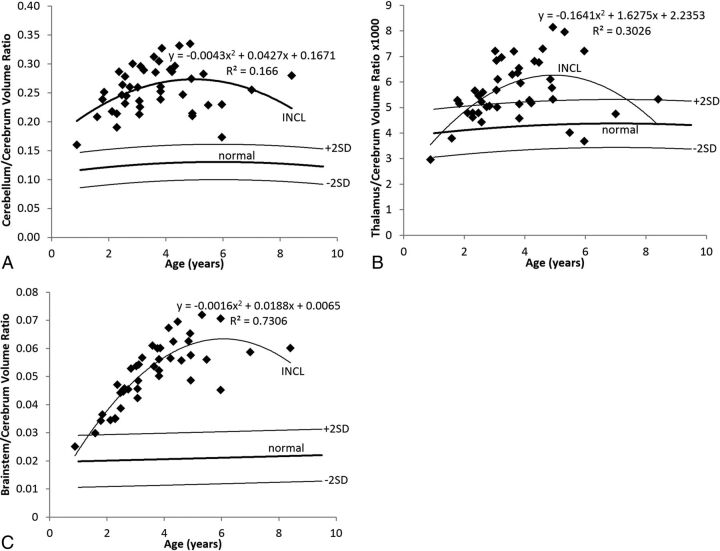
In the healthy children, the cerebellum/cerebrum ratio and thalamus/cerebrum ratio changed very gradually with age, following a pattern best described by a quadratic equation; for the cerebellum, the peak ratio was at 5.8 years of age, and for the thalamus, the peak ratio was at 7.0 years of age. The normal brain stem/cerebrum ratio rose gradually throughout the age range we measured.
In the patients with INCL, the cerebellum/cerebrum ratio was more than twice the normal mean in nearly all of our baseline measurements. The ratio in the patients with INCL rose until about 5 years of age (the maximum of the fitted curve occurred at 4.97 years) and then fell off somewhat. This rising and falling pattern reflects the earlier involvement of the cerebrum relative to the cerebellum. The pattern was best described by a quadratic equation. Extrapolation of the fitted curve to earlier ages does not intersect with the normal curve; this finding suggests that the ratio may never have been normal in these patients. Because the initial measurements of cerebellum volumes were within the normal range, this suggests that the cerebral volume may never be really normal in these patients, not even in neonates or fetuses. The evolution of the ratio of cerebellum volume to cerebral volume is shown in Fig 7A.
Fig 7.
Relative segmental volumes in patients with INCL. A, In INCL, the cerebellum is large relative to the cerebrum, reflecting the observation that volume loss begins earlier and progresses faster in the cerebrum than elsewhere in the brain. The ratio initially rises as cerebral loss outpaces cerebellar loss and decreases later because the cerebrum reaches asymptotic volume earlier than the cerebellum. B, In INCL, the thalamus becomes somewhat large relative to the cerebrum for a while, reflecting the tight linkage between the volumes of these structures with a bit of a delay in involvement of the thalamus relative to the cerebrum. C, In INCL, the brain stem is also large relative to the cerebrum, with a later peak relative to both the thalamus/cerebrum ratio and cerebellum/cerebrum ratio, indicating that the brain stem is involved last among the structures that we measured. In all plots, the equation describes the best curve fit to the INCL results. We did not detect a difference between boys and girls for either patients with INCL or healthy volunteers. The normal curves reflect volume ratios measured on 23 healthy volunteers 1.1–9.6 years of age participating in other studies at our institution (dark line = mean, light lines = ±2 SDs).
The evolution of thalamus/cerebrum and brain stem/cerebrum volume ratios followed a pattern similar to that of the evolution of the cerebellum/cerebrum ratio, all best described by a quadratic equation. The thalamus/cerebrum volume ratio (Fig 7B) peaked at 4.96 years of age, and the brain stem/cerebrum volume ratio (Fig 7C) peaked at 5.89 years of age. The thalamus/cerebrum ratio started in the upper part of the normal range, rose out of the normal range (to about 50% more than the normal mean), and later returned to the upper part of the normal range. The brain stem/cerebrum ratio started at the upper extreme of the normal range and peaked at 3 times the normal mean. The later and higher peak of the brain stem/cerebrum ratio relative to the cerebellum/cerebrum ratio and thalamus/cerebrum ratio suggests later and less severe involvement of the brain stem relative to the cerebrum, thalamus, and cerebellum.
Discussion
In this analysis, we have made detailed, quantitative serial measurements of brain volumes in a group of patients with INCL followed for up to 7 years. We have demonstrated that among the regions that we measured separately, atrophy begins earliest and proceeds fastest in the cerebrum, with the thalamus lagging slightly behind; there is later involvement of the cerebellum and then the brain stem. Although our patients had a variety of different gene mutations, the pattern and rate of atrophy that we observed did not appear to vary by genotype, in agreement with previous reports that these particular gene mutations are clinically indistinguishable.16,19
In the palmitoyl-protein thioesterase (Ppt1−/−) mouse model of INCL, a previous microscopy study demonstrated that neuron loss starts in the sensory relay nuclei of the thalamus, first involving the visual system, then the auditory and somatosensory relay nuclei, and then the inhibitory reticular thalamic nucleus.20 Loss of thalamic relay neurons was followed by loss of other neurons in the interconnected chains, with cortical interneurons preceding cortical granule neurons. Segmental atrophy of the cortex proceeded in the same order as the related thalamic nuclei; and within each segment, the interneuron layer was involved before the granule layer. The much coarser resolution of our MR imaging measurements could not resolve individual thalamic nuclei or reliably measure the thickness of the atrophied cerebral cortex, so we were unable to observe these processes in our patients. In contrast to the results in Ppt1−/− mice,20 we observed that measurable cerebral atrophy preceded measurable thalamus atrophy. An earlier study of the mouse model21 found that fractional volume loss in the thalamus was greater than that in the cerebrum, also opposite to our findings; these discrepancies are consistent with previously reported differences between the mouse model and human disease.21 Our results are in agreement with the mouse model in demonstrating that atrophy of the cerebrum precedes atrophy of the cerebellum.21
Extrapolation of our cerebral volume curve to ages younger than those included in our study suggests that if the cerebral volume was ever normal, it would have been in the normal range for, at most, a few months after birth. Extrapolation of the cerebellum-to-cerebrum volume ratio suggests that the cerebral volume may never have been normal, not even in the fetus. A previous MR spectroscopy study22 found low NAA in the cerebral white matter of a patient at 4 months of age. In the separately reported MR spectroscopy component of the current study,11 we found that extrapolation of cerebral NAA levels beyond the age of our youngest patient does not appear to intersect the normal curve. NAA is produced mainly (or perhaps exclusively) by healthy neurons,23,24 and a decline in the level of NAA indicates loss or injury of neurons. Logically, loss or injury of neurons should precede atrophy; therefore, the timing of our cerebral atrophy observations is consistent with the timing of NAA decline observed in the previous MR spectroscopy reports.
Extrapolation of our thalamus volume curve suggests that the thalamus volume may have been in the normal range before 6 months of age. Extrapolation of our previously published measurements of NAA in the thalamus11 suggests that NAA in the thalamus may be in the normal range for a few months after birth; previous measurements22 on very young children with INCL have demonstrated normal NAA in the thalamus of a 2-month-old child and a slight deficit of NAA in the thalamus of a 4-month-old child. Thus, the relative order of volume loss (cerebrum before thalamus) that we report in this study is concordant with the order of previously reported MR spectroscopy changes in humans.
Both cerebellum and brain stem volumes measured on our youngest patients fell into the normal range, with the curve for the cerebellum volume dropping below the 2.5th percentile at about 2.5 years of age and the curve for the brain stem volume dropping below the 2.5th percentile by about 3 years of age. Extrapolation of the MR spectroscopy results that we previously reported measuring NAA in the cerebellum and brain stem11 suggests that NAA levels are probably normal at these locations for up to a year after birth. As with NAA in the cerebrum, it would be expected that neuron injury or loss would precede the observation of atrophy, so the patterns we observed in the cerebellum and brain stem volume measurements are consistent with the pattern observed in our MR spectroscopy measurements.
We would have liked to have compared our quantitative atrophy measurements with previous reports on the natural history of volume loss in INCL,16,25 to evaluate the treatment benefits of cysteamine bitartrate and N-acetyl cysteine; in particular, we would have liked to determine whether the treatment resulted in any delay in atrophy onset or any slowing of the rate of atrophy. However, because all previous studies evaluating atrophy in INCL used qualitative scoring without correspondence to any particular absolute or fractional volume loss, we could not determine the effect of the treatment on brain atrophy. The sequence of brain involvement we observed agreed with that in the previous qualitative reports.
The measurements we present here are quantitative and should be reproducible. Although we were not able to compare our results directly with the previous qualitative studies of brain atrophy in INCL, the detailed quantitative measurements we have made of the temporal progression of atrophy in INCL in the patients under treatment with cysteamine bitartrate and N-acetyl cysteine will be useful as a reference for comparative evaluation of future treatment trials.
Conclusions
We made quantitative measurements of brain volumes in treated patients with INCL. The pattern of volume loss suggests that the order of involvement was cerebrum, thalamus, cerebellum, and brain stem, in agreement with other previously published studies of this disease in humans. In contrast to other previously published reports, we have made quantitative measurements of the volume of the brain (and several major divisions). As a reproducible quantitative measure, these volumes can be used as a surrogate outcome measure in future treatment trials to compare proposed treatments with one another and potentially detect small differences that may not be apparent if coarser outcome measures (such as qualitative evaluation of symptoms) are used.
Supplementary Material
Acknowledgments
We thank the patients (and their families) who participated in this study, and the MR imaging technologists (Bonita Damaska, Mastaneh Owhadi, and Betty Wise) who scanned them. We also thank Armin Raznahan and Audrey Thurm for the use of their images of healthy volunteers.
ABBREVIATIONS:
- CLN
ceroid-lipofuscinosis, neuronal
- EEG
electroencephalogram
- ERG
electroretinogram
- INCL
infantile neuronal ceroid lipofuscinosis
Footnotes
This research was supported in full by the intramural research program of the Eunice Kennedy Shriver National Institute of Child Health and Human Development, National Institutes of Health (protocol 01-CH-0086). Healthy volunteers were studied under protocols 89-M-0006 and 11-M-0144.
The authors report no conflicts of interest.
The views herein are those of the authors and are not necessarily those of the National Institutes of Health.
References
- 1. Anderson GW, Goebel HH, Simonati A. Human pathology in NCL. Biochim Biophys Acta 2 2013;1832:1807–26 10.1016/j.bbadis.2012.11.014 [DOI] [PubMed] [Google Scholar]
- 2. Mole SE, Williams RE, Goebel HH. The Neuronal Ceroid Lipofuscinoses (Batten Disease). Oxford: Oxford University Press; 2011 [Google Scholar]
- 3. Haltia M. The neuronal ceroid-lipofuscinoses: from past to present. Biochim Biophys Acta 2006;1762:850–56 10.1016/j.bbadis.2006.06.010 [DOI] [PubMed] [Google Scholar]
- 4. Platt FM, Boland B, van der Spoel AC. The cell biology of disease: lysosomal storage disorders: the cellular impact of lysosomal dysfunction. J Cell Boil 2012;199:723–34 10.1083/jcb.201208152 [DOI] [PMC free article] [PubMed] [Google Scholar]
- 5. Rider JA, Rider DL. Batten disease: past, present, and future. Am J Med Genet Suppl 1988;5:21–26 [DOI] [PubMed] [Google Scholar]
- 6. Warrier V, Vieira M, Mole SE. Genetic basis and phenotypic correlations of the neuronal ceroid lipofusinoses. Biochi Biochim Biophys Acta 2013;1832:1827–30 10.1016/j.bbadis.2013.03.017 [DOI] [PubMed] [Google Scholar]
- 7. Mole SE, Cotman SL. Genetics of the neuronal ceroid lipofuscinoses (Batten disease). Biochim Biophys Acta 2015;1852:2237–41 10.1016/j.bbadis.2015.05.011 [DOI] [PMC free article] [PubMed] [Google Scholar]
- 8. Haltia M, Rapola J, Santavuori P. Infantile type of so-called neuronal ceroid-lipofuscinosis: histological and electron microscopic studies. Acta Neuropathol 1973;26:157–70 10.1007/BF00697751 [DOI] [PubMed] [Google Scholar]
- 9. Vesa J, Hellsten E, Verkruyse LA, et al. Mutations in the palmitoyl protein thioesterase gene causing infantile neuronal ceroid lipofuscinosis. Nature 1995;376:584–87 10.1038/376584a0 [DOI] [PubMed] [Google Scholar]
- 10. Vanhanen SL, Sainio K, Lappi M, et al. EEG and evoked potentials in infantile neuronal ceroid-lipofuscinosis. Dev Med Child Neurol 1997;39:456–63 [DOI] [PubMed] [Google Scholar]
- 11. Baker EH, Levin SW, Zhang Z, et al. Evaluation of disease progression in INCL by MR spectroscopy. Ann Clin Transl Neurol 2015;2:797–809 10.1002/acn3.222 [DOI] [PMC free article] [PubMed] [Google Scholar]
- 12. Goebel HH, Wisniewski KE. Current state of clinical and morphological features in human NCL. Brain Pathol 2004;14:61–69 10.1111/j.1750-3639.2004.tb00499.x [DOI] [PMC free article] [PubMed] [Google Scholar]
- 13. Santavuori P, Vanhanen SL, Sainio K, et al. Infantile neuronal ceroid-lipofuscinosis (INCL): diagnostic criteria. J Inherit Metab Dis 1993;16:227–29 10.1007/BF00710250 [DOI] [PubMed] [Google Scholar]
- 14. Zhang Z, Butler JD, Levin SW, et al. Lysosomal ceroid depletion by drugs: therapeutic implications for a hereditary neurodegenerative disease of childhood. Nat Med 2001;7:478–84 10.1038/86554 [DOI] [PubMed] [Google Scholar]
- 15. Bavarsad Shahripour R, Harrigan MR, Alexandrov AV. N-acetylcysteine (NAC) in neurological disorders: mechanisms of action and therapeutic opportunities. Brain Behav 2014;4:108–22 10.1002/brb3.208 [DOI] [PMC free article] [PubMed] [Google Scholar]
- 16. Levin SW, Baker EH, Zein WM, et al. Oral cysteamine bitartrate and N-acetylcysteine for patients with infantile neuronal ceroid lipofuscinosis: a pilot study. Lancet Neurol 2014;13:777–87 10.1016/S1474-4422(14)70142-5 [DOI] [PMC free article] [PubMed] [Google Scholar]
- 17. Miao N, Levin SW, Baker EH, et al. Children with infantile neuronal ceroid lipofuscinosis have an increased risk of hypothermia and bradycardia during anesthesia. Anesth Analg 2009;109:372–78 10.1213/ane.0b013e3181aa6e95 [DOI] [PMC free article] [PubMed] [Google Scholar]
- 18. McAuliffe MJ, Lalonde FM, McGarry D, et al. Medical image processing, analysis and visualization in clinical research. In: Proceedings of the 14th IEEE Symposium on Computer-Based Medical Systems, Washington, DC. July 26–27, 2001:381–86 10.1109/CBMS.2001.941749 [DOI] [Google Scholar]
- 19. Das AK, Becerra CH, Yi W, et al. Molecular genetics of palmitoyl-protein thioesterase deficiency in the U.S. J Clin Invest 1998;102:361–70 10.1172/JCI3112 [DOI] [PMC free article] [PubMed] [Google Scholar]
- 20. Kielar C, Maddox L, Bible E, et al. Successive neuron loss in the thalamus and cortex in a mouse model of infantile neuronal ceroid lipofuscinosis. Neurobiol Dis 2007;25:150–62 10.1016/j.nbd.2006.09.001 [DOI] [PMC free article] [PubMed] [Google Scholar]
- 21. Bible E, Gupta P, Hofmann SL, et al. Regional and cellular neuropathology in the palmitoyl protein thioesterase-1 null mutant mouse model of infantile neuronal ceroid lipofuscinosis. Neurobiol Dis 2004;16:346–59 10.1016/j.nbd.2004.02.010 [DOI] [PubMed] [Google Scholar]
- 22. Vanhanen SL, Puranen J, Autti T, et al. Neuroradiological findings (MRS, MRI, SPECT) in infantile neuronal ceroid-lipofuscinosis (infantile CLN1) at different stages of the disease. Neuropediatrics 2004;35:27–35 10.1055/s-2004-815788 [DOI] [PubMed] [Google Scholar]
- 23. Miller BL. A review of chemical issues in 1H NMR spectroscopy: N-acetyl-L-aspartate, creatine and choline. NMR Biomed 1991;4:47–52 10.1002/nbm.1940040203 [DOI] [PubMed] [Google Scholar]
- 24. Simmons ML, Frondoza CG, Coyle JT. Immunocytochemical localization of N-acetyl-aspartate with monoclonal antibodies. Neuroscience 1991;45:37–45 10.1016/0306-4522(91)90101-S [DOI] [PubMed] [Google Scholar]
- 25. Vanhanen SL, Raininko R, Autti T, et al. MRI evaluation of the brain in infantile neuronal ceroid-lipofuscinosis, part 2: MRI findings in 21 patients. J Child Neurol 1995;10:444–50 10.1177/088307389501000604 [DOI] [PubMed] [Google Scholar]
Associated Data
This section collects any data citations, data availability statements, or supplementary materials included in this article.


