

Abstract
Background
Twenty-five million people in the U.S. have limited English proficiency (LEP); this growing and aging population experiences worse outcomes when hospitalized. Federal requirements that hospitals provide language access services are very challenging to implement in the fast-paced, 24-hour hospital environment.
Objective
Determine if increasing access to professional interpreters improves hospital outcomes for older patients with LEP
Design
Natural experiment on a medicine floor of an academic hospital
Participants
Patients age ≥50 discharged between Jan 15, 2007–Jan 15, 2010.
Exposure
Dual-handset interpreter telephone at every bedside July 15, 2008–Mar 14, 2009
Outcome Measures
30-day readmission, length of stay (LOS), estimated hospital expenditures
Results
Of 8,077 discharges, 1,963 were for LEP, and 6,114 for English-proficient (EP) patients. There was a significant decrease in observed 30-day readmission rates for the LEP group during the 8-month intervention period compared to 18 months pre-intervention (17.8% vs. 13.4%); at the same time EP readmission rates increased (16.7% vs. 19.7%); results remained significant in adjusted analyses. This improved readmission outcome for the LEP group was not maintained during the subsequent post-intervention period when the telephones became less accessible. There was no significant intervention impact on LOS in either unadjusted or adjusted analyses. After accounting for interpreter services costs, the estimated 119 readmissions averted during the intervention period were associated with estimated monthly hospital expenditure savings of $161,404.
Conclusions
Comprehensive language access represents an important, high value service that all medical centers should provide in order to achieve equitable, quality healthcare for vulnerable LEP populations.
Keywords: language access, quality of care, aging, disparities, health care costs, health care delivery, interventions, quasi-experimental design, readmissions, underserved populations
Background
Sixty-million Americans speak a language other than English and more than 42% of them speak English less than very well – or have limited English proficiency (LEP).1 The increase in individuals with LEP in the U.S. and their diffusion to geographic areas where few have traditionally resided presents a challenge for healthcare systems to overcome communication barriers due to language in order to provide high-quality, patient-centered care.2 In addition, as the U.S. population ages, the elderly are becoming increasingly diverse, heightening the need for attention to language and cultural barriers to ensure quality health care delivery.3
In an outpatient setting, patients with LEP experience less access than English-speakers to a usual source of care as well as lower rates of physician visits and preventive services.4–7 Even when patients with language barriers do have access to care, they have poorer adherence to treatments, decreased comprehension of their diagnoses, lower satisfaction with care, increased medication complications, and more obstetric trauma compared to English-speakers.8–12
In a 2006 national survey, 63% of hospitals reported encountering patients with LEP either daily or weekly.13 In the hospital, individuals with LEP experience more adverse events,14 and possibly longer hospitalizations as well as higher 30-day readmission rates compared to English speakers in settings of limited access to professional interpreters.15,16 Access to professional interpreters is critical to effective communication and the delivery of high quality care17–19 by improved communication, appropriate use of resources and better patient and clinician satisfaction.20 Access to professional interpreters at admission and discharge has been shown to decrease length of stay and readmission rates in one study;21 however any use of professional interpretation during hospitalization was associated with increased length of stay in another study.22
Unfortunately, access to adequate language services has been stymied by the widespread lack of reimbursement for interpreter services.13,23–25 While we know that the costs of professional interpreter services can be high, the cost is small relative to the total cost of hospitalization where the setting lends itself to bundled payments.26 Others have outlined the theoretical savings for health systems related to avoidance of errors and liability risk;27,28 however, there are no published data about the degree to which interpreter costs may be offset by improved communication leading to better patient outcomes.
The challenge of providing professional interpreter services is compounded for hospitalized patients because of the frequent and brief nature of many interactions, time pressures, the need for advance scheduling for in-person interpreters, and the 24-hour nature of hospital care.29 National studies have found a discrepancy between hospital policy requiring use of professional interpreters and actual practice in which professional interpreter utilization is not very robust,23,25,30 illustrating the widespread need for a system that will encourage time-pressured hospital staff to use professional interpreters instead of using no interpretation or untrained interpreters.
In this study we set out to evaluate the impact of increased access to professional interpreters by providing a dual-handset telephone with a direct connection to interpreter services at each hospital bedside that would facilitate use by all clinical providers. We evaluated the effect of the intervention on 30-day readmission rates, length of stay, and estimated hospital expenditures using a quasi-experimental design in a real world setting.
Methods
Setting and Participants
We included discharges from the Medicine floor of an academic medical center consisting of two separate nursing units; one a step-down unit for higher acuity patients and the other for patients with less intensive nursing needs. Discharges occurred between January 15, 2007 and January 15, 2010. This time-frame begins 18-months prior to the intervention, includes the 8-month intervention period, and continues for 10-months after the intervention.
Because in this hospital the younger adult population is predominantly English speaking we limited discharges to those for patients ≥50 years old. We excluded discharges with the top 1% length of stay in our dataset (those 40-days or longer) as these represented hospital stays that likely differed substantially from the majority in illness acuity and disease course. We further excluded planned admissions for chemotherapy or radiation as these often follow a set time-course in the hospital and result in planned and expected readmissions.31 Lastly we excluded discharges for patients with missing primary language or with primary language documented as ‘unknown’.
Data Sources
We collected interpreter utilization from two interpreter databases: 1) a database kept by Interpreter Services to record in-person staff interpreter encounters that recorded the date, language, hospital floor and time of the interpretation; 2) a billing database for telephonic interpreter encounters from the vendor providing these services that recorded the date, language, vendor phone identification number and length of the call. Neither database matched an interpreted encounter to a specific patient, thus we standardized interpreter utilization (number of interpreted encounters in the database in a given month) to the number of Patients with LEP discharged from the floor.
We collected administrative data from Transition Systems Inc (TSI, Boston, MA) billing databases that included patient demographics, insurance, costs, ICD-9CM diagnostic codes, admission and discharge dates. We collected language data from a registration database. Information on a patient’s primary language was entered at the time each patient first registered at the medical center, whether for the index hospitalization or for prior clinic visits and is based on patient self-report. We have previously validated registration language against patient self-report of primary language and ability to speak English in telephone interviews and found high agreement with the majority of the errors classifying non-English speakers as English-speakers.16
Intervention
The intervention consisted of a dual-handset interpreter telephone at the bedside of every patient with LEP (Bedside Interpreter Intervention). These 66 telephones had a programmed button that allowed 24-hour access to a professional (trained and tested) medical interpreter for more than 100 languages. Immediate availability, bedside location and rapid access allowed for dual-handset interpreter phone use by any healthcare team member entering the room of any Patient with LEP, no matter how brief the interaction. This intervention began as a quality improvement effort on the Medicine floor starting July 15, 2008 and continued for 8-months. At the start of the intervention, information about the phones along with a demonstration was shared at nursing staff meetings on the floor, and morning report for Medicine resident physicians; additionally a pocket card explaining how to use the phones was mailed to Medicine attending physicians, and made available to residents when they rotated onto the inpatient service by the Medicine Chief Residents.
The intervention ended mid-March, 2009 when a floor remodel led to the removal of phones from individual bedsides. While many phones remained on the floor (ranging from 32–44 during the post-intervention period), they were no longer as easily accessible.
Prior to the intervention, usual-care communication included in-person staff interpreters who could be scheduled during usual business hours, and a slowly increasing number of dual-handset interpreter telephones (ranging from 0–5 during the pre-intervention period). The dual-handset telephones were placed on mobile carts and kept at the nursing station or in locked cabinets. Once these mobile phones were brought to a patient’s room and connected, they were as easy to use as the intervention phones; however, it took additional time to locate and bring them to the patient’s room, and often they were in use elsewhere. Placement of a dual-handset interpreter telephone at the bedside of each Patient with LEP was intended to eliminate these barriers for time-pressured clinicians.
Outcomes
We defined readmission as any inpatient admission to any service occurring ≤30-days from the time of the index discharge from the Medicine floor. All discharges from the Medicine floor during the study period were eligible to be included as index discharges which could result in a readmission; in other words, if a patient were discharged from the Medicine floor, readmitted within 30-days, and then discharged again from the Medicine floor, the second discharge was considered as an additional index discharge. However, if the patient’s readmission resulted in a discharge from a different floor in the hospital, it would not be considered an index discharge. Thus an individual patient could have multiple index discharges included in the analysis. For this outcome, in keeping with standard methods, we excluded discharges with a discharge disposition of ‘transfer to acute facility’, ‘died’, or ‘left against medical advice’.31
We defined length of stay (LOS) using the admission and discharge date and time from the administrative billing database. After log-transformation, the LOS outcome was approximately normally distributed (skewness and kurtosis statistics equaled −0.003 and +0.086, respectively), and was modeled via linear regression.
We estimated hospital expenditure savings in the following manner. First, we calculated the average cost of an admission for a patient with LEP during the intervention period from the administrative billing data. Next, we estimated the number of expected readmissions in the LEP group if the pre-intervention readmission rate were held constant during the intervention period. Taking the difference between the observed and expected readmission rates, we found the number of possible averted readmissions. We then multiplied the number of possible adverted readmissions by the average cost of an admission in the LEP group during the intervention period, subtracted the cost of the intervention telephone interpretations and divided by the number of intervention months to obtain an estimate of monthly hospital expenditures savings. Similar methods were used for LOS.
Predictor and Covariates
Our primary effect of interest was the interaction between patient language (primary non-English language–LEP/English–EP) and study time-period (pre-, intervention, post-). Because there was no expectation that the bedside interpreter intervention would have an effect on the hospital outcomes of the EP group, this group was included as a non-equivalent control group. Examining the interaction between language group and study time-period allowed for evaluation of the impact of the intervention on the LEP group while accounting for potential secular trends in the outcomes. Additionally, we included the following patient-level characteristics as covariates: age (≥50 years continuous), sex (M/F), and insurance (Medicare/Medicaid/county/private/none); and the following discharge-level characteristics as covariates: severity of illness index (SOI) using the All Patient Refined DRG Classification System (minor/moderate/major/extreme),32 intensive care unit (ICU) stay (yes/no), principal diagnosis (categories according to Healthcare Cost and Utilization Project),33 and calendar month.
Statistical Analysis
Descriptive statistics of the discharges compared LEP and EP groups using chi-square for categorical and t-tests for continuous variables. Linear (for logged LOS) and logistic (for 30-day readmission) models regressed the outcome onto a categorical indicator of the study periods, patient language group, and the period-by-language interaction, as well as covariates describing patient age, sex, insurance, discharge calendar month, principal diagnosis category, SOI index, and ICU stay. The 30-day readmission outcome model also adjusted for LOS. Subsequently, custom contrasts compared outcome response across the three study periods and whether any effects were modified by language group (LEP vs. EP; the ‘period-by-language’ interaction). All models were fit via generalized estimating equations with exchangeable correlation structure to accommodate repeated hospital stays for individual patients.
Results
Descriptive statistics
During the study period there were 8,386 discharges from the Medicine floor; after exclusion for top 1% LOS (n=81), chemotherapy or radiation (n=186), and missing or ‘unknown’ primary language (n=42), there were 8,077 discharges included for patients age ≥50 (range 50–108), 1,963 (24.3%) for LEP and 6,114 for EP patients. For the readmission outcome, an additional 688 (8.5% in both LEP and EP groups) discharges with disposition of ‘transfer to acute facility’ (n=135), ‘died’ (n=484) or ‘left against medical advice’ (n=69) were excluded, resulting in 7,389 discharges eligible for readmission analysis.
Patients in the LEP group on average, were older than those in the EP group, had higher rates of Medicare insurance, were more often admitted for a respiratory illness, and more often discharged to a skilled nursing facility. There were no significant differences between groups in the distribution of SOI index, or in the proportion with an ICU stay. (Table 1) For the entire sample over the full 36 months of the study, overall 30-day readmission rate was 17.6%, and mean LOS was 5.53 days and median LOS was 3.70 days (IQR 2.01–6.64), with no significant overall differences between the LEP and EP groups for either outcome.
Table 1.
Characteristics of 8077 discharges for patients ≥50 years old discharged from the Medicine floor of an academic medical center from January 15 2007 to January 15 2010*
| English proficient patients | Limited English proficient patients | Total | P-value | ||||
|---|---|---|---|---|---|---|---|
| N=6114 | N=1963 | N=8077 | |||||
| N | (%) | N | (%) | N | (%) | ||
| Primary language | |||||||
| English | 6114 | (100.0) | - | - | 6114 | (75.7) | |
| Chinese | - | - | 987 | (50.3) | 987 | (12.2) | |
| Russian | - | - | 318 | (16.2) | 318 | (3.9) | |
| Spanish | - | - | 266 | (13.6) | 266 | (3.3) | |
| Other Asian language | - | - | 262 | (13.4) | 262 | (3.2) | |
| Other | - | - | 130 | (6.6) | 130 | (1.6) | |
| Gender | |||||||
| Women | 3030 | (49.6) | 1099 | (56.0) | 4129 | (51.1) | <.0001 |
| Men | 3084 | (50.4) | 864 | (44.0) | 3948 | (48.9) | |
| Race/ethnicity | |||||||
| White | 3666 | (60.3) | 357 | (18.3) | 4023 | (50.1) | <.0001 |
| African American | 1055 | (17.4) | 6 | (0.3) | 1061 | (13.2) | |
| Asian | 700 | (11.5) | 1231 | (63.0) | 1931 | (24.0) | |
| Latino | 334 | (5.5) | 243 | (12.4) | 577 | (7.2) | |
| Other | 322 | (5.3) | 117 | (6.0) | 439 | (5.5) | |
| Age (mean, std dev) | 68.49 | (12.6) | 76.32 | (11.3) | 70.39 | (12.7) | <.0001 |
| Insurance type | |||||||
| Medicare | 3257 | (53.3) | 1359 | (69.2) | 4616 | (57.1) | <.0001 |
| Private insurance | 1971 | (32.2) | 354 | (18.0) | 2325 | (28.8) | |
| Medicaid/county public insurance | 791 | (12.9) | 232 | (11.8) | 1023 | (12.7) | |
| No insurance | 95 | (1.6) | 18 | (0.9) | 113 | (1.4) | |
| Discharge disposition | |||||||
| Home | 3673 | (60.1) | 1032 | (52.6) | 4705 | (58.3) | <.0001 |
| Rehab/SNF | 911 | (14.9) | 401 | (20.4) | 1312 | (16.2) | |
| Home with home health | 760 | (12.4) | 292 | (14.9) | 1052 | (13.0) | |
| Died | 355 | (5.8) | 129 | (6.6) | 484 | (6.0) | |
| Other facility | 108 | (1.8) | 27 | (1.4) | 135 | (1.7) | |
| Hospice | 130 | (2.1) | 58 | (3.0) | 188 | (2.3) | |
| Other | 119 | (2.0) | 13 | (0.7) | 132 | (1.6) | |
| Against Medical Advice | 58 | (1.0) | 11 | (0.6) | 69 | (0.9) | |
| ICU stay during hospitalization | 999 | (16.3) | 296 | (15.1) | 1295 | (16.0) | 0.19 |
| Severity of illness index** | |||||||
| Minor | 556 | (9.1) | 150 | (7.6) | 706 | (8.7) | 0.07 |
| Moderate | 1776 | (29.1) | 543 | (27.7) | 2319 | (28.7) | |
| Major | 2620 | (42.9) | 864 | (44.0) | 3484 | (43.1) | |
| Extreme | 1162 | (19.0) | 406 | (20.7) | 1568 | (19.4) | |
| Principal diagnosis*** | |||||||
| Diseases of the circulatory system | 921 | (15.1) | 279 | (14.2) | 1200 | (14.9) | <.0001 |
| Diseases of the respiratory system | 972 | (15.9) | 378 | (19.3) | 1350 | (16.7) | |
| Diseases of the digestive system | 876 | (14.3) | 249 | (12.7) | 1125 | (13.9) | |
| Neoplasms | 752 | (12.3) | 263 | (13.4) | 1015 | (12.6) | |
| Injury and poisoning | 546 | (8.9) | 135 | (6.9) | 681 | (8.4) | |
| Diseases of the genitourinary system | 478 | (7.8) | 164 | (8.4) | 642 | (7.9) | |
| Infectious and parasitic diseases | 380 | (6.2) | 151 | (7.7) | 531 | (6.6) | |
| Endocrine; nutritional; and metabolic diseases and immunity | 295 | (4.8) | 130 | (6.6) | 425 | (5.3) | |
| Other** | 894 | (14.6) | 214 | (10.9) | 1108 | (13.7) | |
Percentages may not add up to 100% due to rounding error
Based on the APR DRG index which calculates severity of illness categorizing each patient into one of four categories: minor/moderate/major/extreme
Principal diagnosis ‘other’ includes less than 5% in each of the following categories: diseases of musculoskeletal system and connective tissue; diseases of blood and blood-forming organs; mental illness; diseases of the nervous system and sense organs; symptoms, signs and ill-defined conditions; diseases of the skin and subcutaneous tissue; congenital anomalies; residual and unclassified codes. There were no diagnoses in the following categories: complications of pregnancy, childbirth and the puerperium; certain conditions originating in the perinatal period.
Intervention Fidelity: Interpreter Utilization
Pre-intervention there were low, but slowly increasing, rates of professional interpreter use over the telephone. Immediately following intervention implementation, telephonic professional interpreter use increased considerably. In the post-intervention period, some increased utilization was sustained despite decreased telephone accessibility. (Figure 1) These differences varied by patient language, with the largest rise and fall of telephone interpreter utilization for Spanish speaking patients. (Table 2) In-person professional utilization was low (<0.5 in-person interpreted encounters/LEP discharge) throughout the 36 months of the study.
Figure 1.
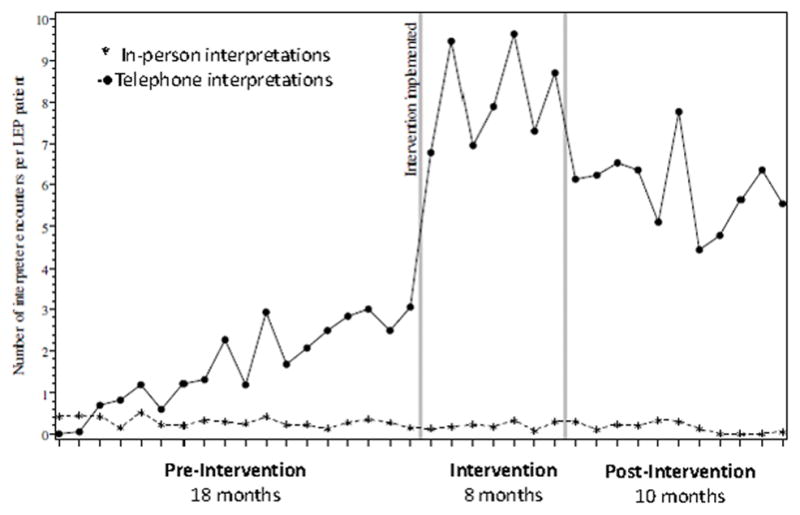
Average monthly number of interpreted encounters standardized to number of monthly discharges for limited English proficient (LEP) patients during the pre-intervention, intervention, and post-intervention Bedside Interpreter study periods.
Table 2.
Utilization of Professional Telephone Interpreters by Language: Mean number of calls per LEP patient discharged during three time periods
| Language | Pre-intervention Total minutes of calls: 15,701 (mean 4.1 min/day/LEP discharge) 18-month mean; n=4231 |
Intervention Total minutes of calls: 28,284 (mean 18.7 min/day/LEP discharge) 8-month mean; n=1714 |
Post-intervention Total minutes of calls: 31,039 (mean 15.3 min/day/LEP discharge) 10-month mean; n=2132 |
|---|---|---|---|
| All languages | 1.7 | 7.9 | 5.9 |
| Chinese* | 2.1 | 8.7 | 7.4 |
| Russian | 2.5 | 8.1 | 7.0 |
| Spanish | 1.3 | 8.5 | 4.3 |
| Other** | 1.3 | 5.8 | 3.3 |
Chinese included Cantonese and Mandarin speakers
Other languages included: Amharic, Arabic, Armenian, Cambodian, Farsi, French German, Greek, Hebrew, Hindi, Italian, Japanese, Laotian, Polish, Portuguese, Punjabi, Serbian, Tagalog, Thai, Tigrinya, Urdu, Vietnamese
Outcomes
30-Day Readmission
Observed 30-day readmission decreased during the intervention period and increased again post-intervention. (Table 3) In adjusted analyses, the effect of the intervention on readmission rates was significantly modified by patient language group; that is, the effect of the study periods on readmission rates significantly differed across the two language groups (p = .040 for test of interaction). The odds of readmission for the LEP compared with EP group was lower during the intervention period; while it was roughly equivalent during both the pre- and post- intervention periods. (Table 4)
Table 3.
Observed hospital outcomes for Length of Stay and Readmission during the three study periods by language proficiency in 7,389 hospitalizations, 2007–2010
| Pre-Intervention N=4231 LOS N=3869 Readmission |
Intervention N=1714 LOS N=1574 Readmission |
Post-intervention N=2132 LOS N=1946 Readmission |
|
|---|---|---|---|
|
| |||
| Observed LOS | |||
| Median days (IQR)* | |||
| LEP | 3.69 (2.03–6.60) n=1035 |
3.86 (2.05–6.84) n=391 |
3.79 (2.09–6.32) n=537 |
| EP | 3.65 (1.95–6.44) n=3196 |
3.81 (2.19–6.98) n=1323 |
3.65 (1.96–6.66) n=1595 |
|
| |||
| Observed 30-Day | |||
| Readmission Rate (%)† | |||
| LEP | 17.8% n=938 |
13.4% n=365 |
20.3% n=493 |
| EP | 16.7% n=2931 |
19.7% n=1209 |
17.6% n=1453 |
IQR: Interquartile range
Table 4.
Adjusted results for readmission and Length of Stay for Limited English Proficiency group compared to English-Proficient group during three time periods, 2007–2010*
| Readmission Odds Ratio |
Length of Stay Factor Change** |
|
|---|---|---|
| Pre-intervention | 1.07; 95% CI 0.85–1.35 | 1.02; 95% CI 0.96–1.07 |
| Intervention | 0.64; 95% CI 0.43–0.95 | 1.01; 95% CI 0.92–1.10 |
| Post-intervention | 1.09; 95% CI 0.80–1.48 | 0.99; 95% CI 0.92–1.06 |
Both models adjusted for patient age, sex, insurance, discharge calendar month, principal diagnosis category, SOI index, and ICU stay; the readmission model additionally adjusted for LOS.
Language group effect estimates are represented by ‘factor change’ coefficients, which reflect the multiplicative difference in the expected length of stay within the LEP group versus the EP group.
Length of Stay
There was no significant impact of the bedside intervention on LOS. The unadjusted median LOS did not differ between LEP and EP groups over the three study time periods. (Table 3) In adjusted analyses, the effect of intervention intensity on LOS was not significantly modified by patient language (p = .818 for test of interaction). (Table 4)
Estimated hospital expenditures
The dual-handset telephones used in the intervention were provided free of cost by the vendor telephonic interpreting company. During the 8-month intervention, there were 28,284 minutes of interpreted calls billed at a cost of $0.99/minute for an intervention cost of $28,001. During the course of the study, the median cost of a hospital stay in the LEP group was $11,086. If the rate of readmissions for the LEP group had stayed steady at the pre-intervention rate (17.8%) rather than falling (to 13.4%) during the high intensity intervention period, we estimate there would have been an additional 119 readmissions during the high intervention period. The projected cost of these additional readmissions would have equaled $1,319,234. Subtracting out the cost of the interpreted calls, the estimated net savings related to the Bedside Interpreter Intervention over this 8-month time period equaled $1,291,233, for an estimated monthly healthcare expenditure savings of $161,404. Because there was no impact of the intervention on LOS, we did not estimate any change in hospital expenditures related to LOS.
Discussion
Providing easy access to professional interpreters via dual-handset telephones at the bedside in the acute-care hospital was associated with decreased 30-day readmission rates for patients with a language barrier. This improvement was lost once the telephones became less accessible. Having a telephone in every patient room, immediately available to clinicians at any time, was a key component to the success of the intervention. We consider this to be an effective implementation of access to professional interpretation in the hospital for a modest cost that improves the quality of care for patients with LEP.
Our results are consistent with one other study that demonstrated that professional interpreter utilization at admission and/or discharge was associated with decreased readmission rates.21 However, our study is the first to demonstrate that a systems intervention to increase access to those interpreters throughout the hospital stay both decreased readmission rates and estimated hospital expenditures.
The intervention had no impact on hospital LOS even after adjustment for severity of illness, ICU stay and principal diagnosis. Other studies have found mixed effects of a language barrier on length of stay.15,16,21,22 These conflicting findings may be because in some cases better communication may lead to shorter LOS due to a diagnosis being made sooner, for example, but in other cases it may lead to longer LOS due to proper history taking, symptom awareness, information about needs at home on discharge, etc. In one study, the authors hypothesized that clinicians were reserving interpreter use for the sickest patients, thus interpreter utilization was associated with a longer LOS.22 It is not surprising that results for LOS differ from those for readmission because the impact on readmission likely results from avoiding clinical and communication errors and enhancing discharge preparedness; whereas, the impact of easy access to professional interpreters throughout the hospitalization likely has the effect of sometimes increasing and sometimes decreasing LOS depending on the clinical situation.
In this natural experiment the intervention ended when a remodel disrupted immediate bedside access to the telephones. We observed a concomitant drop-off in utilization of professional interpretation as access and the number of telephones decreased. However, this decrease in accessibility did not eliminate interpreter phone utilization, which still remained considerably higher than in the pre-intervention period. Interestingly, the utilization data show differential use of the dual-handset interpreter phones by language. While Spanish-speaking patients had equal utilization when the phones were most easily accessible during the high intensity intervention period, their utilization dropped off the most when the phones were less accessible. Prior studies have shown that physicians often attempt to ‘get by’ when they have even partial non-English language skills.29 Our own previous survey of nurses and physicians working on the same Medicine floor demonstrated that many reported ‘getting by’ with Spanish language skills in particular.34 It is likely that when the phones were easily available in every room, clinicians opted to use professional interpreters with Spanish-speaking patients, but when the phones became less available, those with partial-language skills in Spanish reverted to the ‘getting by’ behavior.
Limitations
The interpreter phone billing dataset did not record types of clinical interactions, and so we were not able to evaluate whether specific types of interpreted interactions were more important than others for preventing readmission, or whether the phones were used throughout the hospitalization course. However, our previous work surveying nurses and physicians shortly before and after implementation of the Bedside Interpreter Intervention did demonstrate that use of professional interpreters increased for all types of clinical interactions throughout the hospital course.35 Furthermore, a prior study that surveyed patients with LEP on interpreter use during their hospitalization, showed very low use during hospital stay by both nurses and physicians other than at admission and discharge.29
Similarly, we did not have interpreter data for individual patients, so it is possible that some patients had many interpreted encounters and others none. Without these data, we were unable to investigate whether those without interpreted encounters were readmitted more often. Thus, our findings of a positive overall impact of a systems intervention are consistent with an ‘intention to treat’ type of analysis, and a ‘per protocol’ type of analysis was not possible.
We do not know why readmission rates increased for English-speakers at the same time that LEP rates decreased. While it is possible that this was a negative unintended consequence of an intervention focused only on the LEP population, this explanation does not have much face validity as the telephones were rolled-out over a brief period, and then were simply maintained in each room and only used when an patient with LEP was housed in that room. Additionally, during the intervention period, the average interpretation time for patients with LEP was less than 20 minutes per day, which is at least what we would expect nurses and physicians combined to spend with an individual patient.
This intervention was focused largely on access provision, without a dedicated push from leadership; and, because the phones were not widely available on other floors, physicians taking care of patients on multiple floors may not always have thought to use them on this one floor. Given this limitation, it is possible that our findings are an underestimate of the potential impact with a more supported and universal roll-out.
Our study only encompassed the experience of a single institution with limited interpreter use in the hospital before starting the intervention. However, the low level of interpreted encounters during the pre-intervention period was not unlike the expected levels in most hospitals in the country at the same time, the majority of which continue to face the challenge of providing linguistic access to patients with LEP as required by Health and Human Services interpretation of Title VI of the Civil Rights Act and Final Rule implementing the prohibition of discrimination under the Affordable Care Act.36,37 Finally, our study included only patients 50 years and older, but because on average adult patients with LEP are 20 years older than EP patients in this hospital, we likely did not exclude many LEP adults. However, our results may not be as generalizable to hospitals serving a younger LEP population.
Finally, we did not conduct a formal cost study, but rather only were able to estimate potential expenditure savings associated with the lower rate of readmission during the intervention period.
Conclusion
We observed a decrease in readmissions for limited English proficient patients that corresponded to the increase in access to professional interpreter services, and no overall change in length of stay. Comprehensive language access for Patients with LEP represents an important service that all medical centers should provide in order to achieve equitable, high quality healthcare for vulnerable LEP populations. While there are modest costs associated with professional interpretation, this is offset by estimated hospital expenditure savings which will be increasingly meaningful in the era of population-based health and accountable care organizations, and is a small price to pay for more equitable care.
Acknowledgments
This work was funded by the National Institute on Aging, National Institutes of Health (R01 AG038684). Dr. Pérez-Stable was supported in part by the Resource Centers for Minority Aging Research program of the National Institute on Aging, National Institutes of Health (P30 AG15272).
The findings and conclusions in this article are those of the authors and do not necessarily represent the views or the official position(s) of the National Institutes of Health or any of the sponsoring organizations and agencies of the US government.
Footnotes
The authors report no conflict of interest pertaining to this manuscript.
References
- 1.Detailed Languages Spoken at Home and Ability to Speak English for the Population 5 Years and Over: 2009–2013. US Census Bureau; 2013. Available from: http://www.census.gov/data/tables/2013/demo/2009-2013-lang2tables.html. [Google Scholar]
- 2.HHS, editor. 2006 National Healthcare Disparities Report. Washington D.C: U.S. Department of Health and Human Services; 2006. [Google Scholar]
- 3.Cultural Competence in Health Care: is it important for people with chronic conditions. Washington, D.C: Center on an Aging Society, Georgetown University; 2004. [Google Scholar]
- 4.Fiscella K, Franks P, Doescher MP, et al. Disparities in health care by race, ethnicity, and language among the insured: findings from a national sample. Med Care. 2002;40(1):52–9. doi: 10.1097/00005650-200201000-00007. [DOI] [PubMed] [Google Scholar]
- 5.Fox SA, Stein JA. The effect of physician-patient communication on mammography utilization by different ethnic groups. Med Care. 1991;29(11):1065–82. doi: 10.1097/00005650-199111000-00001. [DOI] [PubMed] [Google Scholar]
- 6.Kirkman-Liff B, Mondragon D. Language of interview: relevance for research of southwest Hispanics. Am J Public Health. 1991;81(11):1399–404. doi: 10.2105/ajph.81.11.1399. [DOI] [PMC free article] [PubMed] [Google Scholar]
- 7.Woloshin S, Schwartz LM, Katz SJ, et al. Is language a barrier to the use of preventive services? J Gen Intern Med. 1997;12(8):472–7. doi: 10.1046/j.1525-1497.1997.00085.x. [DOI] [PMC free article] [PubMed] [Google Scholar]
- 8.Carrasquillo O, Orav EJ, Brennan TA, et al. Impact of language barriers on patient satisfaction in an emergency department. J Gen Intern Med. 1999;14(2):82–7. doi: 10.1046/j.1525-1497.1999.00293.x. [DOI] [PubMed] [Google Scholar]
- 9.Crane JA. Patient comprehension of doctor-patient communication on discharge from the emergency department. J Emerg Med. 1997;15(1):1–7. doi: 10.1016/s0736-4679(96)00261-2. [DOI] [PubMed] [Google Scholar]
- 10.Gandhi TK, Burstin HR, Cook EF, et al. Drug complications in outpatients. Journal of General Internal Medicine. 2000;15(3):149–54. doi: 10.1046/j.1525-1497.2000.04199.x. [DOI] [PMC free article] [PubMed] [Google Scholar]
- 11.Hines AL, Andrews RM, Moy E, et al. Disparities in rates of inpatient mortality and adverse events: race/ethnicity and language as independent contributors. Int J Environ Res Public Health. 2014;11(12):13017–34. doi: 10.3390/ijerph111213017. [DOI] [PMC free article] [PubMed] [Google Scholar]
- 12.Manson A. Language concordance as a determinant of patient compliance and emergency room use in patients with asthma. Med Care. 1988;26(12):1119–28. doi: 10.1097/00005650-198812000-00003. [DOI] [PubMed] [Google Scholar]
- 13.Hasnain-Wynia R, Yonek J, Pierce D, et al. Hospital langague services for patients with limited English proficiency: Results from a national survey. Health Research & Educational Trust and National Health Law Program. 2006:20. [Google Scholar]
- 14.Divi C, Koss RG, Schmaltz SP, et al. Language proficiency and adverse events in US hospitals: a pilot study. Int J Qual Health Care. 2007;19(2):60–7. doi: 10.1093/intqhc/mzl069. [DOI] [PubMed] [Google Scholar]
- 15.John-Baptiste A, Naglie G, Tomlinson G, et al. The effect of English language proficiency on length of stay and in-hospital mortality. J Gen Intern Med. 2004;19(3):221–8. doi: 10.1111/j.1525-1497.2004.21205.x. [DOI] [PMC free article] [PubMed] [Google Scholar]
- 16.Karliner LS, Kim SE, Meltzer DO, et al. Influence of language barriers on outcomes of hospital care for general medicine inpatients. J Hosp Med. 2010;5(5):276–82. doi: 10.1002/jhm.658. [DOI] [PubMed] [Google Scholar]
- 17.IOM. Unequal treatment: confronting racial and ethnic disparities in health care. Institute of Medicine of the National Academies; 2002. [PMC free article] [PubMed] [Google Scholar]
- 18.Betencourt J. Improving quality and achieving equity: the role of cultural competence in reducing racial and ethnic disparities in health care. The Commonwealth Fund; 2006. [Google Scholar]
- 19.Goode R, Dunne M, Bronheim S. The evidence base for cultural and linguistic competency in health care. The commonwealth Fund; 2006. [Google Scholar]
- 20.Karliner LS, Jacobs EA, Chen AH, et al. Do professional interpreters improve clinical care for patients with limited English proficiency? A systematic review of the literature. Health Serv Res. 2007;42(2):727–54. doi: 10.1111/j.1475-6773.2006.00629.x. [DOI] [PMC free article] [PubMed] [Google Scholar]
- 21.Lindholm M, Hargraves JL, Ferguson WJ, et al. Professional language interpretation and inpatient length of stay and readmission rates. J Gen Intern Med. 2012;27(10):1294–9. doi: 10.1007/s11606-012-2041-5. [DOI] [PMC free article] [PubMed] [Google Scholar]
- 22.Lopez L, Rodriguez F, Huerta D, et al. Use of Interpreters by Physicians for Hospitalized Limited English Proficient Patients and Its Impact on Patient Outcomes. J Gen Intern Med. 2015 doi: 10.1007/s11606-015-3213-x. [DOI] [PMC free article] [PubMed] [Google Scholar]
- 23.Chen AH, Youdelman MK, Brooks J. The legal framework for language access in healthcare settings: Title VI and beyond. J Gen Intern Med. 2007;22(Suppl 2):362–7. doi: 10.1007/s11606-007-0366-2. [DOI] [PMC free article] [PubMed] [Google Scholar]
- 24.Regenstein M, Mead H, Muessig KE, et al. Challenges in Language Services: Identifying and Responding to Patients' Needs. J Immigr Minor Health. 2008 doi: 10.1007/s10903-008-9157-z. [DOI] [PubMed] [Google Scholar]
- 25.Wilson-Stronks A, Galvez E. Hospitals, Language, and Culture: A Snapshot of the Nation. The Joint Commission and The California Endowment; 2007. [Google Scholar]
- 26.Jacobs EA, Sadowski LS, Rathouz PJ. The impact of an enhanced interpreter service intervention on hospital costs and patient satisfaction. J Gen Intern Med. 2007;22(Suppl 2):306–11. doi: 10.1007/s11606-007-0357-3. [DOI] [PMC free article] [PubMed] [Google Scholar]
- 27.Jacobs EA, Leos GS, Rathouz PJ, et al. Shared networks of interpreter services, at relatively low cost, can help providers serve patients with limited english skills. Health Aff (Millwood) 2011;30(10):1930–8. doi: 10.1377/hlthaff.2011.0667. [DOI] [PubMed] [Google Scholar]
- 28.Ku L, Flores G. Pay now or pay later: providing interpreter services in health care. Health Aff (Millwood) 2005;24(2):435–44. doi: 10.1377/hlthaff.24.2.435. [DOI] [PubMed] [Google Scholar]
- 29.Schenker Y, Perez-Stable EJ, Nickleach D, et al. Patterns of interpreter use for hospitalized patients with limited English proficiency. J Gen Intern Med. 2011;26(7):712–7. doi: 10.1007/s11606-010-1619-z. [DOI] [PMC free article] [PubMed] [Google Scholar]
- 30.Flores G, Torres S, Holmes LJ, et al. Access to hospital interpreter services for limited English proficient patients in New Jersey: a statewide evaluation. J Health Care Poor Underserved. 2008;19(2):391–415. doi: 10.1353/hpu.0.0007. [DOI] [PubMed] [Google Scholar]
- 31.CMS. Medicare Hospital Quality Chartbook: Performance report on outcome measures. 2014 Available from: https://www.cms.gov/Medicare/Quality-Initiatives-Patient-Assessment-Instruments/HospitalQualityInits/Downloads/Medicare-Hospital-Quality-Chartbook-2014.pdf.
- 32.3M. 3M APR DRG Software. cited 2015 November 5. Available from: http://solutions.3m.com/wps/portal/3M/en_US/Health-Information-Systems/HIS/Products-and-Services/Products-List-A-Z/APR-DRG-Software/
- 33.Elixhauser A, Steiner C, Palmer L. Clinical Classifications Software: Healthcare Cost and Utilization Project. 2014 Available from: http://www.hcup-us.ahrq.gov/toolssoftware/ccs/ccs.jsp.
- 34.Diamond LC, Tuot DS, Karliner LS. The use of Spanish language skills by physicians and nurses: policy implications for teaching and testing. J Gen Intern Med. 2012;27(1):117–23. doi: 10.1007/s11606-011-1779-5. [DOI] [PMC free article] [PubMed] [Google Scholar]
- 35.Tuot DS, Lopez M, Miller C, et al. Impact of an easy-access telephonic interpreter program in the acute care setting: an evaluation of a quality improvement intervention. Jt Comm J Qual Patient Saf. 2012;38(2):81–8. doi: 10.1016/s1553-7250(12)38011-2. [DOI] [PubMed] [Google Scholar]
- 36.Title VI of the Civil Rights Act. 1964 [updated 1964; cited 2008 October 2]; Available from: <http://www.usdoj.gov/crt/cor/coord/titlevi.php>.
- 37.Services UDoHaH. Section 1557 of the Patient Protection and Affordable Care Act. Washington D.C: HHS; 2016. Available from: http://www.hhs.gov/civil-rights/for-individuals/section-1557/index.html. [Google Scholar]