

Abstract
Key points
Muscle atrophy is a debilitating condition that affects a high percentage of the population with a negative impact on quality of life.
Dissecting the molecular level of the atrophy process, and the similarities/dissimilarities among different catabolic conditions, is a necessary step for designing specific countermeasures to attenuate/prevent muscle loss.
The FoxO family transcription factors represent one of the most important regulators of atrophy programme stimulating the expression of many atrophy‐related genes.
The findings of the present study clearly indicate that the signalling network controlling the atrophy programme is specific for each catabolic condition.
Abstract
Muscle atrophy is a complex process that is in common with many different catabolic diseases including disuse/inactivity and ageing. The signalling pathways that control the atrophy programme in the different disuse/inactivity conditions have not yet been completely dissected. The inhibition of FoxO is considered to only partially spare muscle mass after denervation. The present study aimed: (i) to determine the involvement of FoxOs in hindlimb suspension disuse model; (ii) to define whether the molecular events of protein breakdown are shared among different unloaded muscles; and finally (iii) to compare the data obtained in this model with another model of inactivity such as denervation. Both wild‐type and muscle‐specific FoxO1,3,4 knockout (FoxO1,3,4−/−) mice were unloaded for 3 and 14 days and muscles were characterized by functional, morphological, biochemical and molecular assays. The data obtained show that FoxOs are required for muscle loss and force drop during unloading. Moreover, we found that FoxO‐dependent atrogenes vary in different unloaded muscles and that they diverge from denervation. The findings of the present study clearly indicate that the signalling network that controls the atrophy programme is specific for each catabolic condition.
Keywords: atrogenes regulation, muscle atrophy, muscle disuse
Key points
Muscle atrophy is a debilitating condition that affects a high percentage of the population with a negative impact on quality of life.
Dissecting the molecular level of the atrophy process, and the similarities/dissimilarities among different catabolic conditions, is a necessary step for designing specific countermeasures to attenuate/prevent muscle loss.
The FoxO family transcription factors represent one of the most important regulators of atrophy programme stimulating the expression of many atrophy‐related genes.
The findings of the present study clearly indicate that the signalling network controlling the atrophy programme is specific for each catabolic condition.
Abbreviations
- CSA
cross‐sectional area
- GS
gastrocnemius
- HU
hindlimb unloading
- MHC
myosin heavy chain
- Sol
soleus
- TA
tibialis anterior
Introduction
A number of catabolic states, including cachexia, sepsis, cancer, diabetes and muscle disuse, are characterized by muscle wasting, mainly reflecting an increased breakdown of myofibrillar proteins. Loss of muscle proteins results in muscle atrophy and weakness and this has significant clinical consequences in terms of disease progression, poor prognosis and reduced life expectancy (Bonaldo & Sandri, 2013). In recent years, there has been a tremendous increase in studies attempting to determine the molecular mechanisms of muscle atrophy. Several animal models (e.g. denervation, hindlimb suspension, cast immobilization, mechanical ventilation) have been developed to mimic human muscle atrophy during inactivity or absence of gravity. Despite muscle atrophy being a common phenomenon in all these animal models, the rate of muscle loss and the signalling pathways involved in the regulation of protein degradation are heterogeneous (Pellegrino et al. 2011 a; Milan et al. 2015).
Disuse atrophy is a complex process that occurs as the result of changes in the balance between anabolic and catabolic processes that, ultimately, favours protein breakdown over protein synthesis (Bodine & Baehr, 2014). A big advance in the field was the discovery that muscle wasting requires a transcriptional programme to activate a subset of genes named atrophy‐related genes or atrogenes (Sandri, 2008; Glover et al. 2010). These atrogenes are commonly up‐ or down‐regulated in different catabolic conditions, such as fasting, cancer, diabetes, renal or heart failure and sepsis, as well as after denervation, spinal cord dissection or immobilization (Lecker et al. 2004). The main routes that increase overall rates of protein degradation during muscle atrophy are the ubiquitin‐proteasome and the autophagy‐lysosome systems via a series of transcriptional adaptations that regulate critical rate‐limiting enzymes in the ubiquitination process and in the cargo recognition and autophagosome formation (Masiero et al. 2009; Desaphy et al. 2010; Sandri, 2013).
Because there is a common set of genes that controls muscle wasting, the hypothesis of a master transcription factor being involved in regulation of atrogenes and being commonly activated in these catabolic conditions has emerged. Indeed, a substantial body of work identifies few pathways and transcription factors being involved in muscle atrophy. The FoxO family of transcription factors has been shown to be up‐regulated during various models of atrophy (Lecker et al. 2004; Desaphy et al. 2010) and this is sufficient to stimulate the expression of many atrophy‐related genes. The first to be identified as FoxO targets were the atrophy‐related ubiquitin ligases, Atrogin1 and MuRF1. The induction of these two genes is now used as a marker of muscle atrophy (Bodine et al. 2001). However, Atrogin1 and MuRF1 knockout mice are only partially or transiently protected from muscle loss after denervation, suggesting that other genes are also involved in protein breakdown (Bodine et al. 2001; Sandri, 2016). Subsequent work has shown that several autophagy genes were downstream FoxOs (Mammucari et al. 2007).
Recently, deletion of all FoxO members specifically in skeletal muscles was shown to prevent loss of muscle mass and force in response to fasting and denervation. It was also demonstrated that FoxO family is not only sufficient, but also necessary for the induction of a large amount of atrophy‐related genes (Milan et al. 2015). Interestingly, the protection of muscle mass and strength was total during fasting but only partial during denervation. Consistent with the morphological and functional data, the list of the FoxO‐dependent atrophy‐related genes only partially overlapped between fasting and denervation. Moreover, a group of novel atrogenes belonging to the ubiquitin ligase family was described. These findings suggest that involvement of FoxOs in the atrophy programme depends on the catabolic condition (Milan et al. 2015). According to the complexity of the signalling network that controls muscle loss, we recently found that hindlimb suspension can differentially impact on the atrophic programme among different muscles (Brocca et al. 2010; Cannavino et al. 2014; Cannavino et al. 2015).
Teken together, such evidence highlights the concept that the activation of the atrophy programme is specific to the catabolic conditions and the type of muscle. Therefore, an accurate characterization of the atrophic programme in every disease is a prerequisite when designing the most appropriate therapeutic strategy.
In the present study, we focused on atrophy induced by hindlimb unloading (HU), which has been validated for decades as a model of hypokinesia and hypodynamia. The present study aimed: (i) to determine whether the lack of FoxOs is able to protect muscle mass and force in a HU disuse model; (ii) to define the molecular events controlling muscle loss in different unloaded muscles with a particular interest in dissecting which atrogenes are under FoxO control; and finally (iii) to compare the data obtained in unloading with another model of inactivity, such as denervation.
Our data show that, unlike denervation, inhibition of FoxO completely spared muscle mass and force during unloading and that the atrogenes under FoxO regulation are different from those of denervation. Finally, a comparison of the different muscles revealed several differences in gene regulation despite an identical effect on muscle mass.
Methods
Ethical approval
Animal handling and experimentation were performed in line with approved Institutional Animal Care and Use Committee protocols at the University of Pavia and followed the national authority guidelines for the detention, use and ethical treatment of laboratory animals, and they also conform with the principles and regulations described in Grundy (2015).
Animal care and HU
Four‐month‐old FoxO1,3,4‐floxed transgenic mice (FoxO1,3,4f/f) and triple FoxO1,3,4 muscle‐specific knockout (FoxO1,3,4–/–) mice, as described previously by (Milan et al. 2015), were used. Mice were unloaded for 3 and 14 days as described previously (Brocca et al. 2010). Briefly, the suspension system comprised a cage and an animal fixation system. The bottom of the cage comprised a transparent acrylic box that enabled animal visualization and control, with an open top. A metal‐bar cage was placed on top of this box, with side fittings to assure fixation to the acrylic box. The animal fixation system was connected on the upper portion of the cage. Animals were suspended by tying the tail to the fixation system using thin string. The string was attached to the mouse tail through a medical taping. The length of the string allowed the animals to move freely on their forelimbs, when the body was inclined at 30–40° from the horizontal plane. All mice had access to water and food ad libitum. The control C57BL/6 and FoxO1,3,4−/− mice were maintained free in single cages. For each experimental group, four animals were used.
The animals of all experimental groups were killed at 10.00 h after 2 h without food with cervical dislocation preceded by anaesthesia (Zoletil, 50 mg kg–1, i.m. injection). For the animals suspended for 3 days, soleus (Sol), gastrocnemius (GS) and tibialis anterior (TA) muscles were dissected, immediately frozen in liquid nitrogen and stored at −80°C. For the animals suspended for 14 days, the right Sol and TA were dissected in Krebs solution and immediately used for mechanical experiment on whole muscle; the right GS was dissected, divided in smaller bundles, stored at −20°C in skinning solution (150 mm potassium propionate, 5 mm KH2PO4, 5 mm magnesium acetate, 3 mm Na2ATP, 5 mm EGTA, pCa 9.0) plus 50% glycerol and used for functional experiments on single muscle fibres (force and tension). The contralateral Sol, GS and TA were frozen in liquid nitrogen and used for histological analysis and myosin heavy chain (MHC) composition analysis.
Cross‐sectional area (CSA) analysis
CSA of individual muscle fibres was determined in the mid‐belly region of Sol, GS and TA muscle for all experimental groups as described previously (Brocca et al. 2010). Briefly, muscle serial transverse sections (10 μm thick) were cut in a cryostat at −20°C and stained with haematoxylin and eosin. Images of the stained sections were captured from a light microscope (DMLS; Leica Microsystems, Wetzlar, Germany) and transferred to a personal computer using a video camera (DFC280; Leica Microsystems). Fibre CSA was measured using ImageJ (NIH, Bethesda, MD, USA) and expressed in μm2.
Analysis of MHC isoform content
The MHC isoform composition was determined using an electrophoretic approach previously described in detail (Brocca et al. 2010). Frozen muscles were pulverized in a steel mortar with liquid nitrogen to obtain a powder that was immediately re‐suspended in Laemmli solution (62.5 mm Tris‐HCl pH 6.8, 2.3% SDS, 10% glycerol, 5% β‐mercaptoethanol) (Laemmli, 1970). Protein concentration of dissolved samples was determined with a protein assay kit (RC DC; Bio‐Rad, Hercules, CA, USA). Proteins from each sample (∼10 μg) were loaded onto 8% SDS‐PAGE polyacrylamide gels and electrophoresis was run for 2 h at 200 V and then for 24 h at 250 V according to Talmadge et al. (1996). Following Coomassie staining, four bands corresponding to MHC isoforms were separated and a densitometric analysis was performed to assess the relative proportion of MHC isoforms (MHC‐1, MHC‐2A, MHC‐2X and MHC‐2B) in the samples (Brocca et al. 2010; Liu et al. 2012).
Functional analysis of isolated muscles
Sol and TA were dissected in an oxygenated Krebs solution (120 mm NaCl, 2.4 mm KCl, 2.5 mm CaCl2, 1.2 mm MgSO4, 5.6 mm glucose, 1.2 mm KH2PO4, 24.8 mm NaHCO3, pH 7.4) bubbled with 95% O2 and 5% CO2 under a stereomicroscope at room temperature. Briefly, muscles, tied up at the tendons using silk threads, were transferred to the organ baths filled with Krebs solution constantly bubbled and kept at constant temperature (22°C). Stimulation was delivered through platinum electrodes connected to a Grass stimulator (S48 stimulator; Astro‐Med, Warwick, RI, USA). Prior to measurements, both muscles length and stimulation voltage were adjusted to yield maximal twitch force. Isometric force and tetanic force were evoked (110 Hz, 500 ms, supramaximal amplitude) at L 0 (the length at which the maximal isometric force is observed).
Functional analysis of single muscle fibres
Functional properties of single muscle fibres from gastrocnemius were analysed as previously described in detail (Blaauw et al. 2009). Segments of single fibres were manually isolated from muscle bundles with the help of a stereomicroscope at 20–40× magnifications in a muscle chamber containing skinning solution (150 mm K‐P, mm KH2PO4, 5 mm MgAc, 1 mm DTT, 5 mm EGTA, 3 mm Na2‐ATP, pH 7, leupeptine hydrochloride 20 μg mL–1, E64 10 μm). Fibres were immersed for 1 h in skinning solution containing 0.1% Triton X‐100 and then returned to the previous skinning solution. Each fibre was mounted between two hooks on a stage of an inverted microscope; diameters and length (∼1 mm) were measured for each fibre to calculate fibre volume.
Isometric force and tension were measured by the slack test technique. Each fibre was placed in activation solution 100 mm KCl, 20 mm imidazole, 5 mm MgCl2, 5 mm Na2ATP, 0.5 mm EGTA, 25 mm creatine phosphate, 300 U mL–1 creatine kinase, pCa 8.0) and subjected to activation. Experiments were performed at 20°C, in conditions of maximal activation (pCa 4.5) and at optimal sarcomere length for force developing (Bottinelli & Reggiani, 2000).
Gene expression analysis
Total RNA was extracted from Sol, GS and TA muscles using an SV Total RNA isolation kit (Promega, Madison, WI, USA). The RNA concentration was measured using a NanoDrop instrument (Thermo Scientific, Waltham, MA, USA) and 400 ng was used to generate cDNA with SuperScript III reverse transcriptase (Invitrogen, Carlsbad, CA, USA). The cDNA was analysed by quantitative RT‐PCR (AB 7500) using a SYBR Green PCR kit (Applied Biosystems, Foster City, CA, USA) and the data were normalized to GAPDH expression. The oligonucleotide primers used are shown in Table 1.
Table 1.
The oligonucleotide primers used
| Gene | Forward primer (5′‐ to 3′) | Reverse primer (5′‐to 3′) |
|---|---|---|
| 4EBP1 | CCTCCTTGTGCCTCTGTCTA | GCCTAAGGAAAGATGGGTGT |
| Ampd3 | GCGGAGAAGGTGTTTGCTA | CAGTCTTGTTGTGTTGGCATC |
| ATF4 | TCCTGAACAGCGAAGTGTTG | ACCCATGAGGTTTCAAGTGC |
| ATP5A1 | GAGAGAGCAGCCAAGATGAAC | GACACGGGACACAGACAAAC |
| Atrogin‐1 | GCAAACACTGCCACATTCTCTC | CTTGAGGGGAAAGTGAGACG |
| Bnip3 | TTCCACTAGCACCTTCTGATGA | GAACACCGCATTTACAGAACAA |
| Beclin 1 | GCTCCTGAGGCATGGAGGGGTCT | GGTTTCGCCTGGGCTGTGGTAA |
| Cathepsin l | GTGGACTGTTCTCACGCTCAAG | TCCGTCCTTCGCTTCATAGG |
| Eif4g3P3 | GAAACGGAGAAGAGGCTGAG | GATACAGGCGGGCATAAACT |
| Ezh1 | GTGTTTTCTTTTCTTCTTCTGTGC | GTGTTTTCTTTTCTTCTTCTGTGC |
| FbxO31 | GTATGGCGTTTGTGAGAACC | AGCCCCAAAATGTGTCTGTA |
| Gabarapl 1 | CATCGTGGAGAAGGCTCCTA | ATACAGCTGGCCCATGGTAG |
| Gadd34 | AGAGAAGACCAAGGGACGTG | CAGCAAGGAATGGACTGTG |
| Gadd45a | GAAAGTCGCTACATGGATCAGT | AAACTTCAGTGCAATTTGGTTC |
| GAPDH | CACCATCTTCCAGGAGCGAG | CCTTCTCCATGGTGGTGAAGAC |
| Itch | CCACCCACCCCACGAAGACC | CTAGGGCCCGAGCCTCCAGA |
| JunB | GATCCCTATCGGGGTCTCAA | GAGGCTAGCTTCAGAGATGC |
| LC3b | CACTGCTCTGTCTTGTGTAGGTTG | TCGTTGTGCCTTTATTAGTGCATC |
| Maf | GCATCATCAGCCAGTGCGGC | AGGTGCGCCTTCTGTTCGCT |
| Max | CGAAAACGTAGGGACCACAT | GATCTTGCCTTCTCCAGTGC |
| Mt1 | GCCTGCAAGAACTGCAAGTG | CCTTTGCAGACACAGCCCT |
| MUSA1 | TCGTGGAATGGTAATCTTGC | CCTCCCGTTTCTCTATCACG |
| MuRF‐1 | ACCTGCTGGTGGAAAACATC | ACCTGCTGGTGGAAAACATC |
| Nrf2 | CTCTGACTCTGGCATTTCACTG | ACACTTCAGGGGCACTATCTA |
| Nucleolin | TTTATCAAAGTGCCCCAGAA | GTTCTGCCCTCAATTTCCAT |
| p62 | CCCAGTGTCTTGGCATTCTT | AGGGAAAGCAGAGGAAGCTC |
| Pfkfb3 | GCCTCTTGACCCTGATAAATGT | TCTTGCCTCTGCTGGACA |
| Psma1 | CATTGGAATCGTTGGTAAAGAC | GTTCATCGGCTTTTTCTGC |
| Psmc4 | AGGACGAGCAGAAGAACCTG | AATAGTTAGAGCCTGTGGTGGAG |
| Psmd11 | GAGTTCCAGAGAGCCCAGTC | AACCCAGTTCAAGGATGCTC |
| Psme4 | TTGTAGATGCATGCCGACTC | ACCTGGGTGAGTTTTGGTTC |
| SMART | TCAATAACCTCAAGGCGTTC | GTTTTGCACACAAGCTCCA |
| Tgif | TTTCCTCATCAGCAGCCTCT | CTTTGCCATCCTTTCTCAGC |
| Txnl | GGTGGGAGTGAAGCCGGTCG | CGGGGCAATCCGAAGACACG |
| UBC | CGTCGAGCCCAGTGTTACCACC | ACCTCCCCCATCACACCCAAGA |
| Ube4b | TGTCATCTTCCTTTCTTCTCTCTC | TGGATTTTCATCTCGTGTCTG |
| Usp14 | CACGAGTTGCTTCGTATTCC | TTCAGGGTTCCTCCTTTCAC |
FP, forward primer; RP, reverse primer.
Western blotting analysis
Frozen muscle samples were pulverized in a steel mortar with liquid nitrogen and suspended in a lysis buffer (20 mm Tris‐HCl, 1% Triton X‐100, 10% glycerol, 150 mm NaCl, 5 mm EDTA, 100 mm NaF and 2 mm NaPPi supplemented with 1 × protease, phosphatase inhibitors (Sigma‐Aldrich, St Louis, MO, USA) and 1 mm phenylmethane sulphonyl fluoride). The lysate was left for 20 min in ice then centrifuged at 18 000 g for 20 min at 4°C. Protein concentration was determined on the supernatant using the RC DCTM protein assay kit (Bio‐Rad). Samples were stored at –80°C until ready to use. Next, 40 μg of proteins was loaded onto gradient precast gels (Any kD Mini‐PROTEAN TGX; Bio‐Rad). Proteins were electrotransferred to polyvinylidene difluoride membranes at 35 mA overnight in a transfer buffer containing 25 mm Tris, glycine 192 mm and 20% methanol. The membranes were blocked with 5% milk solution consisting of 5% fat‐free milk in TBST (Tris 0.02 m, NaCl 0.05 m and 0.1% Tween‐20) for 2 h at room temperature with constant shaking. At the end, the membranes were rinsed with TBST solution, incubated overnight with specific primary antibodies and subsequently with HRP‐conjugated secondary antibody for 1 h. Protein bands were visualized by an enhanced chemiluminescence method using a digital imaging system (ImageQuant LAS 4000; GE Healthcare, Litle Chalfont, UK). The activity levels of AKT, S6R and 4EBP1 were calculated as the ratio between the content in the phosphorylated (p) and total forms.
For polyubiquitinated proteins, 15 μg of protein was loaded on gradient precast gels and electrotransferred to nitrocellulose membrane at 100 V for 2 h. The membranes were incubated overnight with a specific primary antibody (anti‐polyubiquitinated monoclonalantibody; Enzolife, Farmingdale, NY, USA) and for 1 h with a HRP‐conjugated anti‐mouse secondary antibody. Polyubiquitinated protein levels were quantified calculating the ratio between densitometric values of blot bands and those of the membranes stained with Red Ponceau.
The primary antibodies used were: anti‐rabbit p‐AKT(ser473) (Cell Signaling, Beverly, MA, USA); anti‐rabbit AKT (Cell Signaling); anti‐rabbit p‐S6Rp(ser235/236) (Cell Signaling); anti‐rabbit S6Rp (Cell Signaling); anti‐rabbit p‐4EBP1(thr37/46) (Cell Signaling); anti‐rabbit 4EBP1 (Cell Signaling); anti‐rabbit p‐AMPK(thr 172) (Cell Signaling); anti‐rabbit AMPK (Cell Signaling); anti‐rabbit p‐ACC(ser79) (Cell Signaling); anti‐rabbit ACC (Cell Signaling); anti‐rabbit PGC‐1α (Abcam); anti‐rabbit LC3B (Sigma‐Aldrich); anti‐polyubiquitinated monoclonalantibody (Enzolife); anti‐mouse IgG (Dako, Glostrup, Denmark); and anti‐rabbit IgG (Cell Signaling).
Statistical analysis
Data are expressed as the mean ± SEM. Statistical significance of the differences between means was assessed by two‐way ANOVA followed by a Bonferoni test. P < 0.05 was considered statistically significant.
Results
FoxOs deletion preserves muscle mass and prevents fibre‐type switch during HU
The measurements of muscle mass confirmed that HU triggered a significant muscle loss. Both muscle/body weight ratio and CSA significantly decreased following a prolonged period of disuse (14 days HU) in WT mice in all muscles (Fig. 1 A,B). FoxO1,3,4−/− mice are completely protected from muscle atrophy in GS and TA muscles but not in Sol, which showed muscle mass loss, although less than WT mice. Indeed, the Sol muscle/body weight ratio decreased by 41% in WT‐HU14 and by 22% in FoxO1,3,4–/– HU14 mice, whereas CSA fell by 29% in WT‐HU14 and by 22% in FoxO1,3,4–/– HU14 mice (Fig. 1 B).
Figure 1. FoxOs deletion preserves muscle mass and prevents fibre‐type switch during HU.
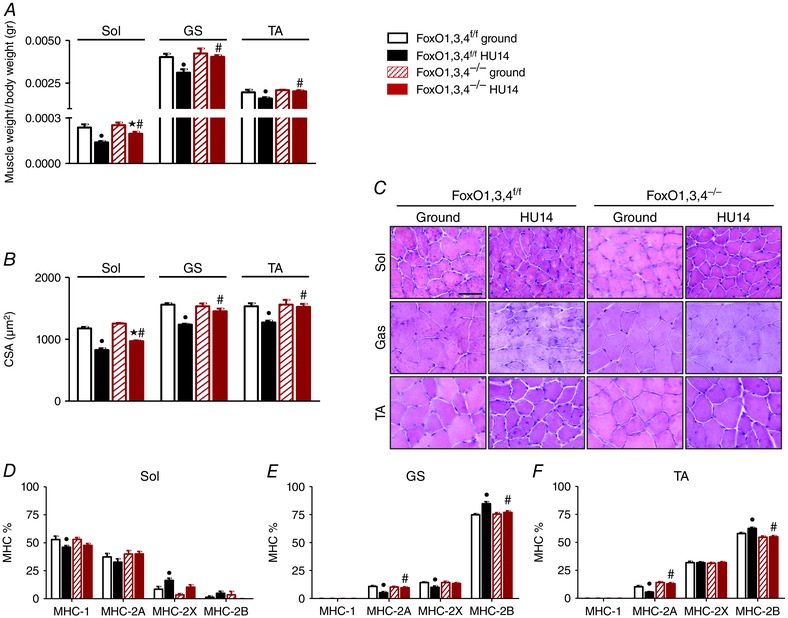
A, determination of muscle weight/body weight in Sol, GS and TA from FoxO1,3,4f/f and FoxO1,3,4−/− mice in ground condition and after 14 days of unloading (HU14). B, quantification of average fibre area (CSA) of Sol, GS and TA from FoxO1,3,4 f/f and FoxO1,3,4−/− in ground condition and after 14 days of unloading (HU14). C, representative cryosections stained with haematoxylin and eosin; scale bar = 100 μm. D, E and F, MHC isoforms distribution of Sol, GS and TA from FoxO1,3,4f/f and FoxO1,3,4−/− in ground condition and after 14 days of unloading (HU14) (n = 4 in each group). •Significantly different from WT‐g (P < 0.05). ★Significantly different from KO‐g (P < 0.05). #Significantly different from WT‐HU14 (P < 0.05). Data are presented as the mean ± SEM.
The MHC isoform distribution analysis confirmed the slow to fast shift induced by HU in muscles of WT mice (Fig. 1 D–F). In FoxO1,3,4–/– mice, we did not find any changes of MHC composition after 14 days of suspension.
FoxOs deletion prevents muscle weakness induced by HU
Because muscle force substantially depends on the amount of muscle mass, we assessed whether the lack of FoxOs also protects muscle strength.
We measured muscle force and fatigue in whole Sol and TA of ground and HU wild‐type and transgenic mice. Both Sol and TA of WT‐HU14 mice generated lower strength in comparison to the ground controls. Importantly, force drop after unloading was completely prevented in TA but not in Sol muscles of knockout mice (Fig. 2 A).
Figure 2. FoxOs deletion prevents muscle weakness induced by HU.
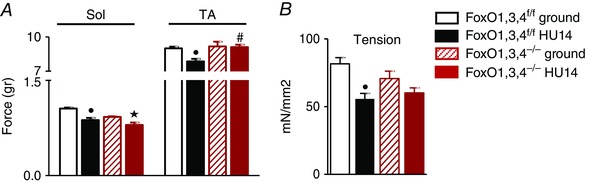
A, force measured in Sol and TA ex vivo muscles from FoxO1,3,4f/f and FoxO1,3,4−/− mice in ground condition and after 14 days of unloading (HU14). B, tension of GS single muscle fibres from FoxO1,3,4f/f and FoxO1,3,4−/− mice in ground condition and after 14 days of unloading (HU14) (n = 4 in each group). •Significantly different from WT‐g (P < 0.05). #Significantly different from WT‐HU14 (P < 0.05). Data are presented as the mean ± SEM.
The data reported in Fig. 2 B show that a significant decrease of specific tension also at level of single myofibres in WT‐HU14 mice. Although present, the decrease after 14 days of disuse was lower and not significant in FoxO null muscle fibres. Therefore, in TA, FoxO deletion was able to prevent weakness and to maintain the same force of loaded muscles.
FoxOs inhibition prevents the induction of atrogenes during HU
Because we found that FoxO deletion prevents muscle loss and weakness induced by 14 days of unloading, we attempted to identify which atrogenes are under FoxO regulation and therefore are crucial for muscle atrophy during unloading. We analysed the expression of the atrogenes that were found to be under FoxO regulation in fasting and denervation (Milan et al. 2015). We also included in the list of atrogenes the novel ubiquitin ligases MUSA1, SMART, FbxO31 and Itch that we have recently found to be upregulated in fasting and denervation (Sartori et al. 2013; Milan et al. 2015) and are critical for protein ubiquitination and muscle loss in these conditions.
In GS, 28 atrogenes were up‐regulated in WT mice by 3 days of unloading. The induction of 27 genes (MuRF1, Atrogin‐1, Psmc4, Psmd11, Psme4, Ube4b, Usp14, UBC, SMART, MUSA1, FbxO31, LC3B, Gabarapl1, cathepsin l, Bnip3, p62, Beclin1, Ampd3, Pfkfb3, Gadd45, 4EBP1, Eif4g3P3, Mt1, Tgif, Nucleolin, Ezh1, Gadd34) was blunted in FoxO1,3,4 knockout mice (Fig. 3). Psma1 and Max were unchanged in WT mice after disuse and down‐regulated in FoxO1,3,4−/− mice following 3 days of unloading.
Figure 3. FoxOs inhibition prevents induction of atrogenes during HU in GS.
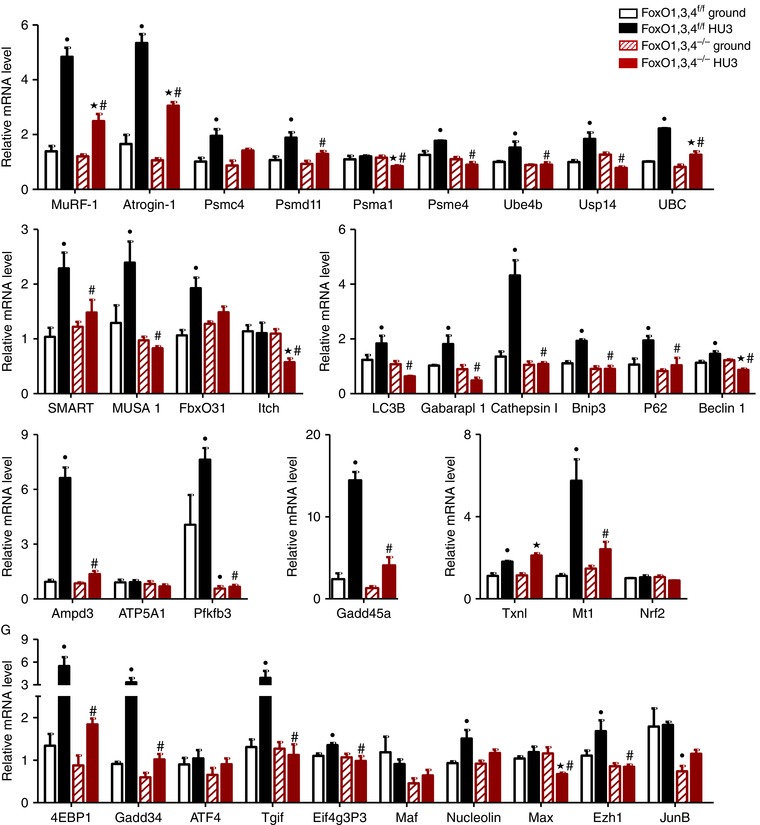
Quantitative RT‐PCR of the indicated atrogenes in GS from FoxO1,3,4f/f and FoxO1,3,4−/− mice in ground condition and after 3 days of unloading (HU3) (gene functions are reported in Table 3). Data are normalized to GAPDH (n = 4 in each group). •Significantly different from WT‐g (P < 0.05). ★Significantly different from KO‐g (P < 0.05). #Significantly different from WT‐HU3 (P < 0.05). Data are presented as the mean ± SEM.
TA muscle showed an up‐regulation of 25 atrogenes in WT mice by disuse. Twenty‐two of these genes were totally or partially inhibited by FoxO deletion (MuRF1, Atrogin‐1, Psmc4, Psme4, Ube4b, Usp14, SMART, Itch, Gabarap11, cathepsin1, Bnip3, p62, Beclin1, Ampd3, Pfkfb3, Gadd45, 4EBP1, Maf, Mt1, Tgif, Ezh1, JunB) after unloading (Fig. 4).
Figure 4. FoxOs inhibition prevents atrogenes induction during HU in tibialis.
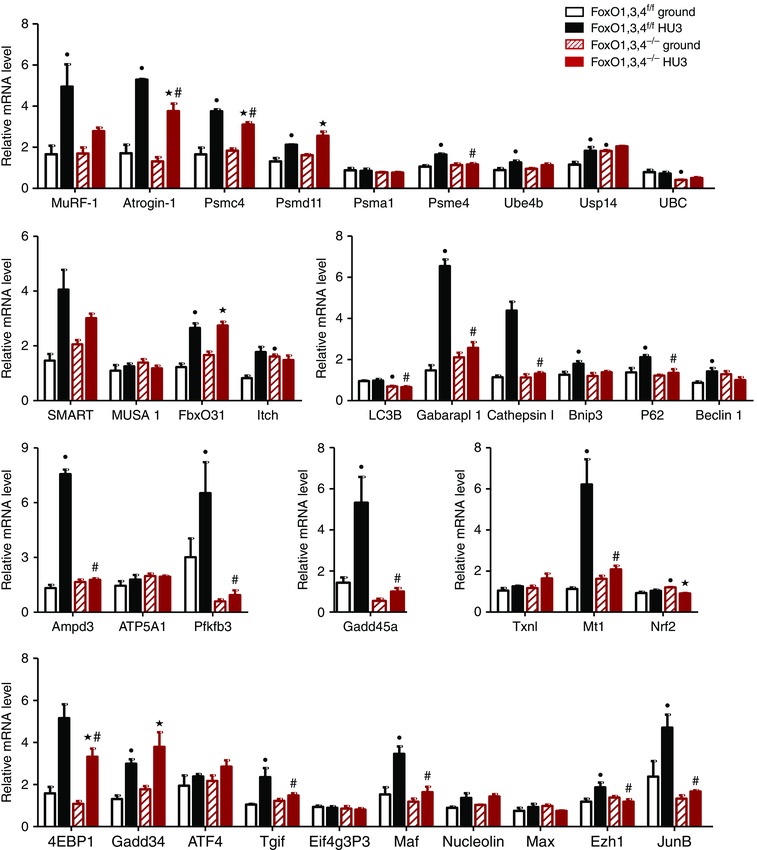
Quantitative RT‐PCR of the indicated atrogenes in tibialis from FoxO1,3,4f/f and FoxO1,3,4−/− mice in ground condition and after 3 days of unloading (HU3) (gene functions are reported in Table 3). Data are normalized to GAPDH (n = 4 in each group). •Significantly different from WT‐g (P < 0.05). ★Significantly different from KO‐g (P < 0.05). #Significantly different from WT‐HU3 (P < 0.05). Data are presented as the mean ± SEM.
To better define the impact of the degradative systems in unloading, we investigated the level of lipidated microtubule‐associated protein light chain 3 (LC3BII), as marker of autophagy, and the protein ubiquitination as readout of ubiquitin‐proteasome system. We found an increase of LC3BII and polyubiquitinated protein levels in unloaded muscles of WT mice. Importantly, this increase was completely abolished in unloaded FoxO1,3,4−/− mice (Fig. 5 A, B, D and E).
Figure 5. FoxOs deletion blocks the ubiquitin proteasome and autophagy lysosome systems.
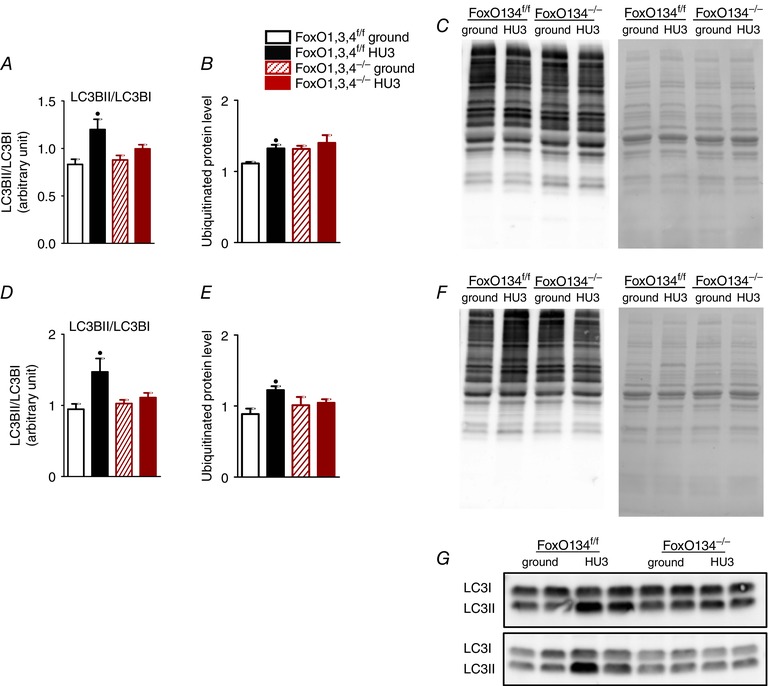
A, quantification of protein levels of LC3BII in gastrocnemius from FoxO1,3,4f/f and FoxO1,3,4−/− mice in ground condition and after 3 days of unloading (HU3) based on the ratio between the content in forms II and I of LC3 by western blotting. B, relative content and representative blot (C) of polyubiquitinated proteins in GS muscle. D, quantification of protein levels of LC3BII in TA. E, relative content and representative blot (F) of polyubiquitinated proteins in TA. G, representative blot of LC3 in GS (upper) and TA (bottom) n = 4 in each group. •Significantly different from WT‐g (P < 0.05). #Significantly different from WT‐HU3 (P < 0.05). Data are presented as the mean ± SEM.
FoxO‐dependent atrogenes vary in different muscles and catabolic conditions
When we checked the expression of atrogenes in different muscles subjected to HU, we found that most of these genes were commonly induced (87% in GS and 78% in TA) (Table 2). However, when we compared the list of the FoxO‐dependent atrogenes in GS and TA after unloading we found that only 19 were in common. This finding suggests that each muscle activates a specific set of genes via FoxO during muscle loss (Fig. 6 A).
Table 2.
Different catabolic conditions show a common atrophy programme
| Muscle | Catabolic condition | Number of induced atrogenes (with respect to the set of 36 atrogenes analysed) | Percentage induced atrogenes (with respect to the set of 36 atrogenes analysed) |
|---|---|---|---|
| GS (WT mice) | HU | 28 | 78 |
| GS (WT mice) | Denervation | 31 (Milan et al., 2015) | 86 |
| TA (WT mice) | HU | 25 | 70 |
| TA (WT mice) | Fasting | 33 (Milan et al., 2015) | 92 |
Induction of atrogenes is shown in different catabolic conditions (number and percentage with respect to the set of 36 atrogenes analysed).
Figure 6. FoxO‐dependent atrogenes vary in different muscles and catabolic conditions.
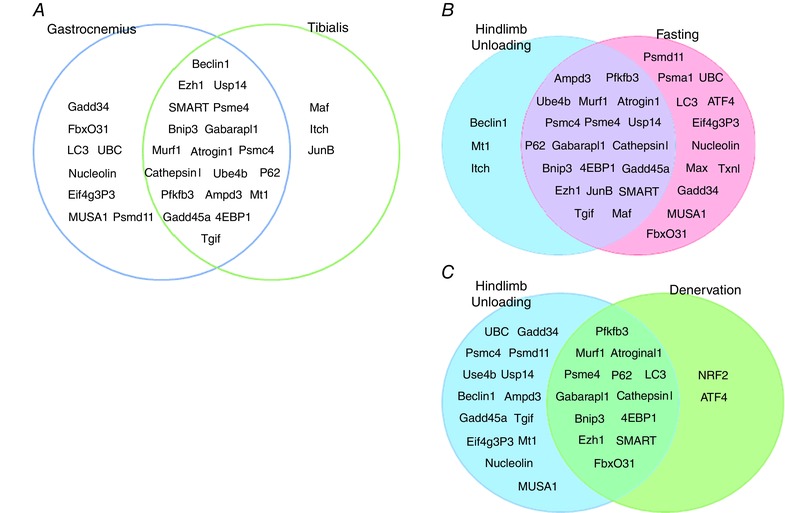
A, FoxO‐dependent atrogenes common in gastrocnemius and tibialis muscle following hindlimb suspension. B, FoxO‐dependent atrogenes common in HU and fasting condition (TA muscle). C, FoxO‐dependent atrogenes common in HU and denervation condition (GS muscle).
Moreover, in attempt to identify whether different models of disuse share the same pattern of FoxO‐dependent atrogenes, we compared the list of atrogenes under FoxO controls in HU model with those found in denervation (Milan et al. 2015). We also extend these analyses to another catabolic condition characterized by metabolic changes and in which disuse/inactivity is absent such as fasting (Milan et al. 2015). We found that of the 27 genes induced in a HU model, only 13 were in common with denervated GS (Fig. 6 C). Surprisingly, among the 22 genes upregulated in the TA by unloading, 19 were shared with the fasting model (Fig. 6 B). Therefore, different disuse atrophy models recruit different transcription factors for the atrophy programme and muscle loss.
Pathways controlling muscle mass
Because muscle protein synthesis is controlled by the insulin‐like growth factor‐1 pathway (Sandri et al. 2013) and considering that several genes involved in energy production can influence the maintenance of muscle mass, we studied pAKT, pS6, p4EBP1, pAMPK and PGC1α in the GS and TA of WT and FoxO1,3,4−/− mice.
We found lower pAKT levels in the TA (Fig. 7 E) of unloaded WT mice compared to control mice. However, FoxO1,3,4 knockout mice showed a significant reduction of AKT phosphorylation level in basal condition in all muscles and a further inhibition after disuse in the TA (Fig. 7 E). In WT mice, disuse induced a decrease of S6 phosphorylation level in the TA (Fig. 7 E) and GS (Fig. 7 A) that persisted in the TA of unloaded FoxO1,3,4−/− mice (Fig. 7 E). The phosphorylation level of 4EBP1 did not change in any analysed experimental group in GS, whereas a decrease was observed in the unloaded TA of FoxO KO mice.
Figure 7. Pathways involved in maintenance of muscle mass.
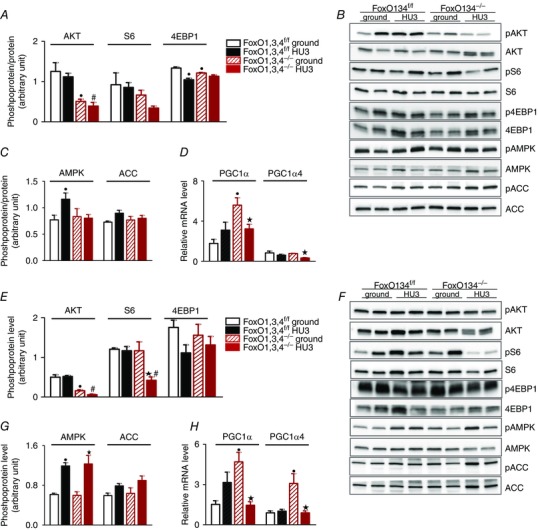
Determination of p‐AKT, p‐S6 and p‐4EBP1 levels in GS (A) and TA (E) muscle from FoxO1,3,4f/f and FoxO1,3,4−/− mice in ground condition and after 3 days of HU (HU3) by western blot analysis. Representative western blot of synthetic factors in GS (B) and TA (F). Determination of p‐AMPK and p‐ACC levels in GS (C) and TA (G) muscle from FoxO1,3,4f/f and FoxO1,3,4−/− mice in ground condition and following HU3 by western blotting. Quantification of PGC1α and PGC1α4 mRNA levels in GS (D) and TA (H) from FoxO1,3,4f/f and FoxO1,3,4−/− mice in ground condition and following HU3 by RT‐PCR. Data are normalized to GAPDH (RT‐PCR). The activity levels of AKT, S6R and 4EBP1 were calculated as the ratio between the content in the phosphorylated (p) and total forms (n = 4 in each group). •Significantly different from WT‐g (P < 0.05). ★Significantly different from KO‐g (P < 0.05). #Significantly different from WT‐HU3 (P < 0.05). Data are presented as the mean ± SEM.
The energy‐stress sensor AMPK activation was increased in the TA (Fig. 7 G) and GS (Fig. 7 C) of unloaded WT mice; the AMPK downstream target, pACC, was higher in the TA (Fig. 7 G) of unloaded WT mice and its increase persisted also in the TA of FoxO1,3,4−/− HU3 mice (Fig. 7 G).
PGC1α, a master regulator of mitochondrial biogenesis and a suppressor of muscle loss after denervation (Desaphy et al. 2010), did not differ in expression level of the unloaded TA and GS of WT mice (Fig. 7 H and Fig. 7 D, respectively). PGC1a was higher in loaded FoxO‐deficient muscle than controls but it was downregulated during unloading in both the TA and GS (Fig. 7 H, Fig. 7 D). Interestingly, the PGC1a4 isoform that has been involved in muscle growth (Ruas et al. 2012) is also inhibited during unloading of FoxO knockout mice. These findings suggest that the beneficial effects of FoxO inhibition in sparing muscle mass do not involve the expression of PGC1a isoforms.
Discussion
The maintenance of muscle mass results from a very complex cross‐talk that needs an orchestrated interaction of different signalling pathways. It is generally accepted that disuse‐induced muscle atrophy involves an imbalance between anabolism and catabolism, with protein loss being eventually predominant (Fanzani et al. 2012). Several factors have been identified as triggers of atrophic process and many of these converge on FoxOs (FoxO1, 3 and 4), the main transcription factors regulating the induction of atrophy‐related genes. Therefore, by controlling autophagy‐lysosome and ubiquitin proteasome systems, FoxOs plays a pivotal role in muscle loss.
In the present study, we initially examined the effects of the absence of the FoxOs family on HU‐induced muscle atrophy. As expected and in accordance with previous studies (Brocca et al. 2010), unloading for 14 days resulted in a significant loss of muscle mass both in fast (17% in TA and 21% in GS) and slow (30% in Sol) muscles compared to control animals (Fig. 1). The partial protection obtained in Sol is not surprising because the promoter (MLC1f) driving the expression of Cre recombinase is active in fast and not in slow fibres (Milan et al. 2015). Therefore, Sol muscle partially retains FoxO expression in type I fibres. Force measurements of whole muscle or of single fibre showed that unloaded WT muscles generated a lower tension than WT controls (Fig. 2). Interestingly, muscle tension is completely preserved during HU in fast muscles in knockout mice (Fig. 2). In agreement with the partial protection of muscle mass, Sol is characterized by a functional deficit (Fig. 2). Based on these data, we have not analysed expression of atrogenes in Sol knockout mice even if we have monitored their expression in the Sol of WT mice.
Consistent with the concept that atrophying muscles exhibit a co‐ordinated series of transcriptional adaptations (Lecker et al. 2004), the comparison of hindlimb suspension, denervation and fasting in WT mice revealed striking similarities in the expression of atrogenes. Although the induction of atrogenes does not completely overlap during HU, denervation and fasting, more than 80% of the analysed genes were increased in these conditions (78% was induced with HU, 86% with denervation and 92% with fasting) (Table 2) confirming the existence of a common atrophy programme among different catabolic conditions. Moreover, when we checked the expression of atrogenes in different muscles subjected to HU, we found that most of these genes, were commonly induced (78% in Sol, 87% in GS and 78% in TA) (Table 3). These findings suggest that a common atrophic programme also occurs in different muscles during disuse.
Table 3.
Different muscles in the same disuse model show a common atrophy programme
| Soleus | WT | HU3 | Gastrocnemius | Tibialis | Function |
|---|---|---|---|---|---|
| MurF‐1 | 1.45 ± 0.45 | 8.16 ± 0.42* | MurF‐1 | MurF‐1 | ubiquitin ligase |
| Atrogin‐1 | 1.51 ± 0.47 | 6.42 ± 1.05* | Atrogin‐1 | Atrogin‐1 | ubiquitin ligase |
| Psmc4 | 0.91 ± 0.08 | 1.69 ± 0.21* | Psmc4 | Psmc4 | proteasome subunit |
| Psmd11 | 0.93 ± 0.09 | 1.25 ± 0.17* | Psmd11 | Psmd11 | proteasome subunit |
| Psme4 | 1.03 ± 0.04 | 1.13 ± 0.05 | Psme4 | Psme4 | proteasome subunit |
| Ube4b | 1.11 ± 0.10 | 1.59 ± 0.34* | Ube4b | Ube4b | E3/E4 enzyme |
| Usp14 | 1.04 ± 0.13 | 1.32 ± 0.25 | Usp14 | Usp14 | de‐ubiquiting enzyme |
| UBC | 1.12 ± 0.19 | 3.75 ± 0.36* | UBC | UBC | ubiquitin gene |
| SMART | 0.89 ± 0.10 | 0.83 ± 0.15 | SMART | SMART | ubiquitin ligase |
| MUSA 1 | 1.16 ± 0.20 | 2.14 ± 0.44* | MUSA 1 | MUSA 1 | ubiquitin ligase |
| FbxO31 | 0.96 ± 0.06 | 2.31 ± 0.32* | FbxO31 | FbxO31 | ubiquitin ligase |
| Itch | 1.01 ± 0.03 | 0.76 ± 0.11 | Itch | Itch | ubiquitin ligase |
| LC3 | 1.50 ± 0.56 | 2.61 ± 0.35* | LC3 | LC3 | autophagy‐related genes |
| Gabarapl 1 | 0.66 ± 0.20 | 0.51 ± 0.09 | Gabarapl 1 | Gabarapl 1 | autophagy‐related genes |
| Cathepsin I | 1.03 ± 0.07 | 5.32 ± 0.38* | Cathepsin I | Cathepsin I | autophagy‐related genes |
| Bnip3 | 0.94 ± 0.10 | 0.49 ± 0.11* | Bnip3 | Bnip3 | autophagy‐related genes |
| P62 | 1.31 ± 0.38 | 2.97 ± 0.88* | P62 | P62 | autophagy‐related genes |
| Beclin 1 | 1.37 ± 0.33 | 1.38 ± 0.55 | Beclin 1 | Beclin 1 | autophagy‐related genes |
| Ampd3 | 1.17 ±0.17 | 5.93 ± 1.12* | Ampd3 | Ampd3 | AMP deaminase gene |
| Pfkfb3 | 1.20 ± 0.55 | 2.41 ± 1.13* | Pfkfb3 | Pfkfb3 | fructose‐2,6‐bisphosphate metabolism |
| Gadd45α | 1.43 ± 0.39 | 111.72 ± 8.13* | Gadd45α | Gadd45α | DNA repair/chromatin remodelling |
| Txnl | 1.10 ± 0.10 | 2.25 ± 0.38* | Txnl | Txnl | oxidative stress related gene |
| Mt1 | 0.69 ± 0.27 | 2.60 ± 0.85* | Mt1 | Mt1 | oxidative stress related gene |
| Nrf2 | 0.94 ± 0.06 | 1.23 ± 0.18* | Nrf2 | Nrf2 | oxidative stress related gene |
| 4EBP1 | 1.30 ± 0.35 | 3.72 ± 0.89* | 4EBP1 | 4EBP1 | protein synthesis |
| Gadd34 | 1.18 ± 0.16 | 1.49 ± 0.59 | Gadd34 | Gadd34 | unfolded protein response |
| Tgif | 1.12 ± 0.10 | 4.71 ± 1.54* | Tgif | Tgif | transcription regulators Smad2/3 |
| Eif4g3P3 | 1.18 ± 0.15 | 1.66 ± 0.28* | Eif4g3P3 | Eif4g3P3 | protein synthesis |
| Maf | 1.00 ± 0.02 | 0.57 ± 0.10* | Maf | Maf | proto‐oncogene |
| Nucleolin | 0.92 ± 0.13 | 1.33 ± 0.15* | Nucleolin | Nucleolin | ribosome transcription/maturation/assembly |
| Ezh1 | 1.15 ± 0.16 | 1.53 ± 0.06* | Ezh1 | Ezh1 | maintenance of embryonic stem cell pluripotency and plasticity |
| JunB | 1.49 ± 0.46 | 5.43 ± 1.44* | JunB | JunB | proto‐oncogene |
The absolute protection of muscle mass found in fast unloaded muscles of knockout mice fits well with the protective effect observed during fasting. However, this beneficial effect is not similar to that found after denervation (Milan et al. 2015). FoxOs deletion was sparing 100% muscle mass after unloading but only 50% after denervation. Therefore, the role played by FoxOs in two different models of disuse/inactivity is different.
Interestingly, by comparing the expression of the FoxO‐dependent atrogenes, we found several peculiarities between HU and denervation. Indeed, 96% and 48% of atrophy‐related genes are under FoxO regulation during unloading and denervation, respectively (Fig. 6). Unlike denervation, the total protective effect of muscle mass obtained in HU matches with the almost total suppression of the induction of atrogenes. Therefore, the lack of FoxOs has a different impact on muscle mass during inactivity through a different regulation of atrogenes. This suggests that an interaction between FoxOs and other transcription factors or co‐activators/corepressor is critical for FoxOs recruitment on atrogenes and for their expression. Therefore, the nuclear milieu is peculiar to each atrophy condition and determines how relevant FoxOs are in the atrophy process.
This concept is in agreement with recent findings on muscle atrophy during immobilization (Senf et al. 2010) and mechanical ventilation (Smuder et al. 2015). In both studies, specific inhibition of FoxO via expression of a dominant‐negative FOXO3a was used. FoxO inhibition partially spared muscle mass of immobilized animals (Senf et al. 2010) and completely protected the diaphragm mass of mechanically ventilated animals (Smuder et al. 2015). Interestingly, despite inhibition of FoxO‐specific transcription resulted in muscle mass protection and target genes attenuation, mRNA levels of Atrogin‐1/MaFbx and Cathepsin L were found to be elevated. These findings are in line with the concept confirmed in our study using the triple FoxO1,3,4 muscle‐specific knockout (i.e. that FoxOs contribution in atrogenes expression and muscle mass protection depends on the catabolic conditions).
Because FoxO inhibition completely prevented muscle loss and weakness in HU, we can dissect which genes are rate limiting for atrophy in this model. Atrogenes under FoxOs regulation during unloading include several ubiquitin ligases (MuRF‐1, Atrogin‐1, SMART, MUSA1, FbxO31,), proteasome subunit (Psmc4, Psmd11, Psme4), the de‐ubiquitinating enzyme (USP14), the ubiquitin gene (UBC), autophagy‐related genes (LC3, Gabarapl1, Cathepsin l, Bnip3, P62, Beclin1), AMP deaminase gene (Ampd3), fructose‐2,6‐bisphosphate metabolism (Pfkfb3), DNA repair/chromatin remodeling (Gadd45α), oxidative stress related gene (Txnl, Mt1), protein synthesis (4EBP1, Eif4g3P3), unfolded protein response (Gadd34), transcription regulators Smad2/3 (Tgif), ribosome transcription/maturation/assembly (Nucleolin), maintenance of embryonic stem cell pluripotency and plasticity (Ezh1). Consistent with the role of FoxO in proteostasis, 60% of these genes are involved in protein breakdown. Indeed, our data confirm the total inhibition of the ubiquitin proteasome and autophagy lysosome systems, as revealed by protein ubiquitination and LC3B lipidation, respectively (Fig. 5), in the unloaded FoxO deficient muscles. The same effect has been observed in fasting but not in denervation (Milan et al. 2015). Therefore, just by looking at gene expression and muscle sparing it is tempting to conclude that unloading is more similar to fasting than denervation. Because both fasting and HU show a completely prevention of muscle loss the comparison of these models may further restrict the number of genes that are really required for protein breakdown. There are only 19 atrogenes completely controlled by FoxOs that are shared in unloading and fasting (Fig. 6). These 19 genes are potentially the core machinery for protein breakdown. Therefore, this subset of atrogenes might represent good drug targets for therapeutical approaches.
The idea that other as yet undescribed factors are involved in orchestrating FoxO activity and the induction of atrogenes in different catabolic conditions is emerging from the present study. However, the fact that different muscles show an heterogenous response in terms of the expression of atrogenes during HU is also a relevant phenomenon. Considering the percentage of atrogenes under FoxOs regulation in GS and TA (96% and 88%, respectively) following HU, it appears that, even among different muscles within the same disuse model, there are differences and therefore, other alternative regulators might be involved (Fig. 7 B,C). Our data, however, do not allow us to rule out that differences found between muscles could also depend on a different time course of gene expression changes between different muscles.
The diversity among muscles also concerns the novel ubiquitin ligases MUSA1, SMART, Fbxo31 and Itch that were recently found to be upregulated in fasting and denervation (Sartori et al. 2013; Milan et al. 2015) and critical for protein ubiquitination and muscle loss, and were also found differently expressed in different unloaded muscles (Table 3). For example, MUSA was inducted by disuse in Sol and GS but not in TA, Itch only in TA, SMART in GS and TA but not in Sol. Importantly, the upregulation of all these genes was completely blunted by the absence of FoxOs in all of the different muscles. These findings strongly support the idea of a nuclear environment that is peculiar to each muscle within the same atrophic condition and is permissive for FoxO recruitment on target promoters.
Because we have recently demonstrated that genes involved in energy production can influence the maintenance of muscle mass triggering protein breakdown through FoxO3 activation (Sandri et al. 2006; Cannavino et al. 2014; Cannavino et al. 2015), we have analysed these factors in the FoxO knockout mice. In accordance with our previous findings on the effect of HU on fast muscles (Irrcher et al. 2008; Cannavino et al. 2015), unloaded GS and TA expressed a normal PGC1α level. This expression is probably maintained during unloading by the activation of AMPK and ACC (Fig. 7), kinases, which have been implicated in PGC1α transcriptional response to various stimuli (Irrcher et al. 2008). Interestingly, the unloaded muscles of conditional knockout mice showed lower PGC1α levels than the ground mice. This decrease of PGC1a should favour muscle atrophy (Desaphy et al. 2010; Cannavino et al. 2014). However, the fall in PGC1α in the absence of FoxOs did not exert any atrophic effect during unloading, suggesting that FoxOs are the master factors of muscle loss.
Moreover, regarding protein synthesis, and in agreement with our previous study (Pellegrino et al. 2011 b), we have not found a big effect of disuse on protein synthesis pathway in the GS of WT mice at 3 days HU (Fig. 7 A). TA instead showed a significant alteration in the phosphorylation states of the anabolic pathway in WT HU3 mice (Fig. 7 E). This is in line with the concept that protein synthesis regulation differs among muscle types (Hornberger et al. 2001). Indeed, several lines of evidence indicate a decrease, an increase or no change in protein synthesis in fast muscles in different disuse models, including HU (Hornberger et al. 2001; Krawiec et al. 2005; Glynn et al. 2010; Liu et al. 2012). The lack of FoxOs did not prevent the decrease of S6 and 4EBP1 phosphorylation level in the TA, suggesting that muscle mass protection is mainly a result of the catabolic systems inhibition.
In conclusion, the present study provides important evidence for understanding the mechanism regulating the atrophic programme among different catabolic conditions, in particular regarding the contribution of the FoxOs family in the expression of atrogenes and muscle mass protection. Our findings clearly indicate that FoxOs play different roles in different catabolic conditions. In particular, we show that the FoxOs family plays a primary role in controlling muscle mass during HU and that this condition is more similar to fasting than denervation. Therefore, dissecting the molecular level of the atrophy process, as well as the similarities/dissimilarities among different catabolic conditions, is a necessary step for designing specific countermeasures to attenuate/prevent muscle loss.
Additional information
Competing interests
The authors declare that they have no competing interests.
Author contributions
MAP, MS and RB conceived and designed the experiments. LB and LT collected, analysed and interpreted data. MAP, MS, RB and CR drafted the article or revised it critically for important intellectual content. All authors made comments on the manuscript and read and approved the final version submitted for publication. All persons designated as authors qualify for authorship, and all those who qualify for authorship are listed.
Funding
This study was supported by the European Commission for the MYOAGE grant (no. 22 3576) funded under FP7 and the Italian Space Agency grant (no. I/044/11/0).
Acknowledgements
We thank Mr Luigi Guidotti for excellent technical help during all experiments related to muscle disuse.
References
- Blaauw B, Canato M, Agatea L, Toniolo L, Mammucari C, Masiero E, Abraham R, Sandri M, Schiaffino S & Reggiani C (2009). Inducible activation of Akt increases skeletal muscle mass and force without satellite cell activation. FASEB J 23, 3896–3905. [DOI] [PubMed] [Google Scholar]
- Bodine SC & Baehr LM (2014). Skeletal muscle atrophy and the E3 ubiquitin ligases MuRF1 and MAFbx/atrogin‐1. Am J Physiol Endocrinol Metab 307, E469–E484. [DOI] [PMC free article] [PubMed] [Google Scholar]
- Bodine SC, Latres E, Baumhueter S, Lai VK, Nunez L, Clarke BA, Poueymirou WT, Panaro FJ, Na E, Dharmarajan K, Pan ZQ, Valenzuela DM, DeChiara TM, Stitt TN, Yancopoulos GD & Glass DJ (2001). Identification of ubiquitin ligases required for skeletal muscle atrophy. Science 294, 1704–1708. [DOI] [PubMed] [Google Scholar]
- Bonaldo P & Sandri M (2013). Cellular and molecular mechanisms of muscle atrophy. Dis Model Mech 6, 25–39. [DOI] [PMC free article] [PubMed] [Google Scholar]
- Bottinelli R & Reggiani C (2000). Human skeletal muscle fibres: molecular and functional diversity. Prog Biophys Mol Biol 73, 195–262. [DOI] [PubMed] [Google Scholar]
- Brocca L, Pellegrino MA, Desaphy JF, Pierno S, Camerino DC & Bottinelli R (2010). Is oxidative stress a cause or consequence of disuse muscle atrophy in mice? A proteomic approach in hindlimb‐unloaded mice. Exp Physiol 95, 331–350. [DOI] [PubMed] [Google Scholar]
- Cannavino J, Brocca L, Sandri M, Bottinelli R & Pellegrino MA (2014). PGC1‐alpha over‐expression prevents metabolic alterations and soleus muscle atrophy in hindlimb unloaded mice. J Physiol 592, 4575–4589. [DOI] [PMC free article] [PubMed] [Google Scholar]
- Cannavino J, Brocca L, Sandri M, Grassi B, Bottinelli R & Pellegrino MA (2015). The role of alterations in mitochondrial dynamics and PGC‐1alpha over‐expression in fast muscle atrophy following hindlimb unloading. J Physiol 593, 1981–1995. [DOI] [PMC free article] [PubMed] [Google Scholar]
- Desaphy JF, Pierno S, Liantonio A, Giannuzzi V, Digennaro C, Dinardo MM, Camerino GM, Ricciuti P, Brocca L, Pellegrino MA, Bottinelli R & Camerino DC (2010). Antioxidant treatment of hindlimb‐unloaded mouse counteracts fiber type transition but not atrophy of disused muscles. Pharmacol Res 61, 553–563. [DOI] [PubMed] [Google Scholar]
- Fanzani A, Conraads VM, Penna F & Martinet W (2012). Molecular and cellular mechanisms of skeletal muscle atrophy: an update. J Cachexia Sarcopenia Muscle 3, 163–179. [DOI] [PMC free article] [PubMed] [Google Scholar]
- Glover EI, Yasuda N, Tarnopolsky MA, Abadi A & Phillips SM (2010). Little change in markers of protein breakdown and oxidative stress in humans in immobilization‐induced skeletal muscle atrophy. Appl Physiol Nutr Metab 35, 125–133. [DOI] [PubMed] [Google Scholar]
- Glynn EL, Fry CS, Drummond MJ, Dreyer HC, Dhanani S, Volpi E & Rasmussen BB (2010). Muscle protein breakdown has a minor role in the protein anabolic response to essential amino acid and carbohydrate intake following resistance exercise. Am J Physiol Regul Integr Comp Physiol 299, R533–R540. [DOI] [PMC free article] [PubMed] [Google Scholar]
- Grundy D (2015). Principles and standards for reporting animal experiments in The Journal of Physiology and Experimental Physiology . J Physiol 593, 2547–2549. [DOI] [PMC free article] [PubMed] [Google Scholar]
- Hornberger TA, Hunter RB, Kandarian SC & Esser KA (2001). Regulation of translation factors during hindlimb unloading and denervation of skeletal muscle in rats. Am J Physiol Cell Physiol 281, C179–C187. [DOI] [PubMed] [Google Scholar]
- Irrcher I, Ljubicic V, Kirwan AF & Hood DA (2008). AMP‐activated protein kinase‐regulated activation of the PGC‐1alpha promoter in skeletal muscle cells. PLoS ONE 3, e3614. [DOI] [PMC free article] [PubMed] [Google Scholar]
- Krawiec BJ, Frost RA, Vary TC, Jefferson LS & Lang CH (2005). Hindlimb casting decreases muscle mass in part by proteasome‐dependent proteolysis but independent of protein synthesis. Am J Physiol Endocrinol Metab 289, E969–E980. [DOI] [PubMed] [Google Scholar]
- Laemmli UK (1970). Cleavage of structural proteins during the assembly of the head of bacteriophage T4. Nature 227, 680–685. [DOI] [PubMed] [Google Scholar]
- Lecker SH, Jagoe RT, Gilbert A, Gomes M, Baracos V, Bailey J, Price SR, Mitch WE & Goldberg AL (2004). Multiple types of skeletal muscle atrophy involve a common program of changes in gene expression. FASEB J 18, 39–51. [DOI] [PubMed] [Google Scholar]
- Liu H, Blough ER, Arvapalli R, Wang Y, Reiser PJ, Paturi S, Katta A, Harris R, Nepal N & Wu M (2012). Regulation of contractile proteins and protein translational signaling in disused muscle. Cell Physiol Biochem 30, 1202–1214. [DOI] [PubMed] [Google Scholar]
- Mammucari C, Milan G, Romanello V, Masiero E, Rudolf R, Del Piccolo P, Burden SJ, Di Lisi R, Sandri C, Zhao J, Goldberg AL, Schiaffino S & Sandri M (2007). FoxO3 controls autophagy in skeletal muscle in vivo. Cell Metab 6, 458–471. [DOI] [PubMed] [Google Scholar]
- Masiero E, Agatea L, Mammucari C, Blaauw B, Loro E, Komatsu M, Metzger D, Reggiani C, Schiaffino S & Sandri M (2009). Autophagy is required to maintain muscle mass. Cell Metab 10, 507–515. [DOI] [PubMed] [Google Scholar]
- Milan G, Romanello V, Pescatore F, Armani A, Paik JH, Frasson L, Seydel A, Zhao J, Abraham R, Goldberg AL, Blaauw B, DePinho RA & Sandri M (2015). Regulation of autophagy and the ubiquitin‐proteasome system by the FoxO transcriptional network during muscle atrophy. Nat Commun 6, 6670. [DOI] [PMC free article] [PubMed] [Google Scholar]
- Pellegrino MA, Desaphy JF, Brocca L, Pierno S, Camerino DC & Bottinelli R (2011. a). Redox homeostasis, oxidative stress and disuse muscle atrophy. J Physiol 589, 2147–2160. [DOI] [PMC free article] [PubMed] [Google Scholar]
- Pellegrino MA, Desaphy JF, Brocca L, Pierno S, Camerino DC & Bottinelli R (2011. b). Redox homeostasis, oxidative stress and disuse muscle atrophy. J Physiol 589, 2147–2160. [DOI] [PMC free article] [PubMed] [Google Scholar]
- Ruas JL, White JP, Rao RR, Kleiner S, Brannan KT, Harrison BC, Greene NP, Wu J, Estall JL, Irving BA, Lanza IR, Rasbach KA, Okutsu M, Nair KS, Yan Z, Leinwand LA & Spiegelman BM (2012). A PGC‐1α isoform induced by resistance training regulates skeletal muscle hypertrophy. Cell 151, 1319–1331. [DOI] [PMC free article] [PubMed] [Google Scholar]
- Sandri M (2008). Signaling in muscle atrophy and hypertrophy. Physiology (Bethesda) 23, 160–170. [DOI] [PubMed] [Google Scholar]
- Sandri M (2013). Protein breakdown in muscle wasting: role of autophagy‐lysosome and ubiquitin‐proteasome. Int J Biochem Cell Biol 45, 2121–2129. [DOI] [PMC free article] [PubMed] [Google Scholar]
- Sandri M (2016). Protein breakdown in cancer cachexia. Semin Cell Dev Biol 54, 11–19. [DOI] [PubMed] [Google Scholar]
- Sandri M, Barberi L, Bijlsma AY, Blaauw B, Dyar KA, Milan G, Mammucari C, Meskers CG, Pallafacchina G, Paoli A, Pion D, Roceri M, Romanello V, Serrano AL, Toniolo L, Larsson L, Maier AB, Muñoz‐Cánoves P, A Musarò, Pende M, Reggiani C, Rizzuto R & Schiaffino S (2013). Signalling pathways regulating muscle mass in ageing skeletal muscle: the role of the IGF1‐Akt‐mTOR‐FoxO pathway. Biogerontology 14, 303–323. [DOI] [PubMed] [Google Scholar]
- Sandri M, Lin J, Handschin C, Yang W, Arany ZP, Lecker SH, Goldberg AL & Spiegelman BM (2006). PGC‐1alpha protects skeletal muscle from atrophy by suppressing FoxO3 action and atrophy‐specific gene transcription. Proc Natl Acad Sci USA 103, 16260–16265. [DOI] [PMC free article] [PubMed] [Google Scholar]
- Sartori R, Schirwis E, Blaauw B, Bortolanza S, Zhao J, Enzo E, Stantzou A, Mouisel E, Toniolo L, Ferry A, Stricker S, Goldberg AL, Dupont S, Piccolo S, Amthor H & Sandri M (2013). BMP signaling controls muscle mass. Nat Genet 45, 1309–1318. [DOI] [PubMed] [Google Scholar]
- Senf SM, Dodd SL & Judge AR (2010). FOXO signaling is required for disuse muscle atrophy and is directly regulated by Hsp70. Am J Physiol Cell Physiol 298, C38–C45. [DOI] [PMC free article] [PubMed] [Google Scholar]
- Smuder AJ, Sollanek KJ, Min K, Nelson WB & Powers SK (2015). Inhibition of forkhead boxO‐specific transcription prevents mechanical ventilation‐induced diaphragm dysfunction. Crit Care Med 43, E133–E142. [DOI] [PMC free article] [PubMed] [Google Scholar]
- Talmadge RJ, Roy RR & Edgerton VR (1996). Distribution of myosin heavy chain isoforms in non‐weight‐bearing rat soleus muscle fibers. J Appl Physiol (1985) 81, 2540–2546. [DOI] [PubMed] [Google Scholar]