

Abstract
Key points
Applications of transcranial direct current stimulation to modulate human neuroplasticity have increased in research and clinical settings.
However, the need for longer‐lasting effects, combined with marked inter‐individual variability, necessitates a deeper understanding of the relationship between stimulation parameters and physiological effects.
We systematically investigated the full DC intensity range (0.5–2.0 mA) for both anodal and cathodal tDCS in a sham‐controlled repeated measures design, monitoring changes in motor‐cortical excitability via transcranial magnetic stimulation up to 2 h after stimulation.
For both tDCS polarities, the excitability after‐effects did not linearly correlate with increasing DC intensity; effects of lower intensities (0.5, 1.0 mA) showed equal, if not greater effects in motor‐cortical excitability.
Further, while intra‐individual responses showed good reliability, inter‐individual sensitivity to TMS accounted for a modest percentage of the variance in the early after‐effects of 1.0 mA anodal tDCS, which may be of practical relevance for future optimizations.
Abstract
Contemporary non‐invasive neuromodulatory techniques, such as transcranial direct current stimulation (tDCS), have shown promising potential in both restituting impairments in cortical physiology in clinical settings, as well as modulating cognitive abilities in the healthy population. However, neuroplastic after‐effects of tDCS are highly dependent on stimulation parameters, relatively short lasting, and not expectedly uniform between individuals. The present study systematically investigates the full range of current intensity between 0.5 and 2.0 mA on left primary motor cortex (M1) plasticity, as well as the impact of individual‐level covariates on explaining inter‐individual variability. Thirty‐eight healthy subjects were divided into groups of anodal and cathodal tDCS. Five DC intensities (sham, 0.5, 1.0, 1.5 and 2.0 mA) were investigated in separate sessions. Using transcranial magnetic stimulation (TMS), 25 motor‐evoked potentials (MEPs) were recorded before, and 10 time points up to 2 h following 15 min of tDCS. Repeated‐measures ANOVAs indicated a main effect of intensity for both anodal and cathodal tDCS. With anodal tDCS, all active intensities resulted in equivalent facilitatory effects relative to sham while for cathodal tDCS, only 1.0 mA resulted in sustained excitability diminution. An additional experiment conducted to assess intra‐individual variability revealed generally good reliability of 1.0 mA anodal tDCS (ICC(2,1) = 0.74 over the first 30 min). A post hoc analysis to discern sources of inter‐individual variability confirmed a previous finding in which individual TMS SI1mV (stimulus intensity for 1 mV MEP amplitude) sensitivity correlated negatively with 1.0 mA anodal tDCS effects on excitability. Our study thus provides further insights on the extent of non‐linear intensity‐dependent neuroplastic after‐effects of anodal and cathodal tDCS.
Keywords: neuromodulation, neurophysiology, transcranial direct current stimulation, transcranial magnetic stimulation, variability
Key points
Applications of transcranial direct current stimulation to modulate human neuroplasticity have increased in research and clinical settings.
However, the need for longer‐lasting effects, combined with marked inter‐individual variability, necessitates a deeper understanding of the relationship between stimulation parameters and physiological effects.
We systematically investigated the full DC intensity range (0.5–2.0 mA) for both anodal and cathodal tDCS in a sham‐controlled repeated measures design, monitoring changes in motor‐cortical excitability via transcranial magnetic stimulation up to 2 h after stimulation.
For both tDCS polarities, the excitability after‐effects did not linearly correlate with increasing DC intensity; effects of lower intensities (0.5, 1.0 mA) showed equal, if not greater effects in motor‐cortical excitability.
Further, while intra‐individual responses showed good reliability, inter‐individual sensitivity to TMS accounted for a modest percentage of the variance in the early after‐effects of 1.0 mA anodal tDCS, which may be of practical relevance for future optimizations.
Abbreviations
- ADM
abductor digiti muscle
- M1
primary motor cortex
- MEP
motor‐evoked potential
- SI1mV
stimulus intensity for 1 mV MEP amplitude
- tDCS
transcranial direct current stimulation
- TMS
transcranial magnetic stimulation
Introduction
Development of non‐invasive methods of modulating neuroplasticity is a major ambition in clinical and cognitive neuroscience. In the last decades, tools based on electric and magnetic stimulation such as paired associative stimulation (PAS), repetitive transcranial magnetic stimulation (rTMS), theta‐burst stimulation (TBS), and transcranial direct current stimulation (tDCS) have shown potential to induce neuroplastic changes in the human motor cortex (Pascual‐Leone et al. 1994; Jennum et al. 1995; Nitsche & Paulus, 2000; Stefan et al. 2000). The latter has especially surged in recent years, owing to the non‐invasive and painless method of delivering weak direct currents to induce cortical plasticity via subthreshold neuronal membrane polarization (Nitsche & Paulus, 2001). Neuroplastic after‐effects of tDCS, as reported in most cases when in a relaxed state, are polarity dependent: anodal stimulation results in facilitation of motor cortical excitability whereas cathodal tDCS diminishes it (Nitsche & Paulus, 2000, 2001; Nitsche et al. 2003 b). Primary studies on tDCS focused on methodological and physiological aspects, uncovering the role of the N‐methyl‐d‐aspartate (NMDA) receptor and calcium channel dependency in achieving effects on motor cortical plasticity (Liebetanz et al. 2002; Nitsche et al. 2003 a, 2008; Stagg & Nitsche, 2011). Recent studies have implemented tDCS in a variety of research and clinical settings, and have shown its ability to modulate cognitive functions and improve a range of neurological and psychiatric impairments (Kuo & Nitsche, 2012; Flöel, 2014; Kuo et al. 2014; Shin et al. 2015; Woods et al. 2015).
A parallel objective has been optimizing tDCS for enhanced and prolonged effects. For anodal tDCS, our earliest studies indicated that stronger and longer stimulation tend to induce greater effects (Nitsche & Paulus, 2000, 2001). Clinical studies have since used stimulation durations up to 20–30 min with current intensities up to 2.0 mA and have achieved positive results (Boggio et al. 2009; Brunoni et al. 2013; Shekhawat et al. 2013). In the healthy population, we have shown that increasing stimulation duration or intensity have not produced concomitant physiological effects in each case. When anodal tDCS was prolonged to 26 min, after‐effects were converted into excitability diminution (Monte‐Silva et al. 2013). However, when two 13 min blocks of anodal tDCS were spaced by 20 min, after‐effects were present for up to 24 h, suggesting involvement of late‐phase long‐term potentiation (LTP) plasticity (Monte‐Silva et al. 2013). When 20 min cathodal tDCS was increased from 1.0 to 2.0 mA, after‐effects were reversed (Batsikadze et al. 2013), and in other studies, anodal tDCS at varying current intensities also resulted in a non‐linear pattern of after‐effects (Bastani & Jaberzadeh, 2013; Kidgell et al. 2013). Importantly, however, the entire range of DC intensities has not been systematically investigated, particularly in a within‐subject repeated measure design, which could uncover dosage‐dependent insights on mechanistic properties while also reliably accounting for individual effects. The need for these studies is further underscored by reported findings of inter‐individual variability (López‐Alonso et al. 2014; Wiethoff et al. 2014; Chew et al. 2015; Strube et al. 2015), possibly due in part to relevant individual covariates such as demographics, genetics, cortical anatomy, attention and/or sensitivity to stimulation (Kuo et al. 2006; Ridding & Ziemann, 2010; Labruna et al. 2015; Opitz et al. 2015).
In the following study, we systematically investigated the effects of anodal and cathodal tDCS at five current intensities (sham, 0.5, 1.0, 1.5 and 2.0 mA) on motor‐cortical plasticity, measured via changes in TMS‐induced motor evoked potentials (MEP). We hypothesized that current intensity has a non‐linear modulatory effect on neuroplasticity, as has been observed with other stimulation parameters (Monte‐Silva et al. 2010, 2013; Batsikadze et al. 2013). Moreover, we investigated a possible cause of the inter‐individual variability in response to different tDCS intensities, correlating the efficacy of tDCS with the baseline sensitivity to TMS, which was recently found to be a significant covariate (Labruna et al. 2015). Our study thus aims to advance the methodological parameters and considerations of tDCS, which are important for achieving prolonged physiological effects.
Methods
Ethical approval
The study conformed to the Declaration of Helsinki and was approved by the Medical Ethics Committee of the University of Göttingen. Each subject provided written informed consent before beginning the study, and was compensated for participation.
Subjects
Thirty‐eight healthy, non‐smoking participants (17 males, 21 females, mean age 25.80 ± 4.41 years) were recruited for the study. All subjects were right‐handed as assessed by the Edinburgh handedness inventory (Oldfield, 1971). Prior to taking part, participants underwent a medical screening to verify no history of neurological disease, medication, metal implants, and pregnancy. Each subject first took part in a preliminary TMS session to become acquainted with experiencing stimulation and understanding the study protocol. Subjects were instructed not to consume caffeine, alcohol, or engage in strenuous physical activities 24 h prior to each session to ensure a stable level of motor‐cortical excitability. Subjects were randomly allotted to receive either anodal or cathodal stimulation only over the course of the five pseudo‐randomized (uniformly distributed) experimental sessions of different intensities (sham, 0.5, 1.0, 1.5, and 2.0 mA), which were separated by at least 7 days to avoid carry‐over effects. Subjects were blinded to their group (polarity) and session (intensity) and 33 out of the 38 subjects were naïve to tDCS.
DC Stimulation of the motor cortex
Following baseline measurements of cortical excitability, participants were given 15 min of direct current stimulation through a pair of saline soaked sponges placed on the scalp and delivered through a constant‐current battery powered stimulator (neuroConn, Ilmenau, Germany). A 15 min stimulation is in the range of stimulation protocols producing polarity‐specific long‐term effects with 1 mA stimulation, without inducing late phase or converted effects, which might limit the observability of an altered impact of stimulation with larger intensity (Monte‐Silva et al. 2010, 2013). A 35 cm2 target electrode was fixed over the motor‐cortical position of the right abductor digiti muscle (ADM) as identified by TMS (electrode rotated 45 deg towards the midline, with the cable leaving from the middle of the right edge). Another larger 100 cm2 electrode was placed contralaterally over the right orbit in order to reduce the current density and also unwanted effects under this region (Nitsche et al. 2007). For all subjects, the distance on the scalp between the edges of the electrodes was at least 6 cm. To further reduce any discomfort due to the higher intensities of stimulation, a topical anaesthetic cream (EMLA, 2.5% lidocaine + 2.5% prilocaine) was pre‐applied to the scalp under the electrodes, which has been shown to effectively reduce perception of the stimulation and ensure adequate blinding (McFadden et al. 2011; Guleyupoglu et al. 2014). Based on the randomized group and session condition, anodal or cathodal tDCS at an intensity of 0.5, 1.0, 1.5 or 2.0 mA was delivered for 15 min with a 10 s ramp at the beginning and end of stimulation. For the sham condition, stimulation was delivered at 1 mA for 30 s, with a 20 s ramp. Using this procedure, subjects are not able to distinguish between real and sham tDCS (Gandiga et al. 2006; Ambrus et al. 2012). After 15 min, electrodes were removed and corticospinal excitability was monitored with TMS.
EMG monitoring of motor cortical excitability from TMS
Single pulse monophasic TMS at 0.25 Hz was delivered by a Magstim 200 magnetic stimulator (Magstim, Whiteland, UK) through a figure‐8 magnetic coil held 45° to the midline, with current flowing posterior–anterior (diameter of one winding = 70 mm, peak magnetic field = 2.2 T). Electromyography was recorded from Ag–AgCl electrodes attached to the ADM of the right hand in a belly–tendon montage. Signals were sampled at 5 kHz (CED 1401, Cambridge, UK), amplified and bandpass filtered at 2 Hz–2 kHz (Digitimer, Welwyn Garden City, UK). All EMG measures were recorded with Signal software (CED) and analysed with in‐house scripts written in Python v2.7 (stimfit library, version 0.11.5; http://www.stimfit.org/).
Experimental procedure
Experiment 1
Participants were seated comfortably in a reclined chair, with a pillow resting under the right arm. At the beginning of each session, baseline cortical excitability was measured by first inducing MEPs over the left M1 to identify the region which produced the largest MEP of the target muscle. The region was then marked and subsequent pulses for the duration of the session were delivered from this optimal position. The stimulator's intensity was adjusted to reach a peak‐to‐peak MEP amplitude of 1 mV (SI1mV), which was then used for the remaining measurements. Following a baseline measurement of 25 MEPs, 15 min of anodal or cathodal stimulation was delivered as previously described. After removal of tDCS electrodes, MEP measurements were taken immediately again in epochs of every 5 min up to 30 min after the stimulation, and then every 30 min up to 2 h after stimulation (11 total epochs) (Fig. 1).
Figure 1. Course of study.
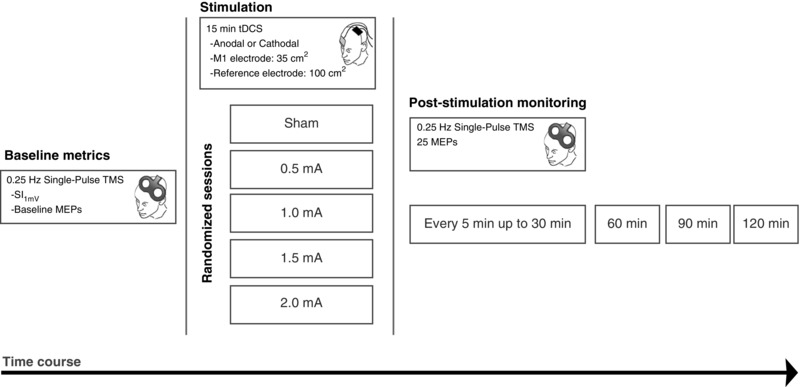
Participants were randomly divided into two groups for tDCS polarity (Anodal: n = 20; Cathodal: n = 18). Each participant took part in five randomized sessions during which either sham, 0.5, 1.0, 1.5 or 2.0 mA stimulation with the respective polarity was applied. Prior to receiving stimulation, baseline MEP amplitude and SI1mV was measured over the determined motor cortical ‘hotspot’ which produced the largest MEP from the right ADM muscle. Next, DC stimulation for 15 min was delivered, and MEP measurements were taken again from the hotspot immediately after stimulation, as well as every 5 min up to 30 min, and then every 30 min up to 2 h after stimulation.
Experiment 2
An additional control experiment was conducted to assess intra‐individual variability of 1.0 mA anodal tDCS, using the same procedures. Seven participants from the original cohort participated in two additional sessions, in which 1.0 mA tDCS was delivered for 15 min, and motor‐cortical excitability was monitored for up to 2 h following the end of stimulation. Data acquisition and subsequent analysis was repeated in the exact same manner as Experiment 1.
Data analysis and statistics
Baseline measures
To determine if individual baseline measures differed between session, SI1mV and Baseline MEP were entered as dependent variables in a repeated‐measures ANOVA with session as a within‐subject factor.
Experiment 1
The peak‐to‐peak amplitude of the 25 MEPs for each time epoch was calculated and averaged together. To obtain a time series of a subject's change in excitability over the session, the mean MEP amplitude for each measurement time epoch was normalized to the session's baseline (a quotient of the mean from the baseline mean) resulting in values representing either increased (> 1.0) or decreased (< 1.0) excitability. The normalized MEPs from each epoch were then entered as dependent variables into a two‐way repeated‐measures ANOVA, with the independent variables of intensity (5 levels) and time (10 levels) as within‐subject factors. Mauchly's test of sphericity was conducted, and Greenhouse‐Geisser correction was applied when necessary. Statistical analysis was repeated in the same manner for cathodal stimulation. In the case of significant effects, follow‐up post hoc Student's paired t tests (two‐tailed) were conducted to examine if an active intensity resulted in a significant difference relative to sham or baseline.
Experiment 2
For Experiment 2, analysis proceeded in the same manner as Experiment 1. The baseline‐normalized time series for each individual across the three repeated sessions was then grand‐averaged over two time bins: the first 30 min, relating to the early plasticity changes, and over 60–120 min, relating to the later excitability changes. Finally, intra‐individual variability was calculated for these time bins using the intra‐class correlation coefficient, ICC(2,1), to assess the absolute agreement of individual responses (Shrout & Fleiss, 1979).
Inter‐individual variability analysis
As a post hoc analysis, we investigated sources of inter‐individual variability in our dataset, which has recently been reported as a relevant issue from similar studies (López‐Alonso et al. 2014; Wiethoff et al. 2014; Strube et al. 2015). We first investigated subject‐specific baseline sensitivity to TMS (defined as percentage of maximum stimulator output (%MSO) required for the SI1mV MEP amplitude), which was recently identified as a contributing covariate that may influence subject‐level response to tDCS (Labruna et al. 2015). For direct comparison, we replicated the statistical methods by first median‐splitting our subject pool into two groups by average SI1mV (SI1mV Low and High) and conducting between‐group comparisons of the grand averaged first 30 min () and final 60–120 min (). Averaged data of each subject were entered into separate ANOVAs (five intensities), with intensity as a within‐subject factor, SI1mV group (High and Low) as a between‐subject factor, and MEPEarly epoch and MEPLate epoch as dependent variables. For significant effects and interactions, follow‐up tests were conducted using Student's unpaired t test (two‐tailed). In addition, we also calculated correlation coefficients for each intensity, using SI1mV as one variable and the grand‐average MEP as a second variable. Finally, factors of gender and age were also investigated, as these have also been previously identified in relevant brain stimulation studies (Kuo et al. 2006; Bashir et al. 2014; Wiethoff et al. 2014). These factors were analysed with the same steps, using separate ANOVAs to model the covariate interaction. Note that for the case of 1.0 mA anodal tDCS, only the first session data for each individual was used, in order to maintain homogeneity of the randomized sampling.
Statistical analysis was performed with SPSS (IBM Corp. Version 22.0). Inference testing for post hoc t tests was set to a P value of 0.05 (not corrected for multiple comparisons). Pairwise effect sizes are presented as Cohen's d. Note that effect sizes were computed based on the difference from baseline, in order to represent the relative change in post‐stimulation excitability.
Results
All subjects tolerated all intensities of stimulation, including the highest intensity of 2.0 mA. Some subjects reported an itching/tingling sensation during the beginning of the stimulation, which eventually faded away after a few minutes. In a few subjects, we observed reddening of the skin under the scalp electrode, which did not persist for longer than 60 min. Reliability of the blinding was not quantitatively assessed in the present study, although in a previous pilot study from our group, most participants were unable to distinguish between the current intensities investigated here (Ambrus et al. 2010), and local anaesthetic cream relevantly reduces tDCS‐induced sensory perceptions (McFadden et al. 2011). No other adverse effects were reported.
Descriptive statistics of demographics as well as baseline measures of motor‐cortical excitability are summarized in Table 1. An overall ANOVA indicated that baseline MEP and SI1mV did not significantly differ across sessions for either group (all values of P > 0.05; Table 2).
Table 1.
Baseline measurements and demographic factors
| Subjects | ||||||
|---|---|---|---|---|---|---|
| Experiment | Experimental session | n | Sex (M/F) | Age (years) | SI1mV (%) | Baseline MEP (mV) |
| Anodal stimulation | Sham | 20 | 10/10 | 25.7 ± 4.66 | 46.9 ± 10.01 | 1.03 ± 0.22 |
| 0.5 mA | 20 | 10/10 | 25.7 ± 4.66 | 48.28 ± 9.67 | 0.90 ± 0.23 | |
| 1.0 mA | 20 | 10/10 | 25.7 ± 4.66 | 46.76 ± 9.64 | 0.98 ± 0.22 | |
| 1.5 mA | 20 | 10/10 | 25.7 ± 4.66 | 47.67 ± 10.83 | 0.94 ± 0.17 | |
| 2.0 mA | 20 | 10/10 | 25.7 ± 4.66 | 48.19 ± 11.30 | 0.95 ± 0.27 | |
| Cathodal stimulation | Sham | 18 | 7/11 | 26.2 ± 4.72 | 44.61 ± 8.75 | 0.99 ± 0.14 |
| 0.5 mA | 18 | 7/11 | 26.2 ± 4.72 | 44.16 ± 8.77 | 0.99 ± 0.13 | |
| 1.0 mA | 18 | 7/11 | 26.2 ± 4.72 | 45.01 ± 9.01 | 0.91 ± 0.16 | |
| 1.5 mA | 18 | 7/11 | 26.2 ± 4.72 | 44.89 ± 9.49 | 1.00 ± 0.24 | |
| 2.0 mA | 18 | 7/11 | 26.2 ± 4.72 | 44.05 ± 8.96 | 0.98 ± 0.20 | |
The number of subjects for each experimental condition is listed, along with the gender distribution, the mean age, and baseline TMS metrics (± SD). SI1mV refers to the stimulus intensity required to produce an average motor evoked potential (MEP) of 1 mV. Baseline MEP refers to the average amplitude of the 25 baseline recordings. No factor differed significantly between session and experimental group.
Table 2.
Main effects analysis from ANOVAs
| Experiment | Measurement | Factor | d.f. | F value | P value |
|---|---|---|---|---|---|
| Anodal stimulation | Baseline MEP | Session | 4 | 1.608 | 0.181 |
| SI1mV | Session | 4 | 1.508 | 0.208 | |
| MEP | Intensity | 4 | 3.25 | 0.016* | |
| MEP | Time | 4.37 | 5.603 | < 0.001* | |
| MEP | Intensity × time | 9.74 | 1.384 | 0.193 | |
| Cathodal stimulation | Baseline MEP | Session | 4 | 0.826 | 0.513 |
| SI1mV | Session | 4 | 0.683 | 0.606 | |
| MEP | Intensity | 4 | 3.135 | 0.020* | |
| MEP | Time | 3.252 | 1.790 | 0.156 | |
| MEP | Intensity × time | 7.532 | 0.792 | 0.603 |
First, a one‐way ANOVA was calculated for inter‐session differences of the average baseline motor evoked potential (MEP) amplitude as well as the TMS stimulus intensity for 1 mV amplitude (SI1mV). A two‐way repeated‐measures ANOVA was calculated for main effects of stimulation intensity and post‐stimulation time on MEP size. *Significant results (where P < 0.05). Baseline MEP and SI1mV did not significantly differ across session for either experimental group. There was a main effect of intensity for both anodal and cathodal stimulation, and a main effect of time for anodal stimulation.
Intensity‐dependent effects of cortical excitability
Anodal stimulation
The overall ANOVA indicated an effect of intensity (F = 3.25, d.f. = 4, P = 0.016), and time (F = 5.603, d.f. = 4.37, P < 0.001), but no intensity × time interaction (F = 1.384, d.f. = 9.74, P = 0.193; Table 2). Post hoc comparisons to sham revealed that all active intensities of anodal tDCS resulted in a significant post‐stimulation increase in cortical excitability across most of the early (0–30 min) time epochs, but between active intensities there were no significant differences (Fig. 2 A). Sham stimulation did not result in a change of cortical excitability. A comparison of the effect sizes between the active intensities and sham across the two time bins (0–30 min and 60–120 min) revealed a generally non‐linear pattern whereby the lowest intensity of 0.5 mA and the highest intensity of 2.0 mA led to marginally greater effects during both early and late time points compared to 1.0 mA and 1.5 mA (d = 0.74 and 0.80 for 0.5 mA and 2.0 mA, respectively; Fig. 2 B).
Figure 2. Intensity‐dependent effects in motor‐cortical excitability following anodal tDCS.
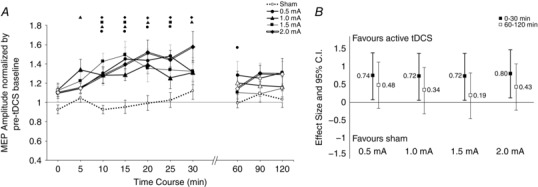
A, after‐effects of cortical excitability following 15 min of anodal stimulation at intensities ranging from sham to 2.0 mA on the mean MEP amplitude. Error bars represent standard error. Filled symbols indicate a significant difference in cortical excitability against the respective baseline (Student's paired t test, two‐tailed, P < 0.05). Floating symbols (●, 0.5; ▲, 1.0; ■, 1.5; ◆, 2.0 mA) indicate a significant difference between the active intensity and sham stimulation (paired t test, two‐tailed, P < 0.05). Anodal stimulation over all active intensities resulted in significant increases of excitability lasting up to 30 min. Sham stimulation did not induce any significant change in cortical excitability. B, effect sizes and 95% confidence intervals of active tDCS intensities versus sham. MEP amplitudes were averaged into two time bins of early (0–30 min) and late (60–120 min) excitability changes, followed by calculation of Cohen's effect size d. Error bars represent 95% confidence intervals based on the pooled variance. Differences between active intensities were generally not discernable in the first 30 min; however, 0.5 and 2.0 mA resulted in slightly larger effects, especially in the time window 60–120 min.
Cathodal stimulation
ANOVA results indicated an effect of intensity (F = 3.315, d.f. = 4, P = 0.020), but no effect of time (F = 1.790, d.f. = 3.252, P = 0.156) or intensity × time interaction (F = 0.792, d.f. = 7.532, P = 0.603; Table 2). Interestingly, we did not observe a linear trend of cortical excitability diminution; 1.5 and 2.0 mA intensities tended to return excitability to baseline values after just a few minutes following stimulation (Fig. 3 A). Sham stimulation resulted in no effect. Post hoc tests indicated only a significant effect of 1.0 mA stimulation when compared to both baseline values as well as against sham. The magnitude of the effects of 1.0 mA cathodal tDCS relative to sham was greater in the later epoch (60–120 min) compared to earlier recordings (all values of P < 0.05; d = 0.61 and 0.69 for pooled early and late time bins, respectively). Overall, only the lower intensities of 0.5 mA and 1.0 mA appeared to account for any sizable variance in MEP amplitude in the whole group analysis (Fig. 3 B).
Figure 3. Intensity‐dependent effects in motor‐cortical excitability following cathodal tDC.
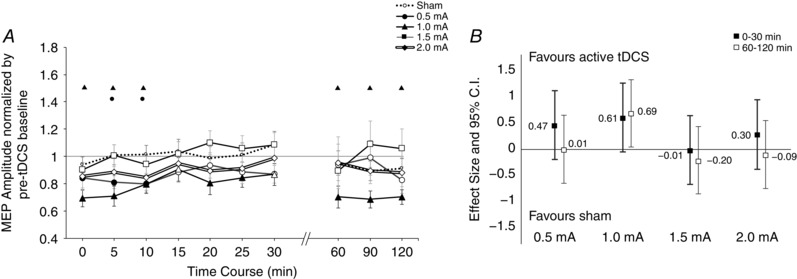
A, after‐effects of cortical excitability following 15 min of cathodal stimulation at intensities ranging from sham to 2.0 mA on the mean MEP amplitude. Error bars represent standard error. Filled symbols indicate a significant difference in cortical excitability against the respective baseline (paired t test, two‐tailed, P < 0.05). Floating symbols (●, 0.5; ▲, 1.0; ■, 1.5; ◆, 2.0 mA) indicate a significant difference between the active intensity and sham stimulation (paired t test, two‐tailed, P < 0.05). Only 0.5 mA and 1.0 mA cathodal stimulation resulted in significant differences from baseline, and only 1.0 mA was significantly different from sham during the early time bins. Higher intensities such as 1.5 and 2.0 mA (the latter is highlighted with double lines) tended to return to baseline values after about 10 min. Sham stimulation did not induce any significant change in cortical excitability. B, effect sizes and 95% confidence intervals of active tDCS intensities versus sham. MEP amplitudes were averaged into two time bins of early (0–30 min) and late (60–120 min) excitability changes, followed by calculation of Cohen's effect size d. Error bars represent 95% confidence intervals based on the pooled variance. Note that larger effects correspond to greater reduction of excitability from baseline (see Methods). Greatest differences are again seen with lower intensities of 0.5 and 1.0 mA whereas higher intensities did not result in marked changes.
Reliability and intra‐individual variability
To assess whether variability among the MEPs collected within each time point changed with tDCS intervention, we repeated the previous analysis, this time operationalizing the standard error of the mean (SEM) over the 25 MEPs at each of the 11 measurements in the session. For both anodal and cathodal tDCS, a repeated‐measures ANOVA indicated no significant effect of intensity (anodal: F = 0.372, d.f. = 2.293, P = 0.720; cathodal: F = 1.364, d.f. = 4, P = 0.256), time (anodal: F = 2.009, d.f. = 10, P = 0.154; cathodal: F = 2.839, d.f. = 10, P = 0.076), or intensity × time interaction (anodal: F = 1.166, d.f. = 10.597, P = 0.314; cathodal: F = 0.797, d.f. = 40, P = 0.811). These results indicate that within each measurement time point, variance in the collected MEPs did not significantly change as a result of tDCS or time. To assess the reliability and intra‐individual variability of the post‐stimulation cortical excitability modulation, we repeated 1.0 mA anodal tDCS in two additional sessions within a subgroup of 7 subjects. For the early epoch (first 30 min), the grand‐averaged post‐tDCS MEP response between the three sessions resulted in ICC(2,1) = 0.738, suggesting good agreement (Cicchetti, 1994). Reliability in the average MEP amplitude modulation during the late epoch (60–120 min) was also considered good, ICC(2,1) = 0.642. ICC values were also obtained for each individual time point, for means of comparison to Lopez‐Alonso et al. (2015), and in general accordance, the greatest reproducibility in cortical excitability modulation was observed during the period 15–25 min following tDCS (Fig. 4).
Figure 4. Intra‐individual response to 1.0 mA anodal tDCS.
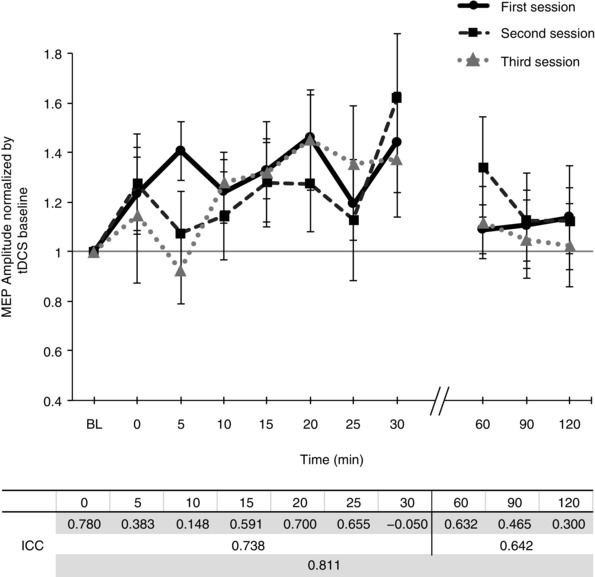
Time courses of cortical excitability, measured as MEP amplitudes normalized to baseline, in a subgroup of 7 participants across three separate sessions are shown. Error bars represent standard error. In the table below, the intra‐class correlation coefficient (ICC(2,1)) was used to assess the strength of the reliability and reproducibility of 1.0 mA anodal tDCS, at each time point (first row), as well as over first 30 min and final 60 min (second and third row, respectively).
Dependency of cortical excitability after‐effects on baseline sensitivity to TMS
Anodal stimulation
We conducted a post hoc subgroup analysis to determine if a participant's baseline sensitivity to TMS (measured as SI1mV) may explain the inter‐individual variability in the post‐stimulation response to anodal and cathodal tDCS. We first calculated, for each subject, the average SI1mV over the five sessions (note that SI1mV did not statistically differ between sessions; SD = 1.99, P > 0.05) and then split the sample by the median (anodal: 48, n = 10 per group; cathodal: 46, n = 9 per group). For the early epoch (0–30 min), an ANOVA revealed main effects for the factor intensity (F = 3.971, d.f. = 4, P = 0.006) as well as the intensity × group interaction (F = 2.820, d.f. = 4, P = 0.031; Table 4). Comparisons between groups indicated a significant between‐group difference with 1.0 mA anodal tDCS (P = 0.038, d = 0.91; Fig. 5 A and B). For the late epoch (60–120 min), we did not observe a significant effect for either a factor of intensity or an intensity × SI1mV group interaction (Table 3). We also investigated the entire data set in a continuous manner, and calculated a correlation coefficient between the SI1mV and the average MEP of the early epoch. Similarly, we observed that with 0.5 mA, the correlation between an individual's SI1mV and his/her grand‐average response to stimulation tended to be negative (Pearson's r = −0.182, P = 0.442), and at 1.0 mA, the correlation was significantly negative (r = −0.474, P = 0.035). At 1.5 mA and 2.0 mA, the correlation tended to be positive, however not statistically significant (r = 0.405, P = 0.076 and r = 0.081, P = 0.773, respectively; Fig. 7).
Table 4.
Correlation between SI1mV and MEPEarly epoch
| Pearson coefficient r | P value | ||
|---|---|---|---|
| Anodal stimulation | Sham | −0.142 | 0.551 |
| 0.5 mA | −0.182 | 0.442 | |
| 1.0 mA | −0.474 | 0.035* | |
| 1.5 mA | 0.405 | 0.076 | |
| 2.0 mA | 0.081 | 0.773 | |
| Cathodal stimulation | Sham | −0.032 | 0.900 |
| 0.5 mA | 0.354 | 0.150 | |
| 1.0 mA | −0.042 | 0.869 | |
| 1.5 mA | −0.287 | 0.248 | |
| 2.0 mA | −0.277 | 0.267 |
Pearson's correlation coefficient was calculated for each intensity using each subject's respective SI1mV as one variable and the grand‐averaged, normalized MEP from the early epoch (0–30 min post stimulation) as the second variable. A significant negative correlation was observed for 1.0 mA anodal stimulation only.
Figure 5. Differences in anodal and cathodal tDCS‐induced excitability between subjects with low and high sensitivity to TMS.
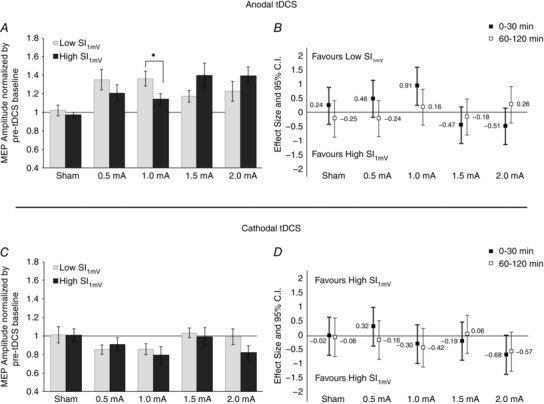
The sample was median‐split (anodal: 48%; cathodal: 46%) with ‘Low SI1mV’ consisting of participants who required less than the median value to achieve an MEP amplitude of 1 mV and ‘High SI1mV’ consisting of the rest. Pairwise comparisons (panels A and C) between subgroups of the pooled average from the first 30 min were conducted using Student's unpaired, two‐tailed t test. Error bars represent the standard error. *Significant differences between the groups (P < 0.05). Effect size comparisons (panels B and D) were conducted by calculating Cohen's d. Error bars represent 95% confidence intervals of the pooled variance. A, subjects with Low SI1mV showed significantly greater increases in 1.0 mA anodal tDCS compared to subjects with High SI1mV. Note that within the sub‐groups, 1.0 mA was not significantly better than 1.5 mA (P = 0.081) for subjects with Low SI1mV and 1.5 mA was not significantly better than 1.0 mA (P = 0.073) for the subjects with High SI1mV. B, intensity effects for the first 30 min appear to follow a trend‐wise pattern, whereby lower intensities favour subjects with Low SI1mV while higher intensities favour subjects with High SI1mV. C, a subgroup comparison of cathodal tDCS does not reveal any significant pairwise difference during the first 30 min. D, effect size comparisons (where larger effects equate to greater reduction of cortical excitability) show a marginal intensity‐dependent tendency for the lowest (0.5 mA) and highest (2.0 mA) intensity only, which also follows the same pattern as anodal tDCS.
Table 3.
Impact of known covariates on grand‐averaged MEP amplitudes
| Experiment | Measurement | Factor | d.f. | F value | P value |
|---|---|---|---|---|---|
| SI1mV | |||||
| Anodal stimulation | MEPEarly epoch | Intensity | 4 | 3.971 | 0.006* |
| MEPEarly epoch | Intensity × SI1mV | 4 | 2.820 | 0.031* | |
| MEPLate epoch | Intensity | 4 | 1.216 | 0.311 | |
| MEPLate epoch | Intensity × SI1mV | 4 | 1.453 | 0.226 | |
| Cathodal stimulation | MEPEarly epoch | Intensity | 4 | 2.765 | 0.035* |
| MEPEarly epoch | Intensity × SI1mV | 4 | 0.732 | 0.573 | |
| MEPLate epoch | Intensity | 2.581 | 2.318 | 0.098 | |
| MEPLate epoch | Intensity × SI1mV | 2.581 | 1.056 | 0.371 | |
| Age | |||||
| Anodal stimulation | MEPEarly epoch | Intensity | 4 | 3.750 | 0.008* |
| MEPEarly epoch | Intensity × age | 4 | 1.659 | 0.169 | |
| MEPLate epoch | Intensity | 4 | 1.594 | 0.185 | |
| MEPLate epoch | Intensity × age | 4 | 1.264 | 0.292 | |
| Cathodal stimulation | MEPEarly epoch | Intensity | 4 | 0.174 | 0.951 |
| MEPEarly epoch | Intensity × age | 4 | 0.151 | 0.962 | |
| MEPLate epoch | Intensity | 2.508 | 1.843 | 0.132 | |
| MEPLate epoch | Intensity × age | 2.508 | 1.998 | 0.105 | |
| Gender | |||||
| Anodal stimulation | MEPEarly epoch | Intensity | 4 | 3.529 | 0.011* |
| MEPEarly epoch | Intensity × gender | 4 | 0.504 | 0.733 | |
| MEPLate epoch | Intensity | 4 | 1.178 | 0.328 | |
| MEPLate epoch | Intensity × gender | 4 | 0.840 | 0.504 | |
| Cathodal stimulation | MEPEarly epoch | Intensity | 4 | 2.432 | 0.056 |
| MEPEarly epoch | Intensity × gender | 4 | 1.195 | 0.321 | |
| MEPLate epoch | Intensity | 2.456 | 1.881 | 0.125 | |
| MEPLate epoch | Intensity × gender | 2.456 | 0.537 | 0.625 | |
Repeated‐measures ANOVAs with the repeated factor of intensity were calculated for subject‐specific covariates of subject average baseline SI1mV (stimulus intensity for 1 mV amplitude), age, and gender, against grand averaged MEPs from time bins of either the first 0–30 min (Early epoch) or the final 60–120 min (Late epoch) after tDCS stimulation. *Significant effects (where P < 0.05). A main interaction effect was only observed for the factor of Intensity × SI1mV for the anodal stimulation group.
Figure 7. Relationship between individual TMS SI1mV sensitivity and efficacy of anodal tDCS on cortical excitability.
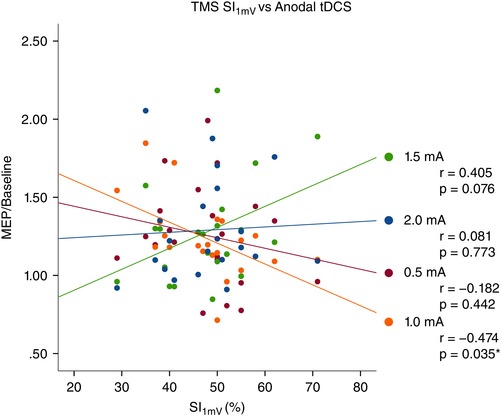
For each active anodal tDCS intensity, each individual's grand‐averaged response over 0–30 min following stimulation was plotted as a function of his/her baseline TMS SI1mV (stimulus intensity for 1 mV amplitude). A negative correlation was observed with 1.0 mA anodal tDCS (r = −0.474, P = 0.035). [Colour figure can be viewed at wileyonlinelibrary.com]
Cathodal stimulation
No significant effects were detected for the late epoch. For the early epoch, the ANOVA indicated a significant factor of intensity (F = 2.765, d.f. = 4, P = 0.035), but no significant intensity × SI1mV group interaction (F = 0.732, d.f. = 4, P = 0.573). When comparing individual intensities, we did not detect any clear pattern of an intensity‐dependent relationship (Fig. 5 C). Similarly, when the data were analysed as a continuum, Pearson's correlation coefficient was not statistically significant at any intensity of active stimulation (Table 4). A comparison of the relative effect sizes indicated that the largest between‐group differences were seen with 0.5 mA (early time bins favouring the Low SI1mV group; d = 0.32) and 2.0 mA (both early and late time bins favouring the High SI1mV group; d = −0.68 and −0.57, respectively; Fig. 5 D).
No dependency of cortical excitability on age or gender
We also investigated if variance of the post‐stimulation after‐effects may be explained by differences in gender or age by including these factors as covariates in separate ANOVAs. No interaction was observed for either age or gender (Table 3).
Discussion
In the present study, we systematically evaluated anodal and cathodal current intensities and observed generally non‐linear intensity‐dependent effects on motor cortical plasticity. Further, we observed that individual sensitivity to TMS may be an important covariate for anodal tDCS efficacy. Below, we discuss possible underlying mechanisms behind our main findings in light of previous studies in the field.
No differences between anodal stimulation intensities
Overall, higher anodal intensities did not significantly differ from lower intensities over the whole group and time course, which is in accordance with two reported studies. Kidgell et al. (2013) observed that 0.8 mA, 1.0 mA and 1.2 mA (25 cm2 electrodes, 10 min stimulation) resulted in identical excitability after‐effects as measured by MEP size as well as short‐latency intracortical inhibition (SICI), suggesting that inhibitory neurons may be non‐differentially involved in facilitating cortical excitability. Here, intracortical measures were not obtained and the intensity range was much larger; thus, the extent to which inhibitory circuits may play a role at these intensities is unclear and may be of interest in further studies. Bastani & Jaberzadeh (2013) reported uniform effects of 0.3 and 2.0 mA anodal tDCS on cortical excitability after effects (10 min duration, 24 cm2/35 cm2 target/reference electrodes), and proposed the role of voltage‐gated calcium channels driving the effect at lower current intensities, since these channels have lower voltage‐dependent thresholds compared to NMDA or α‐amino‐3‐hydroxy‐5‐methyl‐4‐isoxazolepropionic acid (AMPA) receptors, which, along with calcium channels, have been identified to be relevant for plasticity induction via tDCS (Liebetanz et al. 2002; Nitsche et al. 2003 a, 2004). Over the whole group, anodal stimulation at higher intensities did not result in significantly greater effects than lower intensities, which lends credence to the hypothesis of homeostatic counter‐regulation limiting over‐excitation as observed in similar human and animal studies (Rioult‐Pedotti et al. 2007; Pozo & Goda, 2010; Krause et al. 2013; Monte‐Silva et al. 2013). However, the lack of clearly marked differences in DC amperage in the present exploratory study should not be interpreted to mean amperage has no effect. Other tDCS parameters, such as stimulation duration and electrode montage may potentially interact with each other, possibly resulting in non‐linear effects. With regard to the electrode montage, the present study employed the conventionally used ‘M1–contralateral superior frontal orbit’ arrangement, with an enlarged reference electrode (100 cm2) as it was previously shown to reduce unwanted physiological effects, at least up to a 1.0 mA setting (Nitsche et al. 2007). Further studies would be required to compare the conventional montage with other montages which use multiple small electrodes in concentric ring arrangements, as these have been shown to induce a more focused electric field, and also result in slightly enhanced effects in motor cortical excitability (Datta et al. 2009; Kuo et al. 2013).
Reproducibility and variability of tDCS effects on cortical excitability
A recent study by Chew et al. (2015) investigating cortical excitability after M1 anodal tDCS (10 min duration, 16 cm2 target/reference electrodes) did not observe a main effect of intensity, although no sham condition was tested. Moreover, intra‐individual reliability of 0.5 mA over the 30 min following stimulation was reported to be poor (ICC(2,1) = −0.50), and it was further reported that participants responded strongly to either 0.2 mA or 2.0 mA, only. A study from Lopez‐Alonso et al. (2015) investigating 1.0 mA anodal tDCS (13 min duration, 35 cm2 target/reference electrodes) reported good intra‐individual reliability of anodal 1.0 mA tDCS over the first 30 min (ICC(2,1) = 0.565), although measurements obtained during the 30 min afterwards showed poorer reliability (ICC(2,1) = −0.028). The present findings of intra‐individual reliability in 1.0 mA anodal tDCS show stronger reliability, both over early and late measurement periods (ICC(2,1) = 0.74 and 0.64, between 0–30 and 60–120 min, respectively). The discrepancy between the present results and previous reports may possibly be due to the smaller sample size tested here (n = 7). However, we note that whereas the previous studies assessed re‐test reliability over two sessions, the present study collected data over three sessions, and over a longer period of monitoring (120 min). Previous studies have identified various possible sources of intra‐individual variability in the induced response to stimulation protocols, which include such factors as attention level, time of the day, and hormonal fluctuations (see Ridding & Ziemann, 2010 for a review). Most of these factors, however, can be controlled for with adequate sample sizes or factored into the statistical analysis if appropriately documented and reported. Another possible reason for low reliability may be due in part to elevated anxiety associated with participants naive to stimulation inducing protocols which may affect cortical excitability (Wassermann et al. 2001) (for example, due to the loud sounds and novel sensations of the stimulation, similar to elevated heart rates during the start of MRI investigations; van Minde et al. 2013). In an attempt to control for these factors, all participants in the study first attended a preliminary session to experience sensation of TMS test pulses. To further ensure stability in the motor‐cortical excitability, participants were seated in a relaxed manner in the laboratory for at least 10 min before the start of the experiment. However, the full extent of the within‐subject variation in cortical excitability, and whether our additional testing conditions were effective in reducing the non‐stability, is unknown and remains to be further probed in future studies.
In addition to intra‐individual sources of variability, it is also important to consider between‐individual sources, as they may contribute the most to the total variance (López‐Alonso et al. 2015). A previous study by Wiethoff et al. (2014) reported a correlation between anodal tDCS efficacy and the MEP latency difference between monophasic anterior–posterior induced currents and latero‐medial induced currents. The researchers thus proposed the role of early I‐wave recruitment in facilitating tDCS response, which appears to be evident in other brain stimulation protocols, such as TBS (Hamada et al. 2013). In the present study, we observed that sensitivity to TMS (SI1mV) tended to correlate with anodal tDCS efficacy in an intensity‐dependent manner. With lower intensities, participants who had relatively higher sensitivity to TMS tended to respond with greater after‐effects in excitability, a finding which was also observed in a previous report (Labruna et al. 2015). In comparison, our analysis showed the largest effect in sensitivity with 1.0 mA where the split‐group effect size was d = 0.91 and the absolute correlation between SI1mV and 1.0 mA after‐effects was r = −0.47 (i.e. 22.1% of the estimated variance explained by SI1mV, uncorrected P = 0.035; Fig. 7) which is marginally higher than the findings from Labruna et al. (2015) of 36 subjects where the 1.0 mA correlation r = −0.20 (accounting for 4% of estimated variance). One explanation for these findings could be anatomical variability affecting the path of the current into the skull. Previous TMS studies found that the TMS motor threshold correlated with the coil‐to‐cortex distance (Kozel et al. 2000; McConnell et al. 2001; Herbsman et al. 2009) and modelling studies have shown that higher tDCS intensities should induce higher electric fields in the cortex, although these may be nuanced by skull thickness and composition (Datta et al. 2012; Opitz et al. 2015). With higher tDCS intensities over 1.0 mA, it may be possible that mechanisms of homeostatic counter‐regulation may have limited the effects of tDCS for subjects with lower SI1mV, whereas subjects with higher SI1mV were in the necessary intensity range for positive effects. This hypothesis is partially supported from a group‐wise comparison of the first 30 min post‐stimulation time series of excitability changes: subjects with lower SI1mV tended to reach maximum excitability approximately 15–20 min post stimulation and then returned to baseline (in the case of 1.5 mA) or plateaued (2.0 mA) for the remainder of the monitoring (Fig. 6 C and D). Subjects with higher SI1mV, however, tended towards steadily increasing excitability. The precise mechanisms behind this delayed but increasing effect, also observed in previous reports with 2.0 mA tDCS (Batsikadze et al. 2013; Kuo et al. 2013) remain unknown and should be investigated further.
Figure 6. Inter‐individual differences in cortical excitability modulation following anodal tDCS.
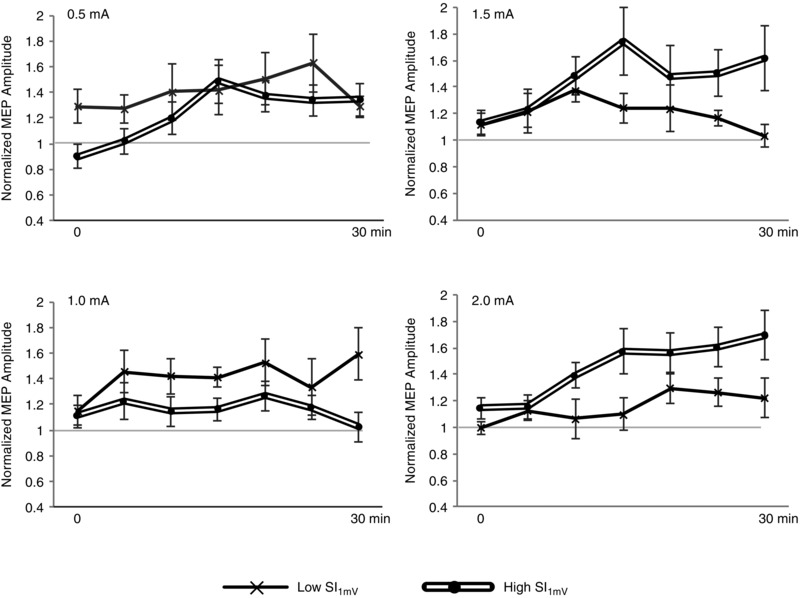
Post anodal tDCS time course (0–30 min) differences and trends between median‐split groups of low and high thresholds to TMS, based on the stimulus intensity for 1 mV amplitude (SI1mV). Error bars represent standard error. At lower intensities of 0.5 mA and 1.0 mA, subjects with lower SI1mV showed greater effects in cortical excitability facilitation whereas with higher intensities of 1.5 mA and 2.0 mA, subjects with higher SI1mV responded with a greater change in excitability compared to the Low SI1mV subjects. Notice that an upward trend of excitability facilitation was observed for subjects with higher SI1mV which was more pronounced at higher intensities, although this three‐way interaction could not be inferred as significant: F (18,1045) = 1.281, P = 0.198.
A clear association between TMS sensitivity and cathodal tDCS was not observed, possibly due to the limited range of intensities required to induce cortico‐spinal excitability diminution.
Cathodal stimulation at higher intensities reduced after‐effects
Increasing cathodal intensities did not yield greater effects. DC intensities of 0.5 mA and 1.0 mA led to excitability diminution, which was not achieved by 1.5 mA and 2.0 mA. The effects of the lower intensities are replications of results of respective previous studies of 1.0 mA cathodal tDCS (9 min duration, 35 cm2 electrodes: Nitsche et al. 2003 b; 18 min duration: Monte‐Silva et al. 2010; 20 min duration, 35 cm2/100 cm2 target/reference electrodes: Batsikadze et al. 2013) as well as one study of 0.3 mA (20 min duration 3 cm2/12 cm2 target/reference electrode: Vaseghi et al. 2015). Notably, intensities higher than 1.0 mA did not result in a reduction of cortical excitability, as has also been recently reported in similar studies. Batsikadze et al. (2013) showed that 20 min of 2.0 mA cathodal tDCS (35 cm2/100 cm2 target/reference electrodes) shifted cortical plasticity from diminution to facilitation. Wiethoff et al. (2014) investigated 10 min of 2.0 mA cathodal stimulation (35 cm2 electrodes), finding variable and ultimately non‐conclusive effects. However, another 10 min, 2.0 mA cathodal tDCS study observed a reduction in cortical excitability, where the peak effects were observed after 30–60 min (Kuo et al. 2013). In a study on adolescents, 10 min of 0.5 mA cathodal tDCS (35 cm2 electrodes) significantly decreased cortical excitability but 1.0 mA cathodal tDCS led to an increase (Moliadze et al. 2015). This study supports the general concept of non‐linear intensity‐dependent effects of cathodal tDCS. The different turning point in this specific population, as compared to adults, might be caused by anatomical or physiological differences between these age groups, which could result in a more effective stimulation of the developing brain with identical stimulation intensity. Putative hypotheses for the reversed or negated effects, which have also been observed for other brain stimulation protocols (e.g. theta‐burst stimulation: Doeltgen & Ridding, 2011; tACS, and tRNS: Moliadze et al. 2012) have pointed to the bi‐directional effects of calcium influx caused by stimulation, whereby low postsynaptic calcium causes long‐term depression and larger calcium concentrations (e.g. due to stronger stimulation intensity) result in long‐term potentiation (Cho et al. 2001; Lisman, 2001). Our findings support this concept and suggest that intensities around 1.0 mA might be optimal in inducing the strongest inhibition of motor‐cortical excitability in healthy adults.
Conclusion
Our main finding that stimulation at higher intensities does not yield correspondingly greater after‐effects partially confirms previous studies. Anodal stimulation intensities from 0.5 to 2.0 mA and cathodal stimulation of 1.0 mA resulted in significant after‐effects in excitability facilitation and diminution, respectively. Whether higher current intensities or longer stimulation duration, perhaps following intervals (Monte‐Silva et al. 2010, 2013) would produce greater or prolonged corticospinal excitability effects cannot be concluded, and should be the topic of future studies. Moreover, whether effects were localized to only the target region cannot be concluded as tDCS over the motor cortex also affects functionally connected cortical and sub‐cortical areas (Polanía et al. 2011 a, b ). Obtaining a more intricate physiological understanding of tDCS, especially when TMS may not be particularly suitable, may require other available means of investigation, such as within the neuroimaging or cognitive neuroscience domains. We also observed that inter‐individual differences in sensitivity to TMS may be an important covariate factor of anodal tDCS, but our findings require further replications with more extensive measurements. For example, our measure of sensitivity was the SI1mV, which corresponds to approximately 130–140% of the resting motor threshold (Groppa et al. 2012). A better understanding of the relationship between TMS susceptibility and tDCS efficacy would require further studies that assess the correlation of the slope as well as different points on the TMS–MEP recruitment curve with tDCS efficacy, and at different current intensities. Finally, we recognize that while the prospect of individualized stimulation protocols, based on TMS latency, sensitivity or similar metric is an intriguing concept, it is not self‐evident that the findings here, observed on a cohort of healthy and young adults, translate one‐to‐one to elderly or clinical populations. Given the results of a cathodal tDCS titration study in children and adolescents (Moliadze et al. 2015), as well as significant differences in neurotransmitter availability and corticospinal excitability across various neuropsychiatric states (Bunse et al. 2014), this is not just a theoretical limitation and requires important consideration for future studies.
Additional information
Competing interests
The authors declare no competing financial interests.
Author contributions
The experiments were conducted at the University Medical Centre, Department of Clinical Neurophysiology, Georg‐August University, Göttingen. M.A.N., W.P., G.B. and H.I.K. contributed to the conception and design of the experiment. A.J., H.I.K., G.B., L.L., A.H. and M.A.N. contributed to the collection, analysis and interpretation of the data. A.J. drafted the paper and M.A.N., G.B., H.I.K, L.L., A.H. and W.P. revised it critically for important intellectual content. All authors approved the final version of the manuscript and agree to be accountable for all aspects of the work. All persons designated as authors qualify for authorship, and all those who qualify for authorship are listed.
Funding
This work was supported by a research grant from the German Federal Ministry of Education and Research (BMBF) (grant ‘EYE‐TSS’, 03IPT605E).
Acknowledgements
We thank Dr Yuichiro Shirota for valuable comments and discussions.
References
- Ambrus GG, Al‐Moyed H, Chaieb L, Sarp L, Antal A & Paulus W (2012). The fade‐in – short stimulation – fade out approach to sham tDCS – reliable at 1 mA for naïve and experienced subjects, but not investigators. Brain Stimul 5, 499–504. [DOI] [PubMed] [Google Scholar]
- Ambrus GG, Paulus W & Antal A (2010). Cutaneous perception thresholds of electrical stimulation methods: Comparison of tDCS and tRNS. Clin Neurophysiol 121, 1908–1914. [DOI] [PubMed] [Google Scholar]
- Bashir S, Perez JM, Horvath JC, Pena‐Gomez C, Vernet M, Capia A, Alonso‐Alonso M & Pascual‐Leone A (2014). Differential effects of motor cortical excitability and plasticity in young and old individuals: A transcranial magnetic stimulation (TMS) study. Front Aging Neurosci 6, 1–13. [DOI] [PMC free article] [PubMed] [Google Scholar]
- Bastani A & Jaberzadeh S (2013). Differential modulation of corticospinal excitability by different current densities of anodal transcranial direct current stimulation. PLoS One 8, e72254. [DOI] [PMC free article] [PubMed] [Google Scholar]
- Batsikadze G, Moliadze V, Paulus W, Kuo MF & Nitsche MA (2013). Partially non‐linear stimulation intensity‐dependent effects of direct current stimulation on motor cortex excitability in humans. J Physiol 591, 1987–2000. [DOI] [PMC free article] [PubMed] [Google Scholar]
- Boggio P, Khoury L, Martins D, Martins O, de Macedo E & Fregni F (2009). Temporal cortex direct current stimulation enhances performance on a visual recognition memory task in Alzheimer disease. J Neurol Neurosurg Psychiatry 80, 444–4447. [DOI] [PubMed] [Google Scholar]
- Brunoni AR, Valiengo L, Baccaro A, Zanão TA, de Oliveira JF, Goulart A, Boggio PS, Lotufo PA, Benseñor IM & Fregni F (2013). The sertraline vs. electrical current therapy for treating depression clinical study: results from a factorial, randomized, controlled trial. JAMA Psychiatry 70, 383–391. [DOI] [PubMed] [Google Scholar]
- Bunse T, Wobrock T, Strube W, Padberg F, Palm U, Falkai P & Hasan A (2014). Motor cortical excitability assessed by transcranial magnetic stimulation in psychiatric disorders: a systematic review. Brain Stimul 7, 158–169. [DOI] [PubMed] [Google Scholar]
- Chew T, Ho K‐A & Loo CK (2015). Inter‐ and intra‐individual variability in response to transcranial direct current stimulation (tDCS) at varying current intensities. Brain Stimul 1–8. [DOI] [PubMed] [Google Scholar]
- Cho K, Aggleton JP, Brown MW & Bashir ZI (2001). An experimental test of the role of postsynaptic calcium levels in determining synaptic strength using perirhinal cortex of rat. J Physiol 532, 459–466. [DOI] [PMC free article] [PubMed] [Google Scholar]
- Cicchetti DV (1994). Guidelines, criteria, and rules of thumb for evaluating normed and standardized assessment instruments in psychology. Psychol Assess 6, 284–290. [Google Scholar]
- Datta A, Bansal V, Diaz J, Patel J, Reato D & Bikson M (2009). Gyri‐precise head model of transcranial direct current stimulation: Improved spatial focality using a ring electrode versus conventional rectangular pad. Brain Stimul 2, 201–207. [DOI] [PMC free article] [PubMed] [Google Scholar]
- Datta A, Truong D, Minhas P, Parra LC & Bikson M (2012). Inter‐individual variation during transcranial direct current stimulation and normalization of dose using MRI‐derived computational models. Front Psychiatry 3, 1–8. [DOI] [PMC free article] [PubMed] [Google Scholar]
- Doeltgen SH & Ridding MC (2011). Low‐intensity, short‐interval theta burst stimulation modulates excitatory but not inhibitory motor networks. Clin Neurophysiol 122, 1411–1416. [DOI] [PubMed] [Google Scholar]
- Flöel A (2014). TDCS‐enhanced motor and cognitive function in neurological diseases. Neuroimage 85, 934–947. [DOI] [PubMed] [Google Scholar]
- Gandiga PC, Hummel FC & Cohen LG (2006). Transcranial DC stimulation (tDCS): A tool for double‐blind sham‐controlled clinical studies in brain stimulation. Clin Neurophysiol 117, 845–850. [DOI] [PubMed] [Google Scholar]
- Groppa S, Oliviero A, Eisen A, Quartarone A, Cohen LG, Mall V, Kaelin‐Lang A, Mima T, Rossi S, Thickbroom GW, Rossini PM, Ziemann U, Valls‐Solé J & Siebner HR (2012). A practical guide to diagnostic transcranial magnetic stimulation: Report of an IFCN committee. Clin Neurophysiol 123, 858–882. [DOI] [PMC free article] [PubMed] [Google Scholar]
- Guleyupoglu B, Febles N, Minhas P, Hahn C & Bikson M (2014). Reduced discomfort during high‐definition transcutaneous stimulation using 6% benzocaine. Front Neuroeng 7, 28. [DOI] [PMC free article] [PubMed] [Google Scholar]
- Hamada M, Murase N, Hasan A, Balaratnam M & Rothwell JC (2013). The role of interneuron networks in driving human motor cortical plasticity. Cereb Cortex 23, 1593–1605. [DOI] [PubMed] [Google Scholar]
- Herbsman T, Forster L, Molnar C, Dougherty R, Christie D, Koola J, Ramsey D, Morgan PS, Bohning DE, George MS & Nahas Z (2009). Motor threshold in transcranial magnetic stimulation: The impact of white matter fiber orientation and skull‐to‐cortex distance. Hum Brain Mapp 30, 2044–2055. [DOI] [PMC free article] [PubMed] [Google Scholar]
- Jennum P, Winkel H & Fuglsang‐Frederiksen A (1995). Repetitive magnetic stimulation and motor evoked potentials. Electroencephalogr Clin Neurophysiol Mot Control 97, 96–101. [DOI] [PubMed] [Google Scholar]
- Kidgell DJ, Daly RM, Young K, Lum J, Tooley G, Jaberzadeh S, Zoghi M & Pearce AJ (2013). Different current intensities of anodal transcranial direct current stimulation do not differentially modulate motor cortex plasticity. Neural Plast 2013, 1–9. [DOI] [PMC free article] [PubMed] [Google Scholar]
- Kozel FA, Nahas ZH, DeBrux C, Molloy M, Lorberbaum JP, Bohning DE, Risch SC & George MS (2000). How coil–cortex distance relates to age, motor threshold, and antidepressant response to repetitive transcranial magnetic stimulation. J Neuropsychiatry Clin Neurosci 12, 376–384. [DOI] [PubMed] [Google Scholar]
- Krause B, Márquez‐Ruiz J & Cohen Kadosh R (2013). The effect of transcranial direct current stimulation: a role for cortical excitation/inhibition balance? Front Hum Neurosci 7, 602. [DOI] [PMC free article] [PubMed] [Google Scholar]
- Kuo H‐I, Bikson M, Datta A, Minhas P, Paulus W, Kuo M‐F & Nitsche MA (2013). Comparing cortical plasticity induced by conventional and high‐definition 4 × 1 ring tDCS: A neurophysiological study. Brain Stimul 6, 644–648. [DOI] [PubMed] [Google Scholar]
- Kuo M‐F & Nitsche MA (2012). Effects of transcranial electrical stimulation on cognition. Clin EEG Neurosci 43, 192–199. [DOI] [PubMed] [Google Scholar]
- Kuo M‐F, Paulus W & Nitsche MA (2006). Sex differences in cortical neuroplasticity in humans. Neuroreport 17, 1703–1707. [DOI] [PubMed] [Google Scholar]
- Kuo M‐F, Paulus W & Nitsche MA (2014). Therapeutic effects of non‐invasive brain stimulation with direct currents (tDCS) in neuropsychiatric diseases. Neuroimage 85, 948–960. [DOI] [PubMed] [Google Scholar]
- Labruna L, Jamil A, Fresnoza S, Batsikadze G, Kuo M‐F, Vanderschelden B, Ivry RB & Nitsche MA (2015). Efficacy of anodal transcranial direct current stimulation is related to sensitivity to transcranial magnetic stimulation. Brain Stimul 9, 8–15. [DOI] [PMC free article] [PubMed] [Google Scholar]
- Liebetanz D, Nitsche MA, Tergau F & Paulus W (2002). Pharmacological approach to the mechanisms of transcranial DC‐stimulation‐induced after‐effects of human motor cortex excitability. Brain 125, 2238–2247. [DOI] [PubMed] [Google Scholar]
- Lisman JE (2001). Three Ca2+ levels affect plasticity differently: The LTP zone, the LTD zone and no man's land. J Physiol 532, 285. [DOI] [PMC free article] [PubMed] [Google Scholar]
- López‐Alonso V, Cheeran B, Río‐Rodríguez D & Fernández‐Del‐Olmo M (2014). Inter‐individual variability in response to non‐invasive brain stimulation paradigms. Brain Stimul 7, 372–380. [DOI] [PubMed] [Google Scholar]
- López‐Alonso V, Fernández‐del‐Olmo M, Costantini A, Gonzalez‐Henriquez JJ & Cheeran B (2015). Intra‐individual variability in the response to anodal transcranial direct current stimulation. Clin Neurophysiol 126, 2342–2347. [DOI] [PubMed] [Google Scholar]
- McConnell KA, Nahas Z, Shastri A, Lorberbaum JP, Kozel FA, Bohning DE & George MS (2001). The transcranial magnetic stimulation motor threshold depends on the distance from coil to underlying cortex: A replication in healthy adults comparing two methods of assessing the distance to cortex. Biol Psychiatry 49, 454–459. [DOI] [PubMed] [Google Scholar]
- McFadden JL, Borckardt JJ, George MS & Beam W (2011). Reducing procedural pain and discomfort associated with transcranial direct current stimulation. Brain Stimul 4, 38–42. [DOI] [PMC free article] [PubMed] [Google Scholar]
- Moliadze V, Atalay D, Antal A & Paulus W (2012). Close to threshold transcranial electrical stimulation preferentially activates inhibitory networks before switching to excitation with higher intensities. Brain Stimul 5, 505–511. [DOI] [PubMed] [Google Scholar]
- Moliadze V, Schmanke T, Andreas S, Lyzhko E, Freitag CM & Siniatchkin M (2015). Stimulation intensities of transcranial direct current stimulation have to be adjusted in children and adolescents. Clin Neurophysiol 126, 1392–1399. [DOI] [PubMed] [Google Scholar]
- Monte‐Silva K, Kuo M‐F, Hessenthaler S, Fresnoza S, Liebetanz D, Paulus W & Nitsche MA (2013). Induction of late LTP‐like plasticity in the human motor cortex by repeated non‐invasive brain stimulation. Brain Stimul 6, 424–432. [DOI] [PubMed] [Google Scholar]
- Monte‐Silva K, Kuo M‐F, Liebetanz D, Paulus W & Nitsche M (2010). Shaping the optimal repetition interval for cathodal transcranial direct current stimulation (tDCS). J Neurophysiol 103, 1735–1740. [DOI] [PubMed] [Google Scholar]
- Nitsche MA, Cohen LG, Wassermann EM, Priori A, Lang N, Antal A, Paulus W, Hummel F, Boggio PS, Fregni F & Pascual‐Leone A (2008). Transcranial direct current stimulation: State of the art 2008. Brain Stimul 1, 206–223. [DOI] [PubMed] [Google Scholar]
- Nitsche MA, Doemkes S, Karakose T, Antal A, Liebetanz D, Lang N, Tergau F, Paulus W, Karaköse T, Antal A, Liebetanz D, Lang N, Tergau F & Paulus W (2007). Shaping the effects of transcranial direct current stimulation of the human motor cortex. J Neurophysiol 97, 3109–3117. [DOI] [PubMed] [Google Scholar]
- Nitsche MA, Fricke K, Henschke U, Schlitterlau A, Liebetanz D, Lang N, Henning S, Tergau F & Paulus W (2003. a). Pharmacological modulation of cortical excitability shifts induced by transcranial direct current stimulation in humans. J Physiol 553, 293–301. [DOI] [PMC free article] [PubMed] [Google Scholar]
- Nitsche MA, Liebetanz D, Schlitterlau A, Henschke U, Fricke K, Frommann K, Lang N, Henning S, Paulus W & Tergau F (2004). GABAergic modulation of DC stimulation‐induced motor cortex excitability shifts in humans. Eur J Neurosci 19, 2720–2726. [DOI] [PubMed] [Google Scholar]
- Nitsche MA, Nitsche MS, Klein CC, Tergau F, Rothwell JC & Paulus W (2003. b). Level of action of cathodal DC polarisation induced inhibition of the human motor cortex. Clin Neurophysiol 114, 600–604. [DOI] [PubMed] [Google Scholar]
- Nitsche MA & Paulus W (2000). Excitability changes induced in the human motor cortex by weak transcranial direct current stimulation. J Physiol 527, 633–639. [DOI] [PMC free article] [PubMed] [Google Scholar]
- Nitsche MA & Paulus W (2001). Sustained excitability elevations induced by transcranial DC motor cortex stimulation in humans. Neurology 57, 1899–1901. [DOI] [PubMed] [Google Scholar]
- Oldfield RC (1971). The assessment and analysis of handedness: The Edinburgh inventory. Neuropsychologia 9, 97–113. [DOI] [PubMed] [Google Scholar]
- Opitz A, Paulus W, Will A & Thielscher A (2015). Anatomical determinants of the electric field during transcranial direct current stimulation. Neuroimage 109, 2. [DOI] [PubMed] [Google Scholar]
- Pascual‐Leone A, Valls‐sole J, Wassermann EM & Hallett M (1994). Responses to rapid‐rate transcranial magnetic stimulation of the human motor cortex. Brain 117, 847–858. [DOI] [PubMed] [Google Scholar]
- Polanía R, Nitsche MA & Paulus W (2011. a). Modulating functional connectivity patterns and topological functional organization of the human brain with transcranial direct current stimulation. Hum Brain Mapp 32, 1236–1249. [DOI] [PMC free article] [PubMed] [Google Scholar]
- Polanía R, Paulus W & Nitsche MA (2011. b). Modulating cortico‐striatal and thalamo‐cortical functional connectivity with transcranial direct current stimulation. Hum Brain Mapp 32, 1236–1249. [DOI] [PMC free article] [PubMed] [Google Scholar]
- Pozo K & Goda Y (2010). Unraveling mechanisms of homeostatic synaptic plasticity. Neuron 66, 337–351. [DOI] [PMC free article] [PubMed] [Google Scholar]
- Ridding MC & Ziemann U (2010). Determinants of the induction of cortical plasticity by non‐invasive brain stimulation in healthy subjects. J Physiol 588, 2291–2304. [DOI] [PMC free article] [PubMed] [Google Scholar]
- Rioult‐Pedotti M‐S, Donoghue JP & Dunaevsky A (2007). Plasticity of the synaptic modification range. J Neurophysiol 98, 3688–3695. [DOI] [PubMed] [Google Scholar]
- Shekhawat GS, Stinear CM & Searchfield GD (2013). Transcranial direct current stimulation intensity and duration effects on tinnitus suppression. Neurorehabil Neural Repair 27, 164–172. [DOI] [PubMed] [Google Scholar]
- Shin Y‐I, Foerster Á & Nitsche MA (2015). Transcranial direct current stimulation (tDCS) – application in neuropsychology. Neuropsychologia 69, 154–175. [DOI] [PubMed] [Google Scholar]
- Shrout PE & Fleiss JL (1979). Intraclass correlations: Uses in assessing rater reliability. Psychol Bull 86, 420–428. [DOI] [PubMed] [Google Scholar]
- Stagg CJ & Nitsche MA (2011). Physiological basis of transcranial direct current stimulation. Neurosci 17, 37–53. [DOI] [PubMed] [Google Scholar]
- Stefan K, Kunesch E, Cohen LG, Benecke R & Classen J (2000). Induction of plasticity in the human motor cortex by paired associative stimulation. Brain 123, 572–584. [DOI] [PubMed] [Google Scholar]
- Strube W, Bunse T, Malchow B & Hasan A (2015). Efficacy and interindividual variability in motor‐cortex plasticity following anodal tDCS and paired‐associative stimulation. Neural Plast 2015, 1–10. [DOI] [PMC free article] [PubMed] [Google Scholar]
- van Minde D, Klaming L & Weda H (2013). Pinpointing moments of high anxiety during an MRI examination. Int J Behav Med 1–9. [DOI] [PubMed] [Google Scholar]
- Vaseghi B, Zoghi M & Jaberzadeh S (2015). Differential effects of cathodal transcranial direct current stimulation of prefrontal, motor and somatosensory cortices on cortical excitability and pain perception – a double‐blind randomised sham‐controlled study. Eur J Neurosci 42, 2426–2437. [DOI] [PubMed] [Google Scholar]
- Wassermann EM, Greenberg BD, Nguyen MB & Murphy DL (2001). Motor cortex excitability correlates with an anxiety‐related personality trait. Biol Psychiatry 50, 377–382. [DOI] [PubMed] [Google Scholar]
- Wiethoff S, Hamada M & Rothwell JC (2014). Variability in response to transcranial direct current stimulation of the motor cortex. Brain Stimul 7, 468–475. [DOI] [PubMed] [Google Scholar]
- Woods AJ, Antal A, Bikson M, Boggio PS, Brunoni AR, Celnik P, Cohen LG, Fregni F, Herrmann CS, Kappenman ES, Knotkova H, Liebetanz D, Miniussi C, Miranda PC, Paulus W, Priori A, Reato D, Stagg C, Wenderoth N & Nitsche MA (2015). A technical guide to tDCS, and related non‐invasive brain stimulation tools. Clin Neurophysiol 127, 1031–1048. [DOI] [PMC free article] [PubMed] [Google Scholar]