

Abstract
A simple, precise, selective and fast ultra-high performance liquid chromatography (UHPLC-UV) method has been developed and validated for the simultaneous determination of a lipid regulating agent fenofibrate and its metabolite fenofibric acid in rat plasma. The chromatographic separation was carried out on a reversed-phase Acquity® BEH C18 column using methanol–water (65:35, v/v) as the mobile phase. The isocratic flow was 0.3 ml/min with rapid run time of 2.5 min and UV detection was at 284 nm. The method was validated over a concentration range of 100–10000 ng/ml (r2 ⩾ 0.9993). The selectivity, specificity, recovery, accuracy and precision were validated for determination of fenofibrate/fenofibric acid in rat plasma. The lower limits of detection and quantitation of the method were 30 and 90 ng/ml for fenofibrate and 40 and 100 ng/ml for fenofibric acid, respectively. The within and between-day coefficients of variation were less than 5%. The validated method has been successfully applied to measure the plasma concentrations in pharmacokinetics study of fenofibrate in an animal model to illustrate the scope and application of the method.
Keywords: Fenofibrate, Fenofibric acid, Method validation, RP-UHPLC, Pharmacokinetics
1. Introduction
Fenofibrate (FF) is a member of fibrate class with lipid-regulating action commonly referred to as fibric acid derivative. It is chemically known as (2-[4-(4-chlorobenzoyl) phenoxy]-2-methylpropionic acid 1-methylethyl ester) (Fig.1A). It is almost white crystalline powder, which is stable under ordinary conditions with melting point 79–82°. It is virtually water insoluble (<0.3 μg/ml) but slightly soluble in alcohol and has relatively high octanol/water partition coefficient (log P 4.6) (Mohsin, 2012). FF is mainly used to reduce the amounts of low-density lipoprotein (LDL)-cholesterol, total cholesterol, triglyceride and apolipoprotein B, and increase the amounts of high-density lipoprotein (HDL)-cholesterol in the blood (Najib, 2002). Fenofibrate is a prodrug which is converted rapidly after oral administration through the hydrolysis of the ester bond to fenofibric acid.
Figure 1.
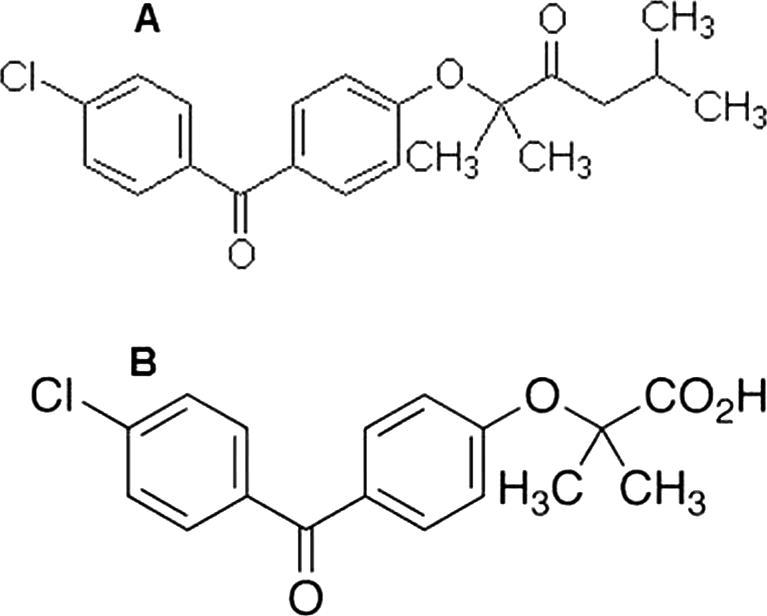
(A) Chemical structure of fenofibrate (MW: 360.8) and (B) chemical structure of fenofibric acid (MW: 318.75).
Fenofibric acid (FA) is the active metabolite of fenofibrate (FF) and chemically known as (2-[4′-(p-chlorobenzoyl) phenoxy]-2-methylpropionic acid) (Fig.1B), with mechanism of action that activate peroxisome proliferator activated receptor alpha (PPAR alpha). By this mechanism the lipolysis and elimination of triglyceride-rich particles from plasma is increased. Fenofibric acid is used along with a proper diet to help lower “bad” cholesterol and fats (such as LDL, triglycerides) and raise “good” cholesterol (HDL) in the blood. Clinically lowering triglycerides in people with very high triglyceride blood levels may decrease the risk of pancreas disease (pancreatitis) (Mohsin et al., 2009, Ratanabanangkoon et al., 2008).
In the current global health care market, FF has been remained as a blockbuster drug to satisfy the high demand (Weng et al., 2014). It is always preferable to conduct clinical research by characterizing nonhuman (animal models) pharmacokinetics for the drugs to assess and design the dose regimen for clinical trials. Many methods for analysis of FF in pharmaceutical formulations and/or in biological fluids have been reported in the literature including liquid chromatography (LC) (Masnatta et al., 1996, Wang et al., 2012), LC–Mass Spectrometry (MS) (Wabaidur, 2013), UPLC–electrospray ionization mass spectrometry (Bhavesh and Shah, 2009), and derivative spectrophotometry (Rozet et al., 2006, Trivedi et al., 2005). Only a very few HPLC methods have been reported in the literature and they were very lengthy and tedious for the estimation of FF and FA present in biological fluids (Cho and Park, 2014, Fei et al., 2013, Streel et al., 2000). Hence the author has made an attempt to develop a simple UV spectrophotometry method for the determination of FF and FA in pharmaceutical formulations.
The UHPLC method described in present manuscript allows the lower limit of quantitation of FF in rats’ plasma down to 100 ng/ml indicating the high sensitivity of the method. The key achievement of the current study is the development of a sensitive simple method based on UHPLC to quantitate the amount of active metabolite FA in rats’ plasma. The current developed method is simple, rapid, precise, reproducible and sensitive in addition to other advantages that the quantitation might be precisely performed with utilizing an internal standard.
2. Materials and methods
2.1. Chemicals and reagent
Fenofibrate and Fenofibric acid (purity of both = 99.8%) were purchased from Sigma Aldrich Company St. Louis, MO, USA. Fluvastatin (IS) was obtained from college of pharmacy, KSU, Riyadh Saudi Arabia. HPLC grade Methanol was purchased from BDH laboratory supplies (BDH Chemicals Ltd., Poole, UK). Rat plasma containing Ethylene Diamine Tetra Acetic Acid (EDTA) as anticoagulant was collected in-house which was free from HIV and Hepatitis. The high purity Milli-Q water was obtained through a Milli-Q Integral Water Purification System (Millipore, Bedford, MA). All other reagents were of analytical grade and used without further purification.
2.2. UHPLC chromatographic conditions
Chromatographic separation was developed and optimized with respect to the compositions of stationary and mobile phase, flow-rate, column temperature, sample volume, and detection wavelength. The study employed a highly sensitive UHPLC system that consisted of a Dionex® UHPLC binary solvent manager equipped with a Dionex® automatic sample manager and a Photodiode Array (PDA) eλ detector procured from Thermo scientific, Bedford, MA, USA. The mobile phase was an isocratic mixer of HPLC-grade Methanol (MeOH) and water in a ratio of 65:35%v/v. The flow rate was 0.3 ml/min delivered through an Acquity® UPLC BEH C18 column (2.1 × 50 mm, 1.7 μm) kept at 25 °C. The total run time was 2.5 min. Freshly prepared mobile phase was filtered through an online 0.20 μm filter and degassed continuously by an online degasser within the UHPLC system. The detector wavelength was set at 284 nm and the injection volume was 1.0 μl.
2.3. Preparation of stock solution and plasma sample preparation
Preparation of standard and quality control samples stock solutions of fenofibrate (FF), fenofibric acid (FA) 1 mg/ml and fluvastatin (FLV) as the IS were prepared in methanol. The stock solutions were consecutively diluted with methanol to prepare working solutions just before use. Plasma FF and FA standards were prepared by spiking 20 μl of the FF and FA working standard stock solutions into 180 μl of blank plasma resulting in plasma FF and FA standard (calibration) concentrations of 100, 250, 500, 1000, 5000, 10,000 ng/ml. A fixed amount of IS was added to each sample at a constant concentration to achieve 2500 ng/ml final concentration. Calibration curves were obtained by plotting peak area against standard drug concentration and regression equations were computed thereby. Two quality control (QC) samples for each standard with the selected concentrations LQC 250 ng/ml and HQC 5000 ng were prepared to cover the desired range.
Liquid–Liquid Extraction (LLE) procedure was used for the extraction of FF and FA from the rat plasma (Abe et al., 1998, Masnatta et al., 1996). The drug free plasma sample was transferred into a series of 1.5 ml centrifugation tubes. The standard FF and FA solutions with the fixed internal standard solutions (2500 ng/ml) were added to the plasma sample and vortexed. Plasma precipitations were carried out using methanol and vortexed to get the final concentration in the range of 100–10,000 ng/ml. The tubes were centrifuged for 10 min at 2500g. The whole supernatant (organic layer) was transferred into clean centrifuge tubes and was evaporated to dryness under nitrogen gas at 45–50 °C. Dry residues were then reconstituted in 200 μl of mobile phase, vortexed and transferred to an auto sampler vial and injected into the UHPLC analysis.
2.4. Formulation matrix effect
Direct spectrophotometric analysis of the drug compound may experience spectral overlapping between the analytes and excipients used in the dosage form, which significantly affects the method sensitivity, accuracy and precision (Abdel-Hamid et al., 2012). Therefore, it was required to perform UHPLC spectral scanning separately for both drug-containing and drug-free formulations of liquid to detect any possible interference. In the present study, the FF and FA were loaded in self emulsifying lipid based formulation from lower to higher concentrations in order to test the extent of the matrix effect. The internal standard FLV was loaded at a constant concentration in the formulation to justify the maximum possible recovery.
2.5. Method validation
The current developed method was validated according to ICH guidelines in terms of linearity, specificity, precision and accuracy, Limit of Detection (LOD) and Lower Limit of Quantification (LLOQ) according to the standard guidelines of bioanalytical method validation (Matuszewski, 2006). Method validation was carried out according to ICH guidelines [29–30] in rat plasma in order to evaluate the method for selectivity, linearity of response, accuracy, precision, recovery, limit of detection and quantification and robustness.
2.5.1. Linearity and calibration
Appropriate volumes of FF and FA stock solutions (1 mg/ml) were utilized to prepare six non-zero standard drug concentrations covering the calibration range of 100–10,000 ng/ml. Two QC samples (LQC and HQC) were prepared by spiking known concentrations of FF and FA within the detection range of 100–10,000 ng/ml. Each standard solution 100, 250, 500, 1000, 5000, 10,000 ng/ml has been injected n = 3 times daily on three consecutive days for validation. Calibration solutions were injected in ascending order in each validation run and the other samples were distributed randomly through the run. Linear regression equation and correlation coefficient (R2) were employed to statistically evaluate the linearity of the results, y = mx + b, where; y = response, m = slope, x = concentration, b = intercept.
2.5.2. Accuracy, precision and recovery
From the six FF and FA standards solutions, intra-day accuracy and precision studies were performed by using six replicates determinations within the same day. On the other hand, the inter-day accuracy and precision were also assessed by six replicates analysis during the three consecutive days of the following: low and high QC samples. The overall precision of the method was expressed as relative standard deviation (SD) as the following equation: The extraction recovery of the FF and FA from plasma and solution samples was carried out at two concentration levels lower QC (LQC = 250 ng/ml) and high QC (HQC = 5000 ng/ml) by analysis of replicate (n = 6) samples. The peak areas obtained for plasma QC samples were compared with those of analytical standards to calculate the recovery of FF and FA.
2.5.3. Limit of Detection (LOD) and Lower Limit of Quantification (LLOQ)
The LOD and LLOQ were determined efficiently by serial dilutions of the FF and FA stock solutions in order to obtain signal to noise (S/N) ratio of at least ≈3:1 for LOD and ≈10:1 for LLOQ.
2.5.4. Specificity and selectivity
Specificity and sensitivity of the method were evaluated in relation to observe any interference peaks from the different self-emulsifying lipid-based formulations and importantly from the endogenous plasma constitutes. Six individual drug free lipid formulations and blank plasma samples were compared with those obtained by spiking FF and metabolite FA and IS into the corresponding blank plasma sample to screen plasma interference. Calibration curves were generated with peak area ratios of the analytes to IS vs. concentration.
2.5.5. Robustness
The effects on the analytical results were examined by the robustness of the present method, which was evaluated with deliberate changes in the mobile phase composition. Different concentrations of methanol and water as mobile phases were used for two different calibration points (500 and 5000 ng) and % RSD of peak area was calculated (Mennickent et al., 2009).
2.5.6. Stability
The short term stability of standard and sample solutions of FF and FA was carried out by assaying the drug after 24 and 48 h at room temperature and −20 °C against fresh standard solutions. Long-term stability was evaluated after storing samples at −80 ○C for 30 days. All stability experiments were carried out against freshly spiked calibration standards.
2.6. Application to pharmacokinetic study
Healthy male Wistar rats (150–200 g) were used for the study. Animals were issued from Central Animal House Facility of King Saud University and were kept in standard plastic animal cage in groups of 6 animals with 12 h light and dark cycle at 25 ± 2 °C. The rats were fed on standard rat chow and provided water ad libitum. The animals were acclimatized to laboratory conditions for a week prior to experiments. The FA dissolved in 1% CMC-Na and administered to the rats by oral gavage (9 mg/kg). Blood samples were withdrawn from the post ocular ophthalmic vein at 0.0, 0.5, 1.0, 1.5, 3.0, 4.5, 6.0, 12.0, 24.0 and 36.0 h after oral administration. Plasma was separated from each sample by centrifugation at 2500g for 10 min and frozen at −20 °C until analysis.
The pharmacokinetic analysis was performed using PK Solver software (version 1.0). The parameters calculated were as follows: area under plasma concentration–time curve (AUC) using linear trapezoid method; volume of distribution (Vd area), where Vd area = (dose/AUC × b); and absorption rate constant (Ka), where ka = (1/MAT). The elimination rate constant (Ke) was calculated from the slope of the logarithm of the plasma concentration versus time. The apparent elimination half-life (T1/2) was calculated as 0.693/Ke. The maximum plasma concentration (Cmax) and time to maximum concentration (Tmax) after p.o administration were determined empirically directly from the time–concentration curve. Results are expressed as mean values ± SEM.
2.7. Statistical analysis
The data were expressed as mean ± standard error of mean (SEM). The significance was determined by applying one-way ANOVA. P values <0.05 were considered significant.
3. Results and discussion
3.1. Optimization of UHPLC conditions
The representative chromatographic results of blank plasma sample (Fig.2A), drug free self-emulsifying lipid formulation sample (Fig.2B), FA standard solution 1000 ng/ml (Fig.2C) FA with IS sample (Fig.2D), and FA and FF containing self-emulsifying lipid formulation (QC2) sample (Fig.2E) are shown in Fig. 2. The chromatographic results found from the current UHPLC technique showed that the FA and FF peaks were well separated in the plasma sample and ideal without any interference of the excipients used in liquid dosage form. In addition, the chromatograms in the assay confirmed that the sensitivity and selectivity of this procedure is efficient enough to determine FF within the available excipients for dosage forms. The FA analyte was well separated at the retention time of ∼0.72 min without having any interference of degradation product. The total run time was ∼2.5 min, where the peaks were of good shape and completely resolved.
Figure 2.

UHPLC chromatograms of blank plasma sample (A), drug free self-emulsifying lipid formulation sample (B), FA standard solution 1000 ng/ml (C), FA with FLV (internal standard) sample (D), and FF and FA containing self-emulsifying lipid formulation (QC2) sample (E).
3.2. Matrix effect of the formulation
The assessments of matrix effect represented an integral part of validation procedure for quantitative analysis of drug in any dosage forms within this analytical method development (Gao et al., 2011, Matuszewski et al., 2003). The matrix effects were investigated at two different concentration levels of FF and FA along with constant internal standard in self-emulsifying lipid based formulation. In the present analysis, the total FA recovery (>95%) and the overall process efficiency demonstrated that the proposed method was practically free from relative matrix effects for the determination of FF and FA in liquid dosage forms using lipid based formulation.
3.3. Method validation
3.3.1. Linearity and calibration
The peak responses of both FF and FA were linear over the concentration range between 100 and 10,000 ng/ml. Under the above described experimental conditions, the calibration curve of chromatographic peak area versus FF and FA concentrations have shown good linear dynamic range. These results showed an excellent linear method over the interval studied with correlation coefficient, FF (r2) = 0.9996 and FA (r2) = 0.9993. Slope, intercept, correlation coefficient (r2), standard deviation of slope and intercept (obtained by the linear least squares treatment of the results) are listed in Table 1. The LOD and LOQ of the method were found to be 30 and 90 ng ml−1 for FF and 40 and 100 ng ml−1 for FA, respectively.
Table 1.
Statistical regression data for the determination of FF and FA obtained from the proposed method.
| Parameters | UHPLC analysis |
|
|---|---|---|
| FF | FA | |
| Concentration range (ng/ml) | 100–10,000 | 100–10,000 |
| Intercept (a) | 0.1278 | 0.1519 |
| Slope (b) | 0.3318 | 1.7451 |
| Correlation coefficient (r) | 0.9996 | 0.9993 |
| Standard deviation of Intercept (Sa)a | 0.011 | 0.053 |
| Standard deviation of Slope (Sb)a | 0.013 | 0.098 |
| Limit of Detection (LOD)b | 0.03 | 0.04 |
| Lower Limit of Quantification (LLOQ)c | 0.09 | 0.10 |
Mean of three measurements.
Limit of detection was estimated at a signal-to-noise ratio of 3.
Limit of quantification was estimated at a signal-to-noise ratio of 10.
3.3.2. Accuracy, precision and recovery
The intra-day and inter-day accuracy studies were calculated as the percentage of drug recovery after examining six replicates of QC samples at two nominal concentration levels (250 and 5000 ng/ml). The data show that the intra-day accuracy was found in between 96.00% and 100.00% and the inter-day accuracy was in between 96.39% and 100.00% (Table 2). The overall results from the drug recovery suggest the accuracy of the assay method, which meet all the criteria as per the ICH guidelines (Q2A, 2005).
Table 2.
Evaluation of accuracy and precision of the proposed method for the simultaneous determination of FF and FA, by Inter-day and intra-day assay.
| Assay type | Amount (ng/ml) |
Precision | Accuracy (%) | Drug response | |
|---|---|---|---|---|---|
| Added | Found ± SD | ||||
| Inter day | 250 | 258.66 ± 12.05 | 4.20 | 104.20 | FF |
| 5000 | 5186 ± 268.74 | 2.16 | 105.36 | ||
| Intra day | 250 | 253 ± 7.54 | 1.50 | 97.15 | |
| 5000 | 5062.32 ± 788.83 | 2.90 | 99.48 | ||
| Inter day | 250 | 249.45 ± 4.72 | 0.86 | 97.37 | FA |
| 5000 | 5065 ± 175.81 | 4.01 | 99.12 | ||
| Intra day | 250 | 251.43 ± 7.16 | 2.63 | 101.85 | |
| 5000 | 5090.26 ± 226.30 | 3.16 | 100.15 | ||
The values present in Table 2 showed the results of intra-day and inter-day precision, respectively. The standard deviation (SD) values from the intra-day results are within the acceptable range, which indicates that the developed method was precise. In addition, within the analytical concentration range of 100–10,000 ng/ml, the coefficient of variation (CV; precision) was found to be within 1.50–4.20%. The inter-day (Table 2) SD values of six replicate determinations in three consecutive days were within the acceptable range, whereas the % CV was in between the range of 0.86% and 4.01%. These low values of both SD and CV during the intra-day and inter-day analysis suggest the current method as highly precised.
Extraction recovery of FF and FA was determined by comparing the peak areas from the extracted QC samples with unextracted standards that represent 100% recovery. LQC and HQC samples relative and absolute recovery were found to be 101.30%, 102.33%, and 89.32%, 91.29% for FF and 100.55%, 101.30%, and 90.58%, 89.65% for FA, respectively (Table 3).
Table 3.
Analytical relative/absolute recovery of FF and FA in rat plasma.
| Added conc. (ng/ml) (n = 6) | FF |
FA |
||
|---|---|---|---|---|
| Measured conc. (ng/ml) | Relative recovery (%) | Measured conc. (ng/ml) | Relative recovery (%) | |
| 250 | 252.66 ± 4.16 | 101.30 | 254.60 ± 4.33 | 100.55 |
| CV% | 1.64 | – | 1.70 | – |
| 5000 | 5113.51 ± 106.85 | 102.33 | 5167 ± 138.84 | 101.30 |
| CV% | 2.08 | – | 2.68 | – |
| Extraction recovery in plasma vs. solution | ||||
| Solution (%) | Plasma (%) | Solution (%) | Plasma (%) | |
| Absolute recovery (250 μg/ml, n = 6) | 103.69 | 89.32 | 101.69 | 90.58 |
| Absolute recovery (5000 μg/ml, n = 6) | 104.25 | 91.29 | 103.27 | 89.65 |
3.3.3. Limit of Detection (LOD) and Lower Limit of Quantification (LLOQ)
The LOQ in the assay was 100 ng/ml which estimated to be the lowest concentration in the standard curve that can be measured with acceptable accuracy and precision for the FF and FA according to ICH recommendations (Q2A, 2005) and with S/N ratio of (65.13). On the other hand, LOD was 30 ng/ml for FF and 40 ng/ml for FA with S/N ratio of 13.17 and 13.18 respectively.
3.3.4. Specificity
The specificity of the developed UHPLC method for FF and FA was studied in order to achieve an indication of the possible interferences from the degradation product(s) if present. The result in Fig.2B shows that there were no degradation products present in the FF and FA sample (% drug recovered). It suggests that FF and FA compounds can be recovered completely from the lipid formulation. Consequently, the R value in this assay can be calculated based on the availability of FF and FA peak only. In addition, there were no significant interfering peaks present at the same FF and FA retention time in the randomly selected QC samples (drug free liquid/solid self-emulsifying lipid formulation (QCzero) samples, Fig.2C). Thus the analysis indicated that FF and FA can be detected without any loss/or missing from lipid based formulations.
3.3.5. Robustness
The values of % RSD obtained for FF (0.024–1.06%) and FA (0.028–0.93%) after small changes in mobile phase compositions (methanol: water 62:38 v/v and 67:33 v/v) indicated the method was robust. There was no significant variation in slope values (P > 0.05).
3.3.6. System suitability
The system suitability was considered to estimate/settle the performance (parameters) and the highest precision of the systems. The variation (SD) in the peak area from six replicates injections was very minor, which demonstrates the system precision. The results of other chromatographic parameters such as peak tailing and theoretical plate numbers representing column efficiency are represented in Table 4. The overall analysis of the results shows the acceptable/highest performance of the system as the tailing peaks were 1.38 and 1.48 for both FF and FA, respectively along with the theoretical plates, which were not less than 2000.
Table 4.
Systems suitability parameters of FF and FA.
| System suitability parameter | Drug response |
|
|---|---|---|
| FF | FA | |
| Retention time (min) | 1.13 | 0.72 |
| Peak tailing | 1.48 | 1.38 |
| Theoretical plate number | 3845 | 4132 |
3.3.7. Stability
The freeze and thaw stability of FF and FA was determined after three freeze and thaw cycles each lasting 24 h. Quality control samples were extracted and analyzed after the third cycle (two levels in duplicate), and results were compared to the theoretical (spiked) values. The short-term stability was validated for 6 h and post-preparative stability was validated for 48 h, both at room temperature. Long-term stability was assessed after storage of the test samples at −80 °C for 30 days. All stability experiments were carried out against freshly spiked calibration standards. Results of the stability experiments were always well within ±15% of deviation, and it shows that no degradation of FF and FA occurred under the described conditions.
4. Method application: pharmacokinetic studies
The validated UHPLC method was successfully applied to a pharmacokinetic study of the active metabolite fenofibric acid in male Wistar rats. Fig. 3 shows the mean plasma concentration–time curve of fenofibric acid in single dose study is shown in Fig. 3. After administration of a single dose of 9 mg/kg fenofibric acid orally, the pharmacokinetics parameters for FA are shown in Table 5. The mean maximum plasma concentration (Cmax) was 549.39 ng/ml, and the time to reach maximum concentration (Tmax) was 6 h. The half-life (T1/2) was 29.33 h and the AUC0–t was 7329.50 ng h/ml. These parameters were in accordance with those reported in the literature (Li et al., 2009, Miller and Spence, 1998, Wang et al., 2012).
Figure 3.

Plasma concentration–time profiles of fenofibric acid after a single oral administration of fenofibrate loaded formulation to male Wistar rats at a dose equivalent to 9 mg/kg fenofibrate (mean ± SEM, n = 6).
Table 5.
Pharmacokinetic parameters of fenofibric acid in male Wistar rats.
| Pharmacokinetic parameters | Mean ± SD |
|---|---|
| Cmax (ng/ml) | 549.39 ± 29.73 |
| Tmax (h) | 6 ± 0 |
| AUC0–t (ng h/ml) | 7329.50 ± 191.40 |
| AUC0–∞ (ng h/ml) | 15059.55 ± 527.12 |
| AUMC0–t (ng h/ml) | 99970.36 ± 3035.27 |
| AUMC0–∞ (ng h/ml) | 932758.9 ± 351338.2 |
| T1/2λ (h) | 25.69 ± 1.23 |
5. Conclusion
The developed UHPLC method provides a reliable, reproducible and more specific assay for FF and FA analysis in plasma and pharmaceutical formulations. The described method is sensitive enough to detect as low as 30 ng/ml (FF) and 40 ng/ml (FA) and exclusively offers a rapid determination of FF and FA (peak at 1.13 and 0.72 min within 2.5 min run time). No significant interferences were caused by the formulation excipients, diluents and/or degradation products. The validation method allows quantification of FF and FA in pure and pharmaceutical formulations in the range between 100 and 10,000 ng/ml. Compared to previously reported methods, the present assay method assessed extensive validation parameters as per ICH guidelines. The method has shown acceptable precision, accuracy and adequate sensitivity and demands to be in use for further human studies. The established method satisfies the system suitability criteria, peak integrity, and resolution of the drug peak. The overall results clearly indicate that the current method is attractive due to the good selectivity for quantitative determination of FF and FA in self-emulsifying lipid-based formulation and also suitable for in vivo animal studies.
Acknowledgments
This project was funded by National Plan for Science, Technology and Innovation (MAARIFAH), King Abdulaziz City for Science and Technology, Kingdom of Saudi Arabia, Award Number (12MED2524-02).
Footnotes
Peer review under responsibility of King Saud University.
References
- Abdel-Hamid M., Shahba A., Mohsin K., Alanazi F. Ultra performance liquid chromatography assay for cinnarizine in lipid-based formulations. Asian J. Chem. 2012;24:595–600. [Google Scholar]
- Abe S., Ono K., Mogi M., Hayashi T. High-performance liquid chromatographic method for the determination of fenofibric acid and reduced fenofibric acid in human blood, plasma and urine. Yakugaku Zasshi. 1998;118:447–455. doi: 10.1248/yakushi1947.118.10_447. [DOI] [PubMed] [Google Scholar]
- Bhavesh D., Shah S. Determination of fenofibric acid in human plasma by ultra performance liquid chromatography–electrospray ionization mass spectrometry: application to a bioequivalence study. Biomed. Chromatogr. 2009;23:922–928. doi: 10.1002/bmc.1203. [DOI] [PubMed] [Google Scholar]
- Cho Y.D., Park Y.J. In vitro and in vivo evaluation of a self-microemulsifying drug delivery system for the poorly soluble drug fenofibrate. Arch. Pharmacal Res. 2014;37:193–203. doi: 10.1007/s12272-013-0169-4. [DOI] [PubMed] [Google Scholar]
- Fei Y., Kostewicz E.S., Sheu M.T., Dressman J.B. Analysis of the enhanced oral bioavailability of fenofibrate lipid formulations in fasted humans using an in vitro–in silico–in vivo approach. Eur. J. Pharm. Biopharm. 2013;85:1274–1284. doi: 10.1016/j.ejpb.2013.03.001. [DOI] [PubMed] [Google Scholar]
- Gao L., Li J., Kasserra C., Song Q., Arjomand A., Hesk D., Chowdhury S.K. Precision and accuracy in the quantitative analysis of biological samples by accelerator mass spectrometry: application in microdose absolute bioavailability studies. Anal. Chem. 2011;83:5607–5616. doi: 10.1021/ac2006284. [DOI] [PubMed] [Google Scholar]
- Li X., Gu L., Xu Y., Wang Y. Preparation of fenofibrate nanosuspension and study of its pharmacokinetic behavior in rats. Drug Dev. Ind. Pharm. 2009;35:827–833. doi: 10.1080/03639040802623941. [DOI] [PubMed] [Google Scholar]
- Masnatta L.D., Cuniberti L.A., Rey R.H., Werba J.P. Determination of bezafibrate, ciprofibrate and fenofibric acid in human plasma by high-performance liquid chromatography. J. Chromatogr. B Biomed. Appl. 1996;687:437–442. doi: 10.1016/s0378-4347(96)00254-x. [DOI] [PubMed] [Google Scholar]
- Matuszewski B.K. Standard line slopes as a measure of a relative matrix effect in quantitative HPLC–MS bioanalysis. J. Chromatogr., B: Anal. Technol. Biomed. Life Sci. 2006;830:293–300. doi: 10.1016/j.jchromb.2005.11.009. [DOI] [PubMed] [Google Scholar]
- Matuszewski B.K., Constanzer M.L., Chavez-Eng C.M. Strategies for the assessment of matrix effect in quantitative bioanalytical methods based on HPLC–MS/MS. Anal. Chem. 2003;75:3019–3030. doi: 10.1021/ac020361s. [DOI] [PubMed] [Google Scholar]
- Mennickent S., Fierro R., Vega M., de Diego M., Godoy C.G. Instrumental planar chromatographic method for determination of carbamazepine in human serum. J. Sep. Sci. 2009;32:1454–1458. doi: 10.1002/jssc.200800675. [DOI] [PubMed] [Google Scholar]
- Miller D.B., Spence J.D. Clinical pharmacokinetics of fibric acid derivatives (fibrates) Clin. Pharmacokinet. 1998;34:155–162. doi: 10.2165/00003088-199834020-00003. [DOI] [PubMed] [Google Scholar]
- Mohsin K. Design of lipid-based formulations for oral administration of poorly water-soluble drug fenofibrate: effects of digestion. AAPS PharmSciTech. 2012;13:637–646. doi: 10.1208/s12249-012-9787-2. [DOI] [PMC free article] [PubMed] [Google Scholar]
- Mohsin K., Long M.A., Pouton C.W. Design of lipid-based formulations for oral administration of poorly water-soluble drugs: precipitation of drug after dispersion of formulations in aqueous solution. J. Pharm. Sci. 2009;98:3582–3595. doi: 10.1002/jps.21659. [DOI] [PubMed] [Google Scholar]
- Najib J. Fenofibrate in the treatment of dyslipidemia: a review of the data as they relate to the new suprabioavailable tablet formulation. Clin. Ther. 2002;24:2022–2050. doi: 10.1016/s0149-2918(02)80095-9. [DOI] [PubMed] [Google Scholar]
- Q2A, I., (R1), 2005. Validation of analytical procedures: text and methodology. In: International Conference on Harmonization, Geneva, Switzerland.
- Ratanabanangkoon P., Guzman H., Almarsson O., Berkovitz D., Tokarcyzk S., Straughn A.B., Chen H. A high-throughput approach towards a novel formulation of fenofibrate in omega-3 oil. Eur. J. Pharm. Sci. 2008;33:351–360. doi: 10.1016/j.ejps.2008.01.005. [DOI] [PubMed] [Google Scholar]
- Rozet E. The transfer of a LC-UV method for the determination of fenofibrate and fenofibric acid in Lidoses: use of total error as decision criterion. J. Pharm. Biomed. Anal. 2006;42:64–70. doi: 10.1016/j.jpba.2005.12.037. [DOI] [PubMed] [Google Scholar]
- Streel B., Hubert P., Ceccato A. Determination of fenofibric acid in human plasma using automated solid-phase extraction coupled to liquid chromatography. J. Chromatogr. B Biomed. Sci. Appl. 2000;742:391–400. doi: 10.1016/s0378-4347(00)00195-x. [DOI] [PubMed] [Google Scholar]
- Trivedi R.K., Kallem R.R., Mullangi R., Srinivas N.R. Simultaneous determination of rosuvastatin and fenofibric acid in human plasma by LC–MS/MS with electrospray ionization: assay development, validation and application to a clinical study. J. Pharm. Biomed. Anal. 2005;39:661–669. doi: 10.1016/j.jpba.2005.05.005. [DOI] [PubMed] [Google Scholar]
- Wabaidur S.M., Mohsin K., Alothman Z.A. Development of a stability indicating UPLC–MS/MS method for rapid and reliable determination of fenofibrate in marketed product (Lypanthyl® 200M) and human plasma. J. Pharm. Drug Dev. 2013;1:1–6. [Google Scholar]
- Wang G., Guo J., Meng F., Song X., Zhong B., Zhao Y. Development of a sensitive liquid chromatography/tandem mass spectrometry method for the determination of fenofibric acid in rat plasma. Biomed. Chromatogr. 2012;26:497–501. doi: 10.1002/bmc.1693. [DOI] [PubMed] [Google Scholar]
- Weng T. The role of lipid-based nano delivery systems on oral bioavailability enhancement of fenofibrate, a BCS II drug: comparison with fast-release formulations. J. Nanobiotechnol. 2014;12:39. doi: 10.1186/s12951-014-0039-3. [DOI] [PMC free article] [PubMed] [Google Scholar]