Abstract
Primary liver cancer, the most common histologic types of which are hepatocellular carcinoma (HCC) and intrahepatic cholangiocarcinoma (ICC), is the second leading cause of cancer death worldwide. While rising incidence of liver cancer in low-risk areas and decreasing incidence in some high-risk areas has been reported, trends have not been thoroughly explored by country or by histologic type. We examined liver cancer incidence overall and by histology by calendar time and birth cohort for selected countries between 1978 and 2007. For each successive 5-year period, age-standardized incidence rates were calculated from volumes V-IX of the Cancer Incidence in Five Continents electronic database (CI5plus) and the newly released CI5X (volume X) database. Wide global variations persist in liver cancer incidence. Rates of liver cancer remain highest in Asian countries, specifically Eastern and South-Eastern Asian countries. While rates in most of these high-risk countries have been decreasing in recent years, rates in India and several low-risk countries of Africa, Europe, the Americas, and Oceania have been on the rise. Liver cancer rates by histologic type tend to convey a similar temporal profile. However, in Thailand, France, and Italy, ICC rates have increased while HCC rates have declined. We expect rates in high-risk countries to continue to decrease, as the population seroprevalence of hepatitis B virus (HBV) continues to decline. In low-risk countries, targeted screening and treatment of the hepatitis C virus (HCV), treatment of diabetes and primary prevention of obesity, will be key in reducing future liver cancer incidence.
Introduction
Primary liver cancer is the fifth most commonly occurring cancer in men, and the second most common cause of cancer mortality worldwide. However, liver cancer is less common in females. The ratio of liver cancer mortality to incidence is 0.95, indicating a very poor prognosis.1
Primary liver cancer includes hepatocellular carcinoma (HCC) and intrahepatic cholangiocarcinoma (ICC), as well as other rare types. Globally, HCC is the dominant histologic type of liver cancer in most countries accounting for approximately 80% of total cases. ICC is the second most common histologic type, accounting for approximately 15% of total cases.2 As the liver is a common site of metastasis from cancer of other organs, coding a liver tumor as a primary without histologic examination is suspect. However, liver cancer diagnoses in many countries, particularly those undergoing socio-economic development and without long-standing cancer registries, are commonly derived from clinical rather than morphological examination.3
Approximately 75% of all liver cancer arises in Asia, with China accounting for over 50% of the world’s burden. According to estimates from GLOBOCAN, the highest incidence rate in the world occurs in Mongolia, with an age-standardized rate (ASR) per 100,000 persons of 78.1 (97.8 in males and 61.1 in females). The lowest incidence rates in the world occur in Nepal, with an ASR of 0.9 (1.2 in males and 0.7 in females).1 Previous reports have noted that liver cancer incidence has been increasing in many areas of the world. However, incidence rates have declined in some Asian countries.4–7 As a follow-up to these previous evaluations, we examined international trends of liver cancer incidence overall and by histologic type for the 30-year period from 1978 through 2007. This study extends prior evaluations by combining registries within some countries for a more robust measure of country-specific incidence, examining HCC versus ICC rates in selected populations and conducting an age-period-cohort analysis to assess temporal heterogeneity as well as to better understand the key drivers of the trends.
Methods
To examine temporal trends in liver cancer incidence over the past 30 years, we utilized data from Cancer Incidence in Five Continents (CI5) Volumes V-X. The CI5 database is published every five years, from regional and national cancer registries worldwide, and contains information on cancer site, sex, age, age-specific populations, age-adjusted incidence rates, and histology, where available. The most recent data, for 2003–2007 (Volume X, CI5-X), is published in the CI5X electronic database. Data for prior volumes were obtained from CI5plus, including 1978–1982 (Volume V), 1983–1987 (Volume VI), 1988–1992 (Volume VII), 1993–1997 (Volume VIII), and 1998–2002 (Volume IX).
Registries with at least 15 consecutive years (3 volumes) of data and inclusion in the most recent volume (Volume 10) were included, as a measure of each registry’s data quality over time.8, 9 A total of 38 countries were included from Africa, Asia, Europe, the Americas, and Oceania. Of these, 15 countries contributed national data to the analysis (Costa Rica, Croatia, Czech Republic, Denmark, Estonia, Finland, Iceland, Latvia, Malta, Netherlands, New Zealand, Norway, Slovakia, Slovenia, and Sweden). Additionally, the United States contributed nationally representative data from 9 registries (Atlanta, Connecticut, Detroit, Hawaii, Iowa, New Mexico, San Francisco-Oakland, Seattle-Puget Sound, and Utah) in the Surveillance, Epidemiology, and End Results Program. For the remaining countries, regional registry data were aggregated, if available, to obtain an estimate of national incidence: Australia (New South Wales, South Australia, Tasmania, Victoria, and Western Australia), Austria (Tyrol), Brazil (Goiania), Canada (Manitoba, Nova Scotia, and Saskatchewan), China (Hong Kong and Shanghai), Colombia (Cali), Ecuador (Quinto), France (Bas-Rhin, Calvados, Doubs, and Isere), Germany (Saarland), India (Chennai and Mumbai), Israel (Jews), Italy (Parma, Ragusa Province, and Lombardy), Japan (Miyagi Prefecture, Nagasaki Prefecture, and Osaka Prefecture), Philippines (Manila), Poland (Cracow City), Russia (St. Petersburg), Singapore (Chinese and Malay), Spain (Navarra and Tarragona), Switzerland (Geneva, Neuchatel, and Vaud), Thailand (Chiang Mai), Uganda (Kyadondo County), and United Kingdom (North Western, Oxford, Birmingham and West Midlands Region, and Scotland).
Trends in primary liver cancer incidence for each country were tabulated and plotted for the period 1978–1982 through 2003–2007. Rates were age-adjusted to the world standard population using 5-year age groups.10, 11 To examine the change in age-adjusted incidence rates over time, the annual percent change (APC) and average annual percent change (AAPC) were calculated using a Joinpoint regression model of the natural log-transformed rates based on each 5-year period.12 Incidence rates were plotted at the midpoint of each 5-year time interval on a semi-log scale to facilitate comparison of temporal trends and magnitude across registries and countries.13
Age-standardized incidence rates by sex and by histology (HCC, ICC) were obtained from the CI5-X database. To examine the sex differences in incidence rates, the rates among males and females were plotted and the male:female ratio was calculated by country. HCC was identified by ICD-O morphology codes 8170–8175 and 8576, and ICC was identified by morphology codes 8050, 8140–8141, 8160–8161, 8260, 8440, 8480–8500, 8570–8572.14 As the values for the specified histology could be influenced by “unspecified” cases, we graphed the rates of HCC and ICC and reported the percentage of tumors with an “unspecified” or “other” classification for histology.
To evaluate differences by histologic type, we initially selected at least one country from each continent in which to examine rates: Australia, Canada, Costa Rica, Denmark, France, Italy, Japan, USA (Whites and Blacks), and Uganda. Age-adjusted incidence rates of HCC and ICC were plotted by calendar time. Next, we chose to examine birth cohort trends in high-risk populations in each of the respective continents (i.e., France, Italy, Japan, Thailand, and USA), with the hypothesis that cohort effects are indicative of a changing distribution of risk factors and that similar generational patterns may indicate similar etiologies among populations. Birth cohorts were obtained by subtracting the midpoints of 5-year age groups from the corresponding 1-year calendar periods. The observed incidence rates by birth cohort and age were plotted on a semi-log scale. Finally, age-period-cohort models were fitted, with the assumption that that incidence rates were constant within age classes and periods of diagnosis.15, 16 We assumed that the number of new cases followed a Poisson distribution with the offset specified as the logarithm of person-years at risk: [log(λ(a, p)) = αa + βp + γc] where λ refers to the rate, αa, βp, and γc are functions of age (a), period (p), and birth cohort (c), respectively. Using the full age-period-cohort model with incidence rate ratios presented relative to the reference cohort (1935), cohort effects were estimated. The non-identifiability inherent in age-period-cohort analyses – knowledge of the values of any two of age, period, and cohort implies knowledge of the third, making one of the factors redundant – was managed by constraining the linear component of the period effect to have zero slope (for both histologic types) in presenting the cohort effects. Solutions are entirely dependent on the allocation of the linear trend (drift); our model assumes the entire linear trend is due to generational influences given the number of individual risk factors for liver cancer. Caution should be applied when interpreting the results.
As supplementary analyses, we plotted the recent age-adjusted rates versus AAPC on an arithmetic scale. We also utilized CI5-X to examine the heterogeneity of liver cancer rates within countries, plotting the lowest and highest incidence rates by country or region.
Data management and analyses were performed using SAS statistical software (v9.3, SAS Institute Inc., Cary, NC, USA). Figures were plotted using SigmaPlot (v12.5, SY Software Inc., San Jose, CA, USA). The Joinpoint regression models were performed using the Joinpoint Regression Program (v 4.2.0, IMS, Inc., Calverton, MD, USA). The age-period-cohort model analyses and graphs were performed using APCfit in Stata (v13, StataCorp LP, College Station, TX, USA).
Results
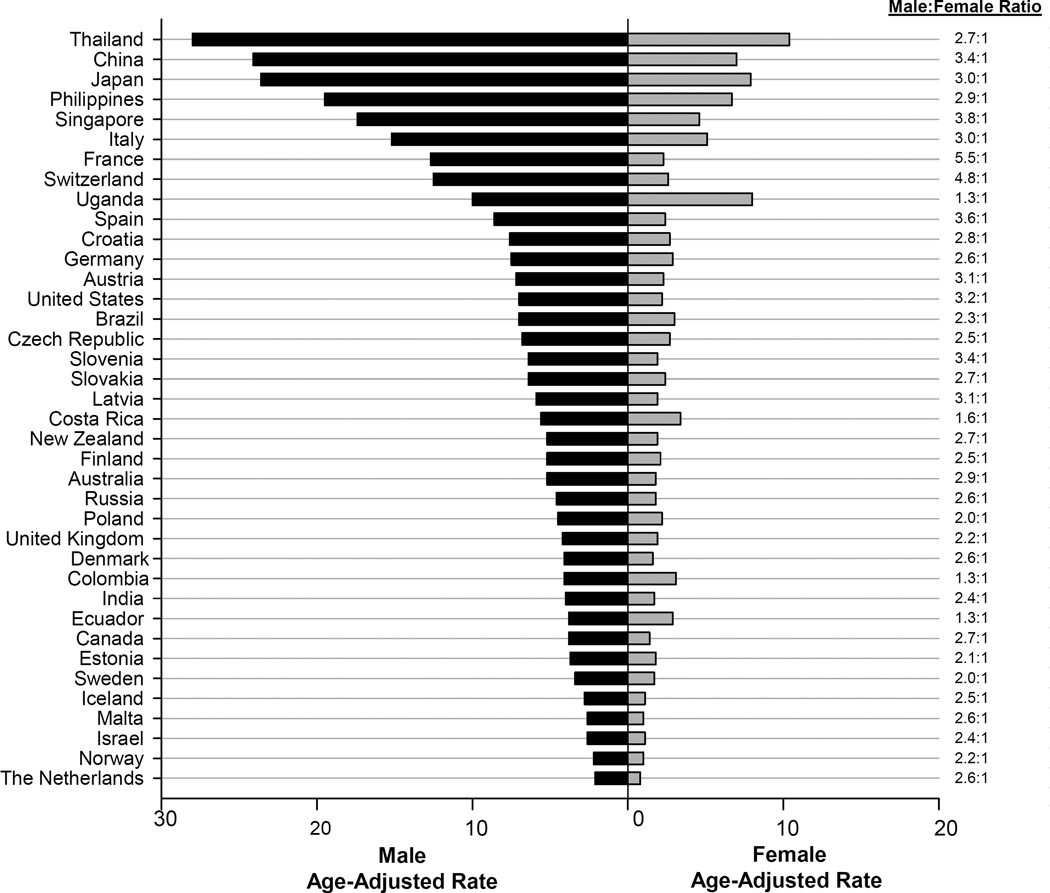
Sex disparities in incidence were observed in most countries with male rates two to three-fold higher than rates among females (Figure 1). Exceptions to this include several countries in North/South America and Africa, e.g. Costa Rica [Male:Female (M:F) ratio=1.6], Colombia (M:F ratio=1.3), Ecuador (M:F ratio=1.3), and Uganda (M:F ratio=1.3). High-risk populations did not, however, have greater sex disparity in rates than other areas (e.g., China M:F ratio=3.4). In fact, Western European countries had the greatest variability in incidence, where some countries had male rates four to five times higher than those among females (e.g., France M:F ratio=5.5 and Switzerland M:F ratio=4.8).
Figure 1.
In 2003–2007, liver cancer incidence rates were highest in Eastern and South-Eastern Asian countries and lowest in South-Western Asia and Northern European countries (Table 1 and Supplemental Table 1). In males, the highest rates occurred in Thailand (ASR=28.0), China (ASR=24.1), and Japan (ASR=23.6), with the lowest rate in the Netherlands (ASR=2.1). In females, the highest rates occurred in Thailand (ASR=10.4), Uganda (ASR=8.0), and Japan (ASR=7.9), with the lowest rates in Malta (ASR=1.0) and Norway (ASR=1.0). However, rates were heterogeneous within regions, ranging, for example, from 2.1 in the Netherlands to 12.7 in France, in men (High:Low ratio=6.0). Similarly, heterogeneity within countries was also pronounced (Supplemental Figure S8 and S9). In China, male rates ranged from 16.7 in Beijing City to 77.5 in Qidong County among men (H:L ratio=4.6).
| Population | 1978–1982 (Volume 5) | 2003– 2007 (Volume 10) | Trend 1 | Trend 2 | Joinpoint | AAPC (%) | ||||
|---|---|---|---|---|---|---|---|---|---|---|
| Cases | Rate | 95% CI | Cases | Rate | 95%CI | APC (%) |
APC (%) |
|||
| Africa | ||||||||||
| Uganda | --- | --- | --- | 177 | 10.0 | (8.0, 12.0) | 5.8 | 5.8 | ||
| Eastern Asia | ||||||||||
| China | --- | --- | --- | 12,631 | 24.1 | (23.6, 24.5) | −2.0* | −2.0* | ||
| Japan | 6,544 | 26.2 | (25.6, 26.9) | 15,798 | 23.6 | (23.2, 24.0) | 2.1 | −4.9* | 1995 | −1.2 |
| South-Eastern Asia | ||||||||||
| Philippines | --- | --- | --- | 1,686 | 19.5 | (18.5, 20.5) | −0.6* | −0.6* | ||
| Singpore | 2,196 | 27.5 | (26.4, 28.7) | 3,311 | 17.4 | (16.8, 18.0) | −3.8* | −0.5 | 1990 | −1.7* |
| Thailand | --- | --- | --- | 1,248 | 28.0 | (26.4, 29.6) | 2.8 | 2.8 | ||
| South-Western Asia | ||||||||||
| India | 435 | 3.2 | (2,8, 3.5) | 1,496 | 4.0 | (3.7, 4.1) | 1.7* | 1.7* | ||
| Israel | 292 | 2.7 | (2.3, 3.0) | 1,258 | 2.6 | (2.4, 2.8) | −1.8 | −1.8 | ||
| Central and Eastern Europe | ||||||||||
| Czech Republic | --- | --- | --- | 2,711 | 6.8 | (6.5, 7.1) | 2.6 | − 0.7 |
1995 | 0.8 |
| Poland | 81 | 4.6 | (3.5, 5.6) | 103 | 4.5 | (3.5, 5.4) | −1.3 | −1.3 | ||
| Russia | --- | --- | --- | 673 | 4.6 | (4.2, 5.0) | −0.05 | −0.05 | ||
| Slovakia | 837 | 6.0 | (5.6, 6.4) | 1,052 | 6.4 | (6.0, 6.9) | 1.7 | −0.7* | 1990 | 0.1 |
| Northern Europe | ||||||||||
| Denmark | 714 | 3.7 | (3.4, 3.9) | 947 | 4.1 | (3.9, 4.4) | 0.3 | 0.3 | ||
| Estonia | 171 | 4.5 | (3.8, 5.2) | 171 | 3.7 | (3.1, 4.2) | −0.5 | −0.5 | ||
| Finland | 497 | 3.6 | (3.3, 4.0) | 1,192 | 5.2 | (4.9, 5.5) | 1.5* | 1.5* | ||
| Iceland | 16 | 1.8 | (0.7, 3.0) | 33 | 2.8 | (1.8, 3.9) | 1.2 | 1.2 | ||
| Latvia | --- | --- | --- | 337 | 5.9 | (4.9, 6.1) | 2.3 | 2.3 | ||
| Norway | 278 | 1.8 | (1.6, 2.0) | 421 | 2.2 | (2.0, 2.5) | 0.6 | 0.6 | ||
| Sweden | 1,497 | 3.9 | (3.7, 4.1) | 1,465 | 3.4 | (3.2, 3.6) | −0.7 | −0.7 | ||
| United Kingdom | 870 | 2.0 | (1.9, 2.1) | 3,587 | 4.2 | (4.0, 4.3) | 1.4 | 4.2* | 1990 | 3.3* |
| Southern Europe | ||||||||||
| Croatia | --- | --- | --- | 1,376 | 7.6 | (7.2, 8.1) | 3.4 | 3.4 | ||
| Italy | 309 | 7.7 | (6.8, 8.6) | 1,189 | 15.2 | (14.3, 16.2) | 5.5* | −1.1 | 1995 | 2.5* |
| Malta | --- | --- | --- | 38 | 2.6 | (1.7, 3.6) | 5.1 | 5.1 | ||
| Slovenia | 145 | 2.7 | (2.3, 3.2) | 526 | 6.4 | (5.9, 7.0) | 3.4* | 3.4* | ||
| Spain | 132 | 7.8 | (6.5, 9.3) | 486 | 8.6 | (7.8, 9.4) | 1.1 | 1.1 | ||
| Western Europe | ||||||||||
| Austria | --- | --- | --- | 185 | 7.2 | (6.1, 8.3) | 3.6 | 3.6 | ||
| France | 414 | 5.7 | (5.1, 6.2) | 1,708 | 12.7 | (12.0, 13.3) | 7.1 | 0.9* | 1990 | 2.7* |
| Germany | 125 | 3.4 | (2.8, 4.0) | 394 | 7.5 | (6.8, 8.3) | 3.3* | 3.3* | ||
| The Netherlands | --- | --- | --- | 1,299 | 2.1 | (2.0, 2.2) | 1.9* | 1.9* | ||
| Switzerland | 109 | 9.6 | (7.7, 11.5) | 290 | 12.5 | (11.0, 14.0) | 1.4* | 1.4* | ||
| North America | ||||||||||
| Canada | 140 | 1.6 | (1.3,1.8) | 323 | 3.8 | (3.4, 4.2) | 3.3* | 3.3* | ||
| Costa Rica | 104 | 3.9 | (3.1, 4.7) | 505 | 5.6 | (5.1, 6.1) | −2.4 | 4.2* | 1990 | 2.5* |
| United States | 3,023 | 2.6 | (2.5, 2.7) | 12,182 | 7.0 | (6.8, 7.1) | 4.2* | 4.2* | ||
| South America | ||||||||||
| Brazil | --- | --- | --- | 139 | 7.0 | (5.8, 8.2) | 3.7 | 3.7 | ||
| Colombia | --- | --- | --- | 178 | 4.1 | (3.5, 4.8) | 2.8* | 2.8* | ||
| Ecuador | --- | --- | --- | 140 | 3.8 | (3.0, 4.6) | 3.1* | 3.1* | ||
| Oceania | ||||||||||
| Australia | 88 | 1.8 | (1.4, 2.2) | 3,134 | 5.2 | (5.1, 5.4) | 4.7* | 4.7* | ||
| New Zealand | --- | --- | --- | 1,476 | 5.2 | (4.9, 5.4) | 3.4* | 3.4* | ||
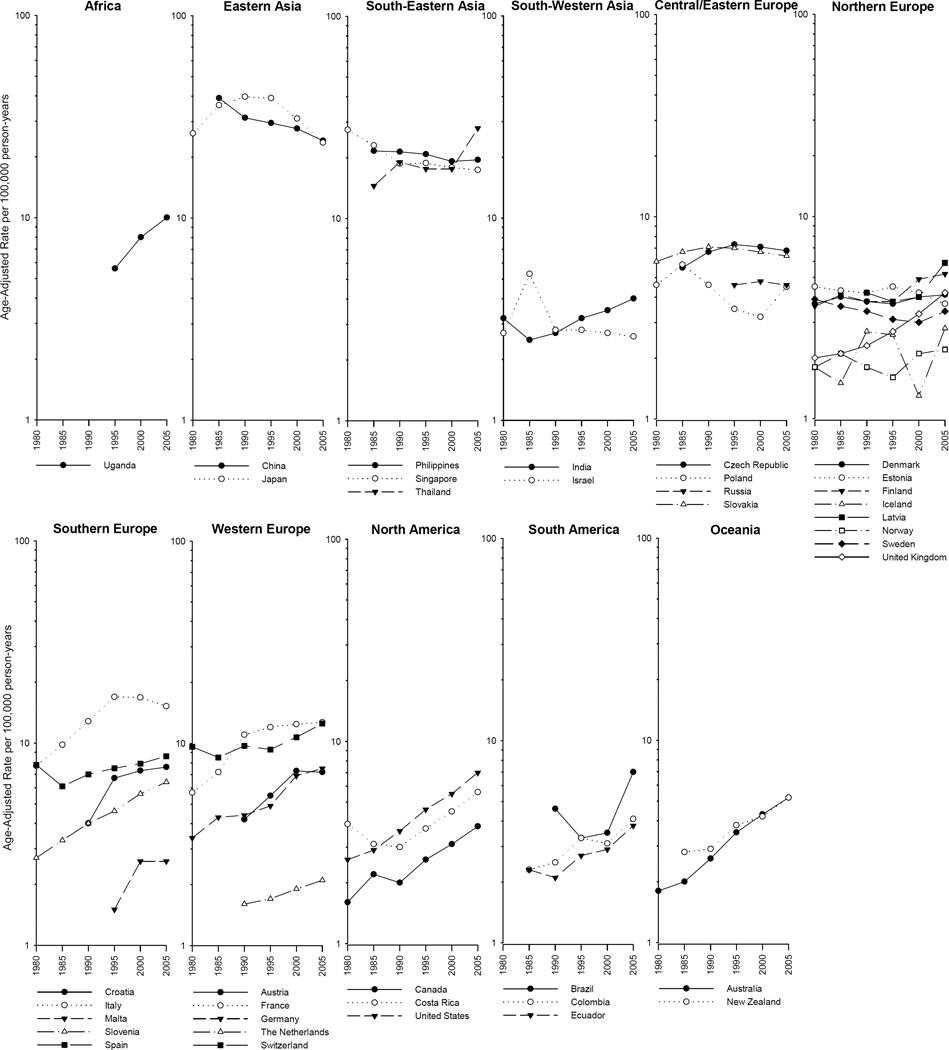
While rates among males were higher in every country examined, the trends were similar between the sexes (Figure 2 and Supplemental Figure 1). Thus focussing on trends in men, the incidence rates in five of the seven Asian countries under study decreased, with significant decreases in China (AAPC=−2.0%) and Singapore (AAPC=−1.7%). A rapid decline was also noted for the recent time period (1993–2007) in Japan (APC=−4.9%; Table 1). With the exception of Thailand, four of the highest risk populations (i.e., China, Japan, the Philippines, and Singapore) experienced a decline in rates (Table 1 and Supplemental Figure S3). Similar trends were seen among females, with the exception of Uganda. Uganda had particularly high rates of liver cancer among females and also had the most rapidly increasing incidence rate (AAPC=4.8) (Supplemental Table S1 and Figure S4).
Figure 2.
Rates in the Americas increased, with AAPCs ranging from 2.5% in Costa Rica to 4.2% in the United States. The incidence rates increased rapidly in Australia (AAPC=4.7%) and Uganda (AAPC=5.8) and in the U.K. (APC=4.2%) during the more recent time period (1988–2007). Of note, Italy (AAPC=2.5) and Slovakia (AAPC=0.1) had overall increases or relative stability in rates in the period 1978 to 2007, but their rates began to decline in more recent years, circa early 1990s (APC=−1.1% and APC=−0.7, respectively) (Table 1).
As shown in Figure 2, temporal trends in liver cancer incidence rates among males have been increasing in most countries. However, notable decreases have been occurring in some Eastern Asian (e.g., China and Japan), South-Eastern Asian (e.g., Singapore), and Southern European (e.g., Italy) countries. Additionally, rates in France have plateaued. Similar trends were observed in females (Supplemental Figure 1).
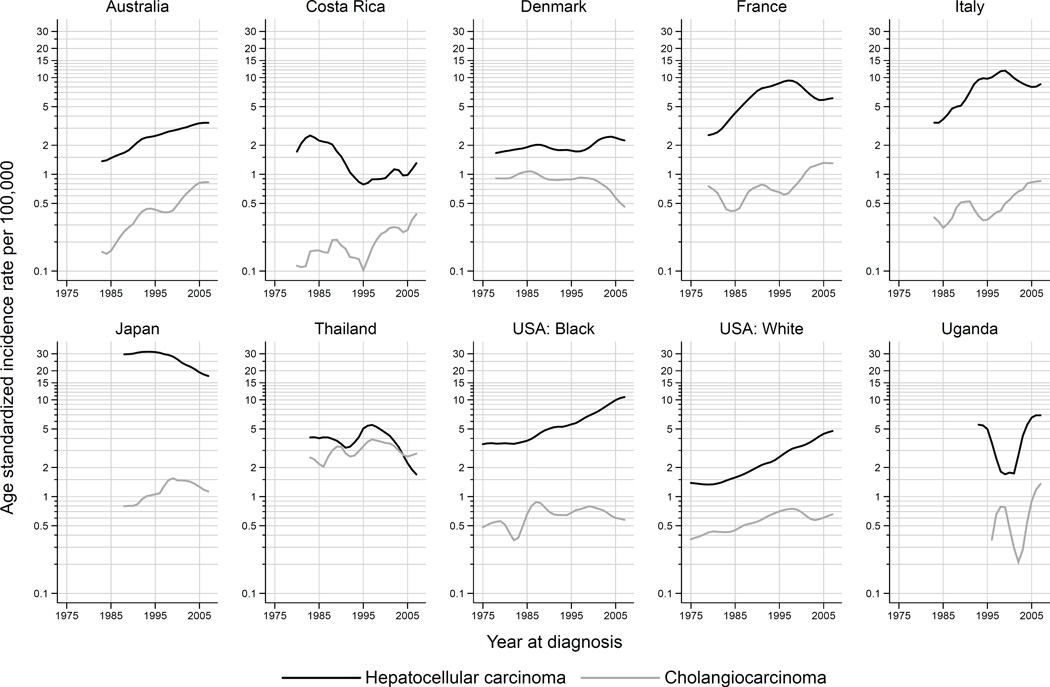
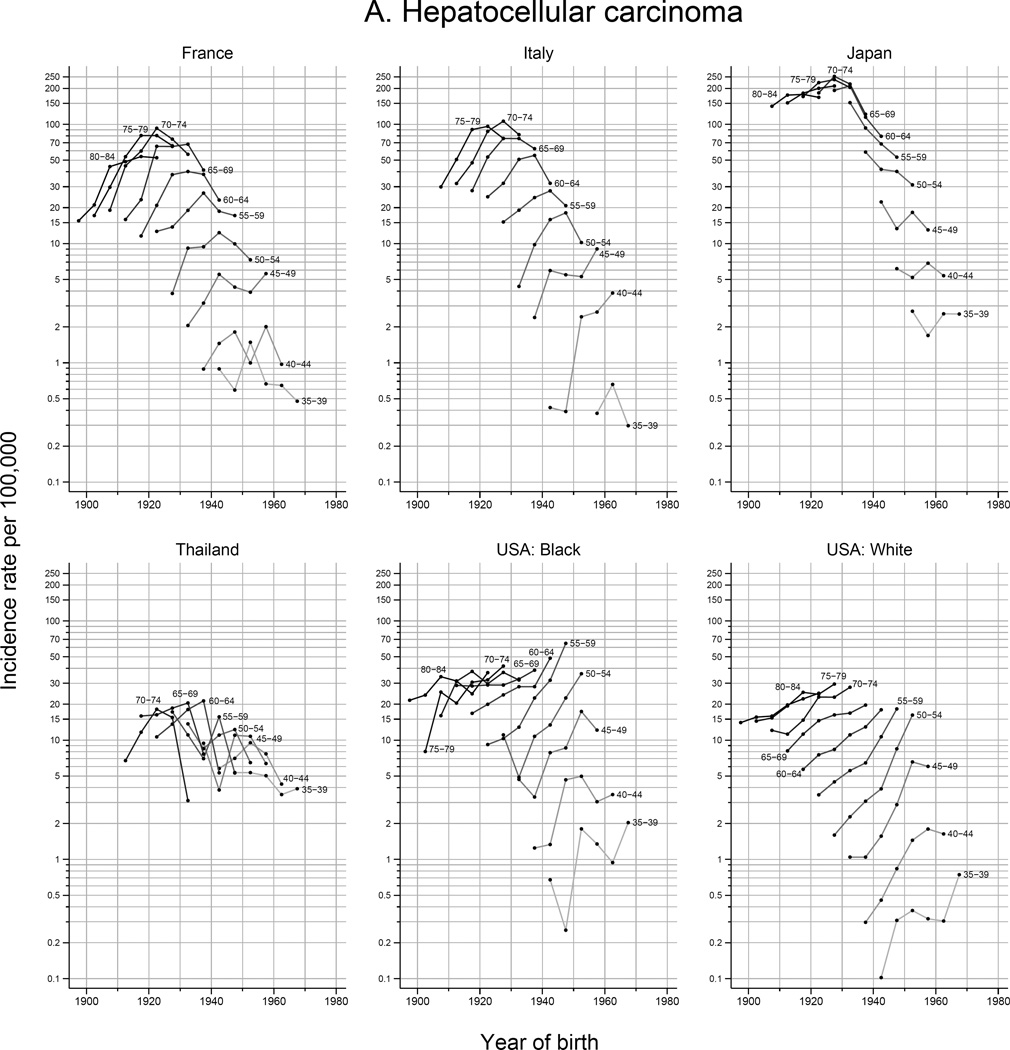
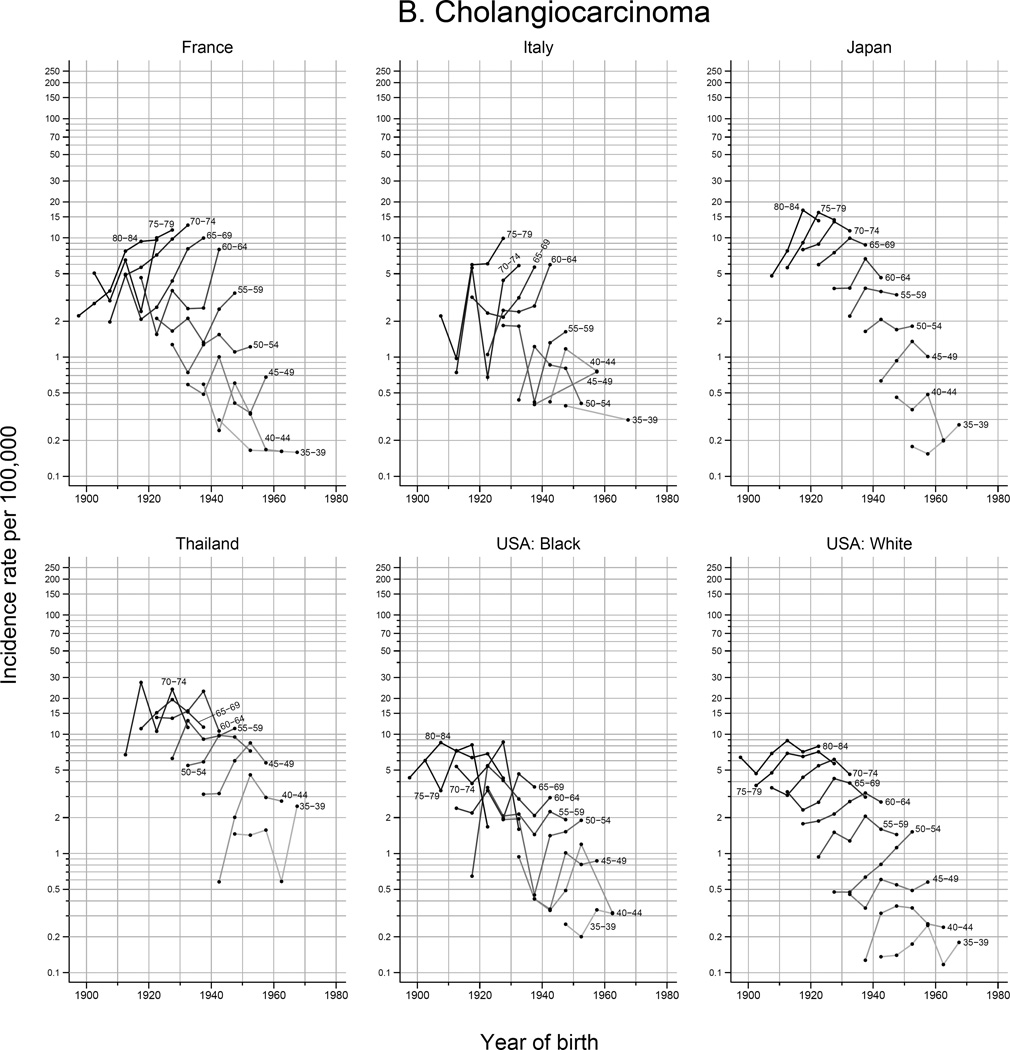
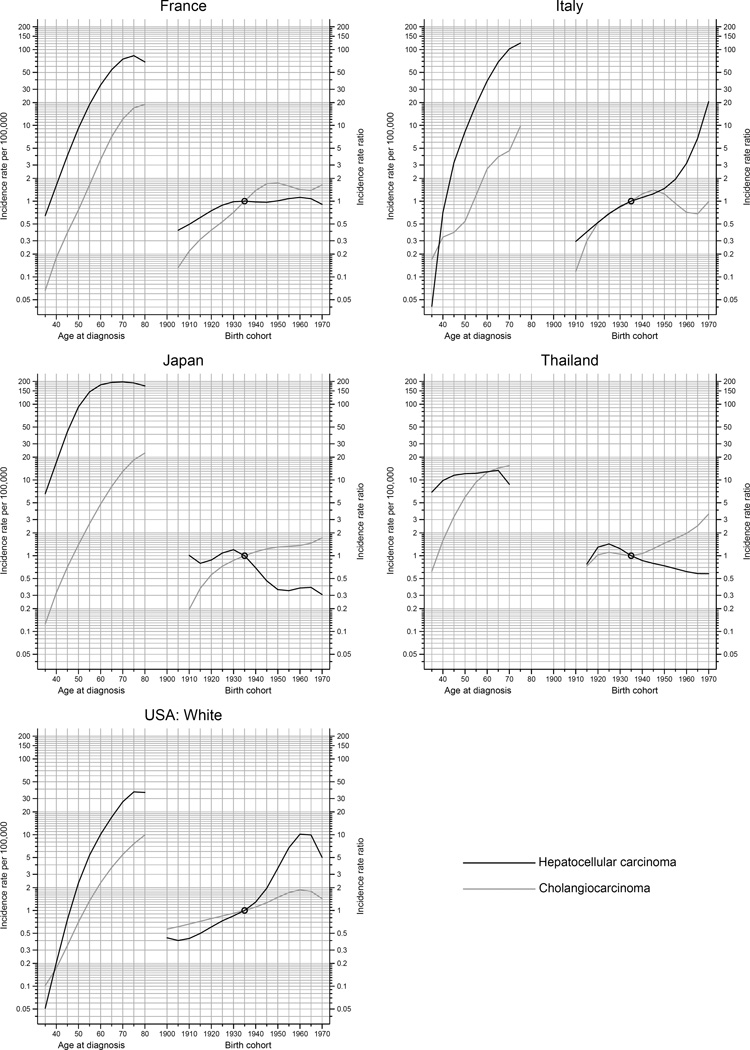
HCC accounted for the majority of all histologically-verified tumors in all countries examined during 2003–2007, and the HCC incidence rate was higher than ICC across all time periods in the evaluated countries (Figure 3 and Supplemental Figure S2). The notable exception is Thailand, where the rate of ICC was consistently similar to HCC across calendar periods. However, higher rates of ICC were noted in Thailand for the most recent time period (2003–2007) – 54% of histologically verified tumors were ICC and 46% were HCC. In France and Italy, the incidence of ICC increased, while the incidence of HCC decreased. Figure 4 shows the trends in observed 5-year age-specific HCC and ICC rates plotted by birth year for selected countries. Rates of HCC generally decreased in younger birth cohorts, with the exception of the US where substantial increases in HCC among the 1945–1965 birth cohorts are observed. In Japan and France, rates of HCC peaked in the 1920–1930 birth cohorts.
Figure 3.
Figure 4.
The peak age at diagnosis for HCC is around 5–15 years before that of ICC (Figure 5). Rates of ICC have been rapidly rising with successive birth cohorts in Thailand, whereas ICC rates have plateaued in other countries among recent generations. With each successive birth cohort, HCC rates have declined in Japan and Thailand, plateaued in France, and increased in the US. While in Italy, rates of HCC have been rising rapidly among cohorts born circa 1945 and thereafter.
Figure 5.
Discussion
Disparities in the burden and risk of liver cancer persist across countries and regions worldwide. During the years examined, incidence rates of liver cancer remained elevated in Asian countries, specifically in a number of Eastern and South-Eastern Asian countries. Rates in a number of very high-risk populations have however decreased in recent years, while rates in low-risk countries including India and several countries in Africa, Europe, America, and Oceania increased. The trends in liver cancer rates according to the two main histologic types (HCC, ICC) were generally similar, following the temporal patterns of liver cancer overall. However, in three countries examined (i.e., Thailand, France, and Italy) for the most recent time period, the rates of ICC increased while HCC rates decreased.
Of special note are the exceptions to the well-documented sex differences. In most areas of the world, male liver cancer rates are two to three-fold higher than female rates. It has been hypothesized that the higher rates among men could be due to higher prevalence of risk factors and differences in sex steroid hormones, immune responses, or epigenetics between men and women.17 However, we note that in several countries in North/South America and Africa, e.g. Costa Rica, Colombia, Ecuador, and Uganda, the rates in females approach the rates of liver cancer observed in males. An examination of GLOBOCAN reveals similar estimated sex differences in rates among other countries in these regions, such as Guatemala and Kenya.18 The explanation for these countries having similar rates in males and females is not clear but may suggest the presence of, as yet, unidentified risk factors.
Previous reports have noted that liver cancer incidence increased in many areas of the world but declined in some Asian countries.4–7 However, previous publications have not examined global trends by histologic subtype. While HCC and ICC may have some common risk factors, geographic areas exhibiting increasing ICC rates do not entirely correspond with those where increasing HCC rates are observed. These unique geographic distributions thus suggest potential differences in liver cancer etiology according to subtype.
Decreasing incidence rates, captured by downward trends in successive birth cohorts from the 1960s – as seen in Chinese registries – are likely due to a multitude of factors. Aflatoxin abatement programs likely explain the majority of the decrease.19, 20 For instance, Qidong, China, which has some of the highest reported rates of liver cancer in the world, consumed maize as a primary dietary staple. In 1985, a policy change introduced rice to the region, and since that time, aflatoxin-albumin adduct levels have decreased by 40-fold and liver cancer mortality has decreased by 45%.19, 20However, neonate HBV vaccination programmes will likely be the major component of additional decreases among future birth cohorts.19, 20 In 1983–1984, a pilot study for HBV vaccination was undertaken in Qidong. This vaccination program was expanded in the following years, until 2002 when GAVI, the Government of China, and the China Centre for Disease Control partnered to create the National Expanded Program of Immunization of China and subsidized the vaccination for all newborns.19, 20 In 2001–2003 for Jiangsu Province (including Qidong), the coverage rate in newborns was 94% for all three doses of HBV vaccine, but in the western Chinese provinces, which are more economically disadvantaged, the coverage rate was only 68%.21 There has also been an emphasis on eliminating HCC co-factors, specifically by reducing smoking rates, eating a healthier diet, and improving water quality.22 In Japan, the decreasing rates of HCC are likely due to a decline in HCV prevalence in the population. Japanese cohorts born between 1925 and 1935 were at elevated risk of contracting HCV due to intravenous injection of amphetamines and blood product transfusions during the middle decades of the twentieth century.23
While the reasons for increasing incidence rates in many areas of the world can only be partially explained, HCV and the associated metabolic disorders of obesity, diabetes and metabolic syndrome certainly play a role. In the U.S., HCV is an important risk factor for HCC, particularly among persons born between 1945 and 1965, known as “baby boomers”, and injection drug users.24 The prevalence of chronic HCV infection among the 1945–1965 birth cohorts is approximately 2.5% – five times the rates seen among adults born in adjacent years.25 Individuals in this high-risk cohort are thought to have become HCV-infected in the 1970s and 1980s, through injection drug use and contaminated blood and blood products prior to the introduction of widespread HCV screening in 1992.25 As the 1945–1965 birth cohorts age, it is likely that rates of HCC will also rise in the US. However, as observed in Japan where the HCV epidemic pre-dated the US epidemic by 20–30 years,23 overall US HCC rates should decline with subsiding generational risk.
The rising rates of obesity, diabetes and metabolic syndrome have also contributed to the rise in HCC rates.26 The relative risk associated with obesity, diabetes, and metabolic syndrome are not as high as those associated with HBV or HCV, but the population attributable fractions (PAF) are higher because these conditions are much more prevalent. In the U.S., the PAF for obesity and diabetes is 36.6%, whereas the PAF for HCV and HBV are 22.4% and 6.3%, respectively.27 Additionally, as the prevalence of obesity28 and diabetes29 are increasing in both developed and developing countries, the proportion of liver cancer attributable to these factors is expected to increase in the future.
Finally, the increasing rates of liver cancer could be due to improved survival after alcohol cirrhosis diagnosis.30 In patients with HCV and cirrhosis, the risk of developing HCC varies from 2 to 8% per year, depending on the type of cirrhosis.31 Thus, if treatment and survival for patients with cirrhosis improves, these patients may also have an increased period at risk of developing liver cancer.
The large geographic variation seen in primary liver cancer rates suggests differences in environmental risk factors and/or genetic factors between populations. In high-risk areas, environmental factors appear to play an important role. Migrants originating from Africa, Asia, and South America, who have settled in Europe, have a consistently elevated risk of liver cancer.26 Similarly, rates of liver cancer observed in Chinese populations residing outside of China are lower than rates in their country of origin, but far higher than rates in the host country population.5 However, a Swedish study reported familial aggregation of liver cancer but no spousal correlation.32 This suggests that genetics may be an important factor in such countries, where a low prevalence of environmental risk factors combines with incidence rates that have remained relatively low and constant over time.
Strengths of this study include the utilization of CI5 data, which are drawn from high quality cancer registries throughout the world. Additionally, this study extended prior evaluations by combining registries within countries to ensure robust measures of country-specific incidence. While this provides a more complete examination than previous reports, the data were still limited as in many countries, the rates were a proxy of the national profile, based on regional registries and perhaps not nationally representative (e.g., Canada and Philippines). Additionally, for certain (female and low-risk) populations, these data were prone to random variation due to small numbers. Furthermore, data from lower-resource countries may be incomplete and of variable quality.33 The current study also examined trends of HCC versus ICC rates and utilized age-period-cohort analyses to assess temporal heterogeneity. However, our examination of HCC-ICC distinctions was limited, as some countries (e.g., China) did not have histology information available in Ci5plus and could not be examined. Limitations include that Ci5 only histologically classifies microscopically verified tumors, whereas diagnosis of liver cancer is commonly done by use of radiological tests or alpha fetoprotein levels – even in developed countries.34 The modelled data and histologic types should be interpreted with caution, as Joinpoint models are highly sensitive to parameter choice and number of data points included. A final limitation was the inability to examine trends in African countries due to historic lack of inclusion in CI5.
In summary in the period 1978 to 2007, rates in some high-risk countries decreased, while rates in low-risk countries increased. It is likely that rates in the former populations will continue to decline, with reductions in the population seroprevalence of HBV.35 In low-risk countries, targeted screening and treatment of HCV(+) individuals alongside the prevention of obesity and the treatment of diabetes will be key, in reducing liver cancer incidence in future decades.
Supplementary Material
Novelty & Impact.
Primary liver cancer is the second leading cause of cancer death worldwide. Nevertheless, trends have not been thoroughly explored by country or by histologic type – hepatocellular carcinoma and intrahepatic cholangiocarcinoma. Liver cancer rates by histologic type tend to convey a similar temporal profile. However, in Thailand, France, and Italy, ICC rates have increased while HCC rates have declined.
Acknowledgments
This study was funded in part by the National Institutes of Health (NIH) Intramural Research Program, National Cancer Institute; and the Australian National Health and Medical Research Council (Career Development Fellowship #1083090).
References
- 1.Ortman J, Velkoff V, Hogan H. An Aging Nation: The Older Population in the United States. U.S. Census Bureau. 2014 [Google Scholar]
- 2.Okuda K, Nakanuma Y, Miyazaki M. Cholangiocarcinoma: recent progress. Part 1: epidemiology and etiology. Journal of gastroenterology and hepatology. 2002;17:1049–1055. doi: 10.1046/j.1440-1746.2002.02781.x. [DOI] [PubMed] [Google Scholar]
- 3.London WT, McGlynn KA. Liver Cancer. In: Schottenfeld D, Fraumeni JF, editors. Cancer epidemiology and prevention. 3rd. Oxford; New York: Oxford University Press; 2006. pp. 763–786. [Google Scholar]
- 4.McGlynn KA, London WT. The global epidemiology of hepatocellular carcinoma: present and future. Clin Liver Dis. 2011;15:223–243. vii–x. doi: 10.1016/j.cld.2011.03.006. [DOI] [PMC free article] [PubMed] [Google Scholar]
- 5.McGlynn KA, Petrick JL, London WT. Global epidemiology of hepatocellular carcinoma: an emphasis on demographic and regional variability. Clinics in liver disease. 2015;19:223–238. doi: 10.1016/j.cld.2015.01.001. [DOI] [PMC free article] [PubMed] [Google Scholar]
- 6.Zhang Y, Ren JS, Shi JF, Li N, Wang YT, Qu C, Zhang Y, Dai M. International trends in primary liver cancer incidence from 1973 to 2007. BMC Cancer. 2015;15:94. doi: 10.1186/s12885-015-1113-4. [DOI] [PMC free article] [PubMed] [Google Scholar]
- 7.McGlynn KA, Tsao L, Hsing AW, Devesa SS, Fraumeni JF., Jr International trends and patterns of primary liver cancer. Int J Cancer. 2001;94:290–296. doi: 10.1002/ijc.1456. [DOI] [PubMed] [Google Scholar]
- 8.Znaor A, Lortet-Tieulent J, Laversanne M, Jemal A, Bray F. International testicular cancer incidence trends: generational transitions in 38 countries 1900–1990. Cancer Causes Control. 2015;26:151–158. doi: 10.1007/s10552-014-0486-z. [DOI] [PubMed] [Google Scholar]
- 9.Trabert B, Chen J, Devesa SS, Bray F, McGlynn KA. International patterns and trends in testicular cancer incidence, overall and by histologic subtype, 1973–2007. Andrology. 2015;3:4–12. doi: 10.1111/andr.293. [DOI] [PMC free article] [PubMed] [Google Scholar]
- 10.Segi M, Fujisaku S, Kurihara M. Geographical observation on cancer mortality by selected sites on basis of standardised death rate. Gann. 1957;48:219–225. [PubMed] [Google Scholar]
- 11.Doll R, Payne P, Waterhouse J. Cancer Incidence in Five Continents: A Technical Reported. Berlin: Springer-Verlag; 1966. [Google Scholar]
- 12.Kim HJ, Fay MP, Feuer EJ, Midthune DN. Permutation tests for joinpoint regression with applications to cancer rates. Stat Med. 2000;19:335–351. doi: 10.1002/(sici)1097-0258(20000215)19:3<335::aid-sim336>3.0.co;2-z. [DOI] [PubMed] [Google Scholar]
- 13.Devesa SS, Donaldson J, Fears T. Graphical presentation of trends in rates. Am J Epidemiol. 1995;141:300–304. doi: 10.1093/aje/141.4.300. [DOI] [PubMed] [Google Scholar]
- 14.Ferlay J, Rous B. Chapter 4: Histological groups. In: Forman D, Bray F, Brewster DH, Gombe Mbalawa C, Kohler B, Piñeros M, SteliarovaFoucher E, Swaminathan R, Ferlay J, editors. Cancer Incidence in Five Continents, Vol X IARC Scientific Publication No 164 ed. Lyon: International Agency for Research on Cancer; 2014. [Google Scholar]
- 15.Clayton D, Schifflers E. Models for temporal variation in cancer rates. II: Age-period-cohort models. Stat Med. 1987;6:469–481. doi: 10.1002/sim.4780060406. [DOI] [PubMed] [Google Scholar]
- 16.Clayton D, Schifflers E. Models for temporal variation in cancer rates. I: Age-period and age-cohort models. Stat Med. 1987;6:449–467. doi: 10.1002/sim.4780060405. [DOI] [PubMed] [Google Scholar]
- 17.Dorak MT, Karpuzoglu E. Gender differences in cancer susceptibility: an inadequately addressed issue. Front Genet. 2012;3:268. doi: 10.3389/fgene.2012.00268. [DOI] [PMC free article] [PubMed] [Google Scholar]
- 18.Ferlay J, Soerjomataram I, Ervik M, Dikshit R, Eser S, Mathers C, Rebelo M, Parkin DM, Forman D, Bray F. Lyon, France: International Agency for Research on Cancer; 2013. [accessed on 25 August 2015]. GLOBOCAN 2012 v1.0, Cancer Incidence and Mortality Worldwide: IARC CancerBase No. 11 [Internet] Available from: http://globocan.iarc.fr. [Google Scholar]
- 19.Sun Z, Chen T, Thorgeirsson SS, Zhan Q, Chen J, Park JH, Lu P, Hsia CC, Wang N, Xu L, Lu L, Huang F, et al. Dramatic reduction of liver cancer incidence in young adults: 28 year follow-up of etiological interventions in an endemic area of China. Carcinogenesis. 2013;34:1800–1805. doi: 10.1093/carcin/bgt007. [DOI] [PMC free article] [PubMed] [Google Scholar]
- 20.Chen JG, Egner PA, Ng D, Jacobson LP, Munoz A, Zhu YR, Qian GS, Wu F, Yuan JM, Groopman JD, Kensler TW. Reduced aflatoxin exposure presages decline in liver cancer mortality in an endemic region of China. Cancer Prev Res (Phila) 2013;6:1038–1045. doi: 10.1158/1940-6207.CAPR-13-0168. [DOI] [PMC free article] [PubMed] [Google Scholar]
- 21.Lawitz E, Mangia A, Wyles D, Rodriguez-Torres M, Hassanein T, Gordon SC, Schultz M, Davis MN, Kayali Z, Reddy KR, Jacobson IM, Kowdley KV, et al. Sofosbuvir for previously untreated chronic hepatitis C infection. The New England journal of medicine. 2013;368:1878–1887. doi: 10.1056/NEJMoa1214853. [DOI] [PubMed] [Google Scholar]
- 22.Gao S, Yang WS, Bray F, Va P, Zhang W, Gao J, Xiang YB. Declining rates of hepatocellular carcinoma in urban Shanghai: incidence trends in 1976–2005. European journal of epidemiology. 2012;27:39–46. doi: 10.1007/s10654-011-9636-8. [DOI] [PMC free article] [PubMed] [Google Scholar]
- 23.Tanaka H, Imai Y, Hiramatsu N, Ito Y, Imanaka K, Oshita M, Hijioka T, Katayama K, Yabuuchi I, Yoshihara H, Inoue A, Kato M, et al. Declining incidence of hepatocellular carcinoma in Osaka, Japan, from 1990 to 2003. Annals of internal medicine. 2008;148:820–826. doi: 10.7326/0003-4819-148-11-200806030-00004. [DOI] [PubMed] [Google Scholar]
- 24.El-Serag HB. Epidemiology of viral hepatitis and hepatocellular carcinoma. Gastroenterology. 2012;142:1264–1273. e1. doi: 10.1053/j.gastro.2011.12.061. [DOI] [PMC free article] [PubMed] [Google Scholar]
- 25.Centers for Disease Control and Prevention. Recommendations for the Identification of Chronic Hepatitis C Virus Infection Among Persons Born During 1945–1965. MMWR. 2012;61:6. [PubMed] [Google Scholar]
- 26.Arnold M, Razum O, Coebergh JW. Cancer risk diversity in non-western migrants to Europe: An overview of the literature. Eur J Cancer. 2010;46:2647–2659. doi: 10.1016/j.ejca.2010.07.050. [DOI] [PubMed] [Google Scholar]
- 27.Welzel TM, Graubard BI, Quraishi S, Zeuzem S, Davila JA, El-Serag HB, McGlynn KA. Population-attributable fractions of risk factors for hepatocellular carcinoma in the United States. The American journal of gastroenterology. 2013;108:1314–1321. doi: 10.1038/ajg.2013.160. [DOI] [PMC free article] [PubMed] [Google Scholar]
- 28.James WP. The epidemiology of obesity: the size of the problem. Journal of internal medicine. 2008;263:336–352. doi: 10.1111/j.1365-2796.2008.01922.x. [DOI] [PubMed] [Google Scholar]
- 29.Shaw JE, Sicree RA, Zimmet PZ. Global estimates of the prevalence of diabetes for 2010 and 2030. Diabetes research and clinical practice. 2010;87:4–14. doi: 10.1016/j.diabres.2009.10.007. [DOI] [PubMed] [Google Scholar]
- 30.Carbonell N, Pauwels A, Serfaty L, Fourdan O, Levy VG, Poupon R. Improved survival after variceal bleeding in patients with cirrhosis over the past two decades. Hepatology. 2004;40:652–659. doi: 10.1002/hep.20339. [DOI] [PubMed] [Google Scholar]
- 31.Bruix J, Sherman M. American Association for the Study of Liver D. Management of hepatocellular carcinoma: an update. Hepatology. 2011;53:1020–1022. doi: 10.1002/hep.24199. [DOI] [PMC free article] [PubMed] [Google Scholar]
- 32.Hemminki K, Li X. Familial liver and gall bladder cancer: a nationwide epidemiological study from Sweden. Gut. 2003;52:592–596. doi: 10.1136/gut.52.4.592. [DOI] [PMC free article] [PubMed] [Google Scholar]
- 33.Drenth JP. HCV treatment--no more room for interferonologists? The New England journal of medicine. 2013;368:1931–1932. doi: 10.1056/NEJMe1303818. [DOI] [PubMed] [Google Scholar]
- 34.Simpson HN, McGuire BM. Screening and detection of hepatocellular carcinoma. Clin Liver Dis. 2015;19:295–307. doi: 10.1016/j.cld.2015.01.004. [DOI] [PubMed] [Google Scholar]
- 35.Ott JJ, Stevens GA, Groeger J, Wiersma ST. Global epidemiology of hepatitis B virus infection: new estimates of age-specific HBsAg seroprevalence and endemicity. Vaccine. 2012;30:2212–2219. doi: 10.1016/j.vaccine.2011.12.116. [DOI] [PubMed] [Google Scholar]
Associated Data
This section collects any data citations, data availability statements, or supplementary materials included in this article.


