

Abstract
Introduction: The prognosis of glioblastoma (GBM) treated with standard-of-care maximal surgical resection and concurrent adjuvant temozolomide (TMZ)/radiotherapy remains very poor (less than 15 months). GBMs have been found to contain a small population of cancer stem cells (CSCs) that contribute to tumor propagation, maintenance, and treatment resistance. The highly invasive nature of high-grade gliomas and their inherent resistance to therapy lead to very high rates of recurrence. For these reasons, not all patients with similar diagnoses respond to the same chemotherapy, schedule, or dose. Administration of ineffective anticancer therapy is not only costly but more importantly burdens the patient with unnecessary toxicity and selects for the development of resistant cancer cell clones. We have developed a drug response assay (ChemoID) that identifies the most effective chemotherapy against CSCs and bulk of tumor cells from of a panel of potential treatments, offering great promise for individualized cancer management. Providing the treating physician with drug response information on a panel of approved drugs will aid in personalized therapy selections of the most effective chemotherapy for individual patients, thereby improving outcomes. A prospective study was conducted evaluating the use of the ChemoID drug response assay in GBM patients treated with standard of care. Methods: Forty-one GBM patients (mean age 54 years, 59% male), all eligible for a surgical biopsy, were enrolled in an Institutional Review Board–approved protocol, and fresh tissue samples were collected for drug sensitivity testing. Patients were all treated with standard-of-care TMZ plus radiation with or without maximal surgery, depending on the status of the disease. Patients were prospectively monitored for tumor response, time to recurrence, progression-free survival (PFS), and overall survival (OS). Odds ratio (OR) associations of 12-month recurrence, PFS, and OS outcomes were estimated for CSC, bulk tumor, and combined assay responses for the standard-of-care TMZ treatment; sensitivities/specificities, areas under the curve (AUCs), and risk reclassification components were examined. Results: Median follow-up was 8 months (range 3-49 months). For every 5% increase in in vitro CSC cell kill by TMZ, 12-month patient response (nonrecurrence of cancer) increased two-fold, OR = 2.2 (P = .016). Similar but somewhat less supported associations with the bulk tumor test were seen, OR = 2.75 (P = .07) for each 5% bulk tumor cell kill by TMZ. Combining CSC and bulk tumor assay results in a single model yielded a statistically supported CSC association, OR = 2.36 (P = .036), but a much attenuated remaining bulk tumor association, OR = 1.46 (P = .472). AUCs and [sensitivity/specificity] at optimal outpoints (>40% CSC cell kill and >55% bulk tumor cell kill) were AUC = 0.989 [sensitivity = 100/specificity = 97], 0.972 [100/89], and 0.989 [100/97] for the CSC only, bulk tumor only, and combined models, respectively. Risk categorization of patients was improved by 11% when using the CSC test in conjunction with the bulk test (risk reclassification nonevent net reclassification improvement [NRI] and overall NRI = 0.111, P = .030). Median recurrence time was 20 months for patients with a positive (>40% cell kill) CSC test versus only 3 months for those with a negative CSC test, whereas median recurrence time was 13 months versus 4 months for patients with a positive (>55% cell kill) bulk test versus negative. Similar favorable results for the CSC test were observed for PFS and OS outcomes. Panel results across 14 potential other treatments indicated that 34/41 (83%) potentially more optimal alternative therapies may have been chosen using CSC results, whereas 27/41 (66%) alternative therapies may have been chosen using bulk tumor results. Conclusions: The ChemoID CSC drug response assay has the potential to increase the accuracy of bulk tumor assays to help guide individualized chemotherapy choices. GBM cancer recurrence may occur quickly if the CSC test has a low in vitro cell kill rate even if the bulk tumor test cell kill rate is high.
Introduction
Glioblastoma (GBM) is the most common primary malignant brain tumor [1]. It is also the most aggressive brain tumor, exhibiting a very poor prognosis (median overall survival [OS] =14.2 months) even if treated with maximal therapy [2]. Currently, surgical resection (when possible) and radiotherapy with concomitant and adjuvant temozolomide (TMZ) are the gold standard for patients with newly diagnosed GBM[1]. However, the management of GBMs remains difficult in that no contemporary therapies are curative. In fact, despite maximal treatment, recurrence is nearly universal [3].
Open tumor resection is usually considered the first step within the management algorithm; however, the highly infiltrative growth pattern of GBMs into surrounding brain tissues makes the surgical approach almost invariably not radical [4]. It has been observed that complete resection is achieved in about 40% to 45% of patients, with a similar proportion receiving incomplete resection, whereas only about 10% to 20% are diagnosed by biopsy only. Although the use of TMZ has improved GBM outcome [2], almost all patients suffer from recurrent disease. Recurrent GBM has several treatment options depending on specific aspects of its presentation, including secondary cytoreductive surgery when possible, and numerous second-line chemotherapy treatment options [5]. Although most patients eventually succumb to progression of recurrent disease, a few will benefit from further therapy and experience variable remission and symptom-free survival [5].
Selection of effective chemotherapy is extremely important not only when therapy is first initiated but for recurrent disease as well. In fact, administration of ineffective anticancer therapy is associated with unnecessary toxicity and the development of more aggressive cancer cell clones that are resistant to subsequent therapies. The ability to initially choose the most effective chemotherapy may help to avoid the physical, emotional, and financial burden to patients of ineffective therapy, thereby improving their quality of life [6]. Each time patients are treated, they have a chance of relapse, and their cancer will likely become more resistant to therapy [7]. Presently used anticancer drugs have a high rate of failure, and cell culture chemotherapy testing has been used to identify which drugs are more likely to be effective against a particular tumor type. Measuring the response of the tumor cells to drug exposure is valuable in any situation in which there is a choice between two or more treatments. Many attempts have been made over the years to develop an ex vivo anticancer test that can provide clinically relevant treatment information. However, until now, this approach has been hampered by the chemotherapy testing only being performed on bulk of tumor cells derived from cancer biopsies [8], [9], [10], [11], [12], [13], [14], [15], [16], [17]. GBMs contain a heterogeneous population of cells, among which is a population of self-renewing cancer stem cells (CSCs) that contribute to tumorigenesis, treatment resistance, and tumor recurrence [3], [6].
Research on CSCs has failed thus far to discover universally informative biomarkers, mutations, or gene expression patterns [18]. CD133 is the best-studied CSC biomarker and is often used experimentally to identify and enrich tumor-propagating and -initiating cells. Also known as prominin-1, CD133 is associated with normal neural stem cells and is expressed during embryonic development [19]. In several experiments, tumor cells isolated from GBM that grew neurospheres in serum-free medium (indicating self-renewal capabilities) and grew tumors phenotypically similar to GBM were found to be CD133 positive, whereas tumor cells that lacked CD133 expression did not demonstrate self-renewal or tumorigenicity in xenotransplantation studies [20], [21], [22], [23]. However, despite the evidence outlining its crucial relationship with CSCs, CD133 is not a universal marker for identifying CSCs. Additional biomarkers have been studied in GBM including CD24, CD44, CXCR4, CD34/CD38−, Oct3/4, and Nanog [24], [25], [26], [27], [28], [29], [30]. Given their critical role in tumor initiation, propagation, and maintenance, CSCs constitute a very attractive therapeutic focus on which several laboratories have been concentrating their efforts.
ChemoID is a functional test that uses patient's live tumor cells to indicate which chemotherapy agent (or “combinations”) will kill not only the bulk tumor cells but also the CSCs that are known to cause cancer to recur. Targeting of CSCs alongside the bulk of other cancer cells is a new paradigm in cancer treatment. This constitutes an important advantage of the ChemoID approach over other cell culture testing methods. Our recent clinical studies show that patient-derived CSCs from primary cancer cell cultures can be used in a drug response assay [6], [31], [32], [33], [34], [35]. We have optimized the enrichment of CSCs from tumor biopsies and have developed the ChemoID chemotherapy response assay, which measures the sensitivity of CSCs and bulk of tumor cells to chemotherapy to determine the most effective combination of anticancer drugs for solid tumors [6], [31], [32], [33], [34], [35].
We report here for the first time a prospective clinical investigation using the ChemoID assay to measure the sensitivity and resistance of CSCs and bulk of tumor cells cultured from 42 GBM clinical samples (41 patients plus 1 recurrent patient) challenged with several chemotherapy agents, which were also correlated to the clinical response of the treated patients, independently of other biomarkers. Additionally, we correlated the ChemoID in vitro predicted response and the respective clinical response of a selected number of treated patients to matching animals bearing patient-derived xenografts (PDXs) treated with ChemoID-predicted drugs.
Materials and Methods
Patient Eligibility
We utilized a consecutive available patients approach, given that this was an investigational cohort study designed to both examine utility and additionally inform power calculations for a proposed larger follow-up randomized clinical trial. Patients were enrolled in the study only after a discussion of their treatment options, including chemotherapy. Male and female eligible patients, 18 years and older, clinically diagnosed with suspicion of GBM, received surgical biopsy for histological diagnosis and, at the same time, for the ChemoID assay between April 2012 and April 2016. Exclusion criteria included patients without histological confirmation of WHO grade IV GBM or patients younger than 18 years. Radiological data were collected before surgery; immediately postsurgery; and following chemo/radiation therapy at 3, 6, 9, and 12 months, with a follow-up every 3 months thereafter. ChemoID assay was performed after obtaining patients' written informed consent in accordance with the ethical standards of the Helsinki Declaration (1964, amended most recently in 2008) of the World Medical Association. Any information, including radiological imaging, was blinded. Marshall University Institutional Review Board (IRB) has approved this research under protocol #326290. Participants provided their written consent on an IRB-approved informed consent form to participate in this study after being educated about the research protocol. Ethics committees/IRB at Marshall University approved this consent procedure.
Treatment and Follow-Up
This study was designed to be noninterventional to assess the assay-outcome correlation in an unbiased manner. Following histological diagnosis of GBM, patients were treated with maximal surgical resection (when possible) and concurrent adjuvant TMZ/radiotherapy, and patients and physicians were blinded to the assay results.
Supportive care was also allowed at the discretion of the treating physician. Disease status was measured by radiologic examination (magnetic resonance scan as the primary imaging method), physical examination, and measurements using the Response Assessment in Neuro-Oncology criteria [36], and the assessment was performed every 3 months during the treatment, every 3 months for the first year, and every 3 to 6 months thereafter. The Response Assessment in Neuro-Oncology criteria, roughly similarly to other systems, divide response into four types based on imaging (magnetic resonance imaging [MRI]) and clinical features [37], [38]: complete response, partial response, stable disease, and progression.
Drug Sensitivity Assay
Multiple fresh GBM tissue samples for ChemoID in vitro functional testing were collected in the operating room from each patient at the time of surgery. Details regarding the assay procedure have been described elsewhere [6]. In brief, primary cultures were initiated by mincing each GBM tissue sample into 1- to 3-mm3 pieces. Explants were then disassociated into single-cell suspensions using a 50% solution 0.025% trypsin and Accutase (Innovative Cell Technologies, San Diego, CA). Cells were serially plated in 6-well, 10-cm treated dishes and cultured to subconfluence in RPMI-1640 medium supplemented with 5% irradiated, heat-inactivated, defined fetal bovine serum (Thermofisher/Hyclone), and 50 U of penicillin and 5 μg of streptomycin/ml of medium (Thermofisher/Mediatech). Proliferation of CSCs was obtained using a culture methodology previously described [6], [32] in which culture media, oxygenation, rotational speed of the culture vessel, temperature, and CO2 were kept consistently constant for 7 days. Cells were then removed and counted again using trypan blue exclusion to determine cellular viability and cell number and plated in 96 wells for chemosensitivity testing. The cells were also incubated with florescent antibodies for phenotypic characterization [6], [32].
Cells were also stained using fluorescence-labeled anti-CD133/2 (prominin1); CXCR4 (Miltenyi Biotech, Auburn, CA); and −CD44, −Oct3/4, and −Nanog (BD Bioscience, Sparks, MD) using an Accuri C-6 flow cytometer (BD Bioscience, Sparks, MD). Briefly, cells were disassociated using 0.02% EDTA in PBS and pelleted (10 minutes at 1000 rpm), washed in 0.1% BSA in 1× PBS at 4°C, and incubated in a solution of 1 mg antibody + 9 ml 0.1% BSA in 1× PBS. Cells were washed in the same solution once and were analyzed using a C6 Accuri flow cytometer (BD Biosciences, San Jose, CA).
Sensitivity to chemotherapy was assessed using a WST8 viability assay (Dojindo Molecular Technologies, Rockville, MD) on 1 × 10³ cells plated in 5 replicas into 96-well plates. Briefly, equal numbers of bulk of tumor cells grown in monolayer and CSCs were counted and seeded separately in 96-well dishes and incubated at 37°C for 24 hours. Three concentrations of each treatment were prepared by serial dilution. Each concentration was added to five replicate wells on the microtiter plate. Three replicate wells (control 1 = no treatment) and three replicate wells (control 2 = equal amount of solvent) were associated with each treatment also. The cells were challenged for a 1-hour pulse with the panel of anticancer drugs. The WST8 assay was performed 48 hours following chemotherapy treatment to assess cell viability as previously described [6].
The inhibition of bulk of tumor cells and CSCs survival was measured for each concentration (average counts in five replicates ± SE) of a given treatment (15-18 per patient). The survival of tumor cells at each concentration was calculated as compared to control 2, and overall percentages of bulk and CSC tumor cells killed were calculated for each treatment as the primary measures of potential therapy efficacy.
PDX Animal Study
All animal studies have been conducted following approval from the Marshall University IACUC, protocol #373017. The effects of chemotherapies screened in vitro by the ChemoID assay were tested on human tumor biopsies that were xenografted in the flank of a NOD-Scid mouse model. 1 × 10⁶GBM CSCs were mixed to 100 μl of Matrigel (BD Biosciences, San Jose, CA) injected subcutaneously in the flank of 10 immunodeficient mice (NOD-Scid)/group and were grown until 50 to 60 mm3. Mice were randomized in different treatment and control groups, and chemotherapy was administered by intraperitoneal (i.p.) injections in 200 μl as follows in a period of 4 weeks: Group 1, serving as control group with primary tumor cells injected into flank and receiving i.p. sterile saline injections. Group2 was administered i.p. injections of Temodar. Groups 3 to 6 received i.p. injections of the least effective chemotherapy, or the most effective, the second most effective, and the most effective combinatorial chemotherapy, as determined by the ChemoID drug response assay. Chemotherapy mouse doses were calculated using a body surface area normalization method [39] from the clinical dose and verified according to doses previously determined by a literature search. Animals were euthanized following the current guidelines established by the latest Report of the AVMA Panel on Euthanasia using CO2 inhalation and asphyxiation followed by cervical dislocation.
Statistical Analysis
The primary end point of this study was 12-month patient response to TMZ therapy, defined by lack of tumor recurrence within a 12-month period. Secondary end points were OS, progression-free survival (PFS), and 12-month OS\PFS. Logistic regression was used to estimate odds ratio (OR) associations between 12-month response and 5% increases in %-cell kill for TMZ therapy bulk tumor and CSC assay results. Receiver operating characteristic areas under the curve (AUCs) and sensitivity/specificity for optimal thresholds (maximum specificity for 100% sensitivity) were calculated following the logistic regressions. Three logistic models were examined: one using CSC assay results alone, a second using bulk tumor assay results alone, and a third combining both CSC results and bulk tumor assay results; CSC and bulk tumor results were correlated (Pearson = 0.75), and orthogonal bulk tumor assay results were calculated using the residuals from a fractional polynomial regression of bulk tumor results on CSC results for inclusion in the third (combined assay results) model to avoid collinearity issues. Unadjusted and adjusted models (age, sex, isocitrate dehydrogenase 1) were examined; no adjustors were statistically supported for inclusion once the %-cell kill assay results were added to the models, and unadjusted OR estimates are reported. Risk reclassification tables and related net reclassification improvement (NRI) indices were calculated for the optimal assay thresholds with bootstrap 95% confidence intervals (CIs). For analyses related to secondary outcomes, Kaplan-Meier curves and Cox proportional hazard models reporting hazard ratios were used to estimate associations of TMZ %-cell kill bulk tumor and CSC assay results with time to recurrence, OS, and PFS. Analysis of animal data was conducted using analysis of variance procedures. P values less than .05 were considered statistically significant.
Results
Patients
Between 2012 and 2016, 41 patients plus 1 recurrent patient affected by GBM were enrolled, and 100% had both a successful assay and complete clinical data, making them evaluable for this study. All tissues were submitted as fresh sterile biopsies. Patients were 59% male with a mean age of 54 years, and 71% had a mutant isocitrate dehydrogenase 1 gene (Table 1). Median patient follow-up was 9 months (range 3-49 months), with 36/41 (88%) experiencing recurrence.
Table 1.
Patient Characteristics⁎
| All | Nonrecurrence (12 mo) | Recurrence (12mo) | |
|---|---|---|---|
| N | 41 | 5 | 36 |
| Female | 17 (41%) | 3 (60%) | 14 (39%) |
| Male | 24 (59%) | 2 (40%) | 22 (61%) |
| Age (years) | 53.80 (14.19) | 54.20 (14.89) | 53.75 (14.31) |
| idh1: unavailable | 2 (5%) | 0 (0%) | 2 (6%) |
| idh1: WT | 10 (24%) | 0 (0%) | 10 (28%) |
| idh1: MUT | 29 (71%) | 5 (100%) | 24 (67%) |
| GBM histology | 41 (100%) | 5 (100%) | 36 (100%) |
Values in cells represent N (%) and mean (SD) for categorical and continuous variables, respectively.
Drug Sensitivity Assay and Clinical Outcomes
Figure 1 illustrates the relationship between the TMZ CSC assay results (%-cell kill on the y-axis) and TMZ bulk tumor assay results (%-cell kill on the x-axis) characterized by 12-month recurrence outcomes, with solid circles representing treatment responders (patients who did not manifest a recurrence at 12 months) and open circles representing patients manifesting recurrence within 12 months from treatment. Referent lines are drawn at the optimal thresholds from the logistic regression models (40% for CSC, 55% for bulk tumor). In the upper-right quadrant are patients with high TMZ cell kill for both CSC and bulk tumor assays where 5/41 (12%) had prolonged tumor response and only 1 (2.4%) was recurrent. In the lower-left quadrant are patients with low TMZ cell kill for both CSC and bulk tumor assays; all 31 (76%) recurred within 12 months from treatment. Finally, the lower-right quadrant shows patients whose TMZ bulk tumor assay showed a high cell kill (>55%) but whose TMZ CSC assay showed a low cell kill (<40%); all 4/41 (10%) recurred within 12 months.
Figure 1.
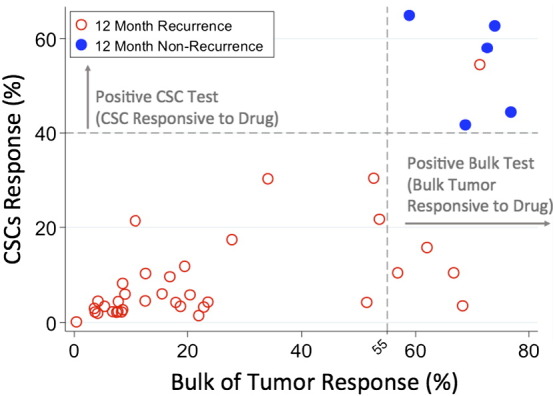
Quadrant diagram of the relationship between TMZ CSC assay results (%-cell kill on the y-axis) and TMZ bulk tumor assay results (%-cell kill on the x-axis) characterized by 12-month recurrence outcomes. Solid circles represent treatment responders (patients who did not manifest a recurrence at 12 months), and open circles represent patients manifesting recurrence within 12 months from treatment. Optimal threshold referent lines from the logistic regression models (40% for CSC, 55% for bulk tumor) are illustrated.
When the CSC assay results were considered separately, every 5% increase in TMZ CSC %-cell kill was associated with a significant two-fold increase in 12-month patient response (nonrecurrence of cancer), OR = 2.2 (95% CI 1.16-4.17),P = .016 (Table 2). TMZ bulk tumor %-cell kill was similarly associated but with less statistical support, OR = 2.8 (0.93-8.06) P = .066 for each 5% increase. When the CSC and bulk test results were analyzed together in a single, multivariate model, the CSC test again showed a statistically supported OR of 2.36 (1.06-5.25) P = .036, whereas the bulk of tumor test association fell to OR = 1.46 (0.52-4.08) P = .472. ChemoID assay areas under the curve were high for all three models: AUC = 0.989, 0.972, and 0.989 for the separate CSC, bulk tumor, and combined model, respectively. Related optimal thresholds for the assays were 40% CSC cell kill and 55% bulk tumor cell kill by TMZ which then provided sensitivities/specificities of 100/97, 100/89, and 100/97 for the three models, respectively. Both the CSC assay and the bulk tumor assay performed well in these models and in related secondary models for OS & PFS, with the CSC assay showing slightly improved results over the bulk tumor results throughout (Table 2).
Table 2.
OR, CI, P Value, Sensitivity, Specificity, and AUC of Recurrence Prediction, PFS, and Survival Analysis
| M1: CSCs Only | M2: Bulk Only | M3: CSCs + rBulk |
|||
|---|---|---|---|---|---|
| CSCs | Bulk | CSCs | Bulk | ||
| Nonrecurrence | OR; P value (95% CI) |
OR = 2.20; P = .016 (1.16-4.17) | OR = 2.75; P = .066 (0.93-8.06) | OR = 2.36; P = .036 (1.06-5.25) | OR = 1.46; P = .472 (0.52-4.08) |
| AUC [Sens/Spec*] | 0.989 [100/97] | 0.972 [100/89] | 0.989 [100/97] | ||
| PFS | OR; P value (95% CI) |
OR = 2.47; P = .010 (1.24-4.89) | OR = 2.43; P = .014 (1.19-4.93) | OR = 5.20; P = .022 (1.27-21.39) | OR = 2.08; P = .035 (1.05-4.09) |
| Survival | OR; P value (95% CI) |
OR = 2.41; P = .014 (1.19-4.87) | OR = 2.24; P = .018 (1.14-4.38) | OR = 5.04; P = .031 (1.16-21.92) | OR = 2.06; P = .036 (1.05-4.05) |
(1) All ORs given per 5% increase.
(2) Sens/Spec calculated at optimal thresholds for CSC (40%) and bulk (55%).
(3) Model M3 uses both CSCs and residual bulk.
Risk reclassification approaches comparing the value of the CSC test in addition to the bulk tumor test (Table 3) showed strong agreement for predicting responsiveness in those who were indeed responsive (100% agreement, event NRI = 0.00) as well as general agreement (86%) for predicting nonresponsiveness (tumor recurrence) in those who experienced recurrence. The benefit of the CSC test over and above the bulk test was seen when the bulk test showed a high cell kill rate whereas the CSC test showed a low cell kill rate; all patient outcomes where the tests disagreed in this manner (11%) coincided with the CSC predicted results (i.e., experienced recurrence within 12 months). Because all reclassifications came from the nonresponsive group (as a priori biologically predicted), the overall NRI was equivalent to the event NRI = 0.11 (95% CI 0.01-0.21),P = .030.
Table 3.
Risk Reclassification Analysis of GBM Cases Based on CSCs Test Result
| Reclassification of Cases Based on CSCs Test Knowing Bulk of Tumor Result | |||
|---|---|---|---|
| Responsive (12-Month Tumor Nonrecurrence) | |||
| Bulk Test >55 & CSC Test >40 | |||
| Bulk test >55 | No | Yes | Total |
| No | 0 (0%) | 0 (0%) | 0 (0%) |
| Yes | 0 (0%) | 5 (100%) | 5 (100%) |
| Total | 0 (0%) | 5 (100%) | 5 (100%) |
| Not Responsive (12-Month Tumor Recurrence) | |||
| Bulk Test >55 & CSC Test >40 | |||
| Bulk test >55 | No | Yes | Total |
| No | 31 (86.1%) | 0 (0%) | 31 (86.1%) |
| Yes | 4 (11.1%) | 1 (2.8%) | 5 (13.9%) |
| Total | 35 (97.2%) | 1 (2.8%) | 36 (100%) |
Risk category NRI:
Event NRI: 0.000
Nonevent NRI: 0.111 (0.011-0.211) P = .030
Figure 2 shows Kaplan-Meyer plots of time to recurrence stratified by ChemoID test results using the optimal TMZ thresholds (40% cell kill for CSC and 55% cell kill for bulk tumor). Patients with positive ChemoID CSC tests (>40% cell kill) had longer median times to recurrence (20 months) than those with negative CSC tests (3 months). Patients with positive bulk tumor tests (>55% cell kill) had longer median times to recurrence (13 months) than those with negative bulk tumor tests (4 months), but the separation was not as great. Table S1 provides estimated hazard ratios for secondary time to event outcomes for the individual and combined CSC and bulk tumor TMZ assay results similar to our primary logistic models; results were similar, with stronger statistical support for both assays.
Figure 2.

Kaplan-Meier plots of tumor recurrence across the study period. Survival (tumor nonrecurrence) is shown stratified by dichotomized test results (TMZ optimal thresholds of CSCs> 40% and bulk test >55%); P for both <.001 in Cox proportional hazard models.
Pattern of In Vitro Chemotherapy Response
To estimate the proportion of patients who may benefit from a sensitive versus not-sensitive treatment chosen prospectively, the drug response to 13 single agents (Temodar, Vincristine, Carboplatin, Cisplatin, Etoposide, Methotrexate, Arabinocide-C, Oxaliplatin, Irinotecan, Avastin, bis-chloroethylnitrosourea (BCNU), 1-(2-chloroethyl)-3-cyclohexyl-1-nitrosourea (CCNU), and Procarbazine) and 2 combinations (Irinotecan + Avastin) and (Procarbazine + CCNU + Vincristine) was analyzed. Figure 3A shows a pyramid diagram representation of the comparison in percent cell kill of the most cytotoxic drug compared to TMZ for each patient. Optimal therapies with the highest cell kill are shown in light colors and TMZ cell kill is shown in dark colors, with each row of the pyramid corresponding to results for a single patient. CSC results outlined in red show patients whose CSC test identified an optimal therapy that was different than the optimal therapy identified by the bulk test. Single asterisk (*) indicates patient in Figure 4 and double asterisks (**) patient in Figure 5. CSC results identified a more optimal therapy than TMZ in 34/41 patients (83%), and bulk tumor results identified a more optimal therapy than TMZ in 27/41 patients (66%). The CSC test identified a different optimal therapy than the bulk test in 17/41 patients, 42% (95% CI 26%-57%),P < .001.
Figure 3.

Comparison of most sensitive drug from a panel of various chemotherapies versus Temodar.
(A) Pyramid plot of percent cell kill for the most cytotoxic drug and TMZ comparing CSC and bulk tests for each patient. Optimal therapies with the highest cell kill are shown in light colors and TMZ cell kill is shown in dark colors, with each row of the pyramid corresponding to results for a single patient. When the light bar is longer than the dark bar, a potentially more optimal therapy than TMZ is identified. CSC results outlined in red show patients whose CSC test identified an optimal therapy that was different than the optimal therapy identified by the bulk test, 17/41 patients, 42% (95% CI 26%-57%),P < .001.
*Represents patient in Figure 4; **Represents patient in Figure 5.
(B) Cell kill diagram for the panel of 15 tested therapies across all 41 patients with patient numbers on the x-axis and cell kill on the y-axis. TMZ response (numbered as drug 1) and the therapy with the optimal response (highest cell kill) are shown in bold for every patient; other therapies are shown with their numbers faded.
1: Temodar; 2: Vincristine; 3: Carboplatin; 4: Cisplatin; 5: Etoposide; 6: Methotrexate; 7: Arabinocide-C; 8: Oxaliplatin; 9: Irinotecan; 10: Avastin; 11: BCNU; 12: CCNU; 13: Procarbazine; 14: Irinotecan + Avastin; 15: Procarbazine + Vincristine + CCNU.
Figure 4.

MRIs of partial response in a GBM of the frontal lobe in a patient treated with standard of care comprising maximal surgical resection and concurrent adjuvant TMZ/radiation therapy, and mean tumor volume of PDXs treated with i.p. injection of anticancer drugs.
Top shows the percent of cell kill determined by ChemoID assay on bulk of tumor and on CSC and the patient outcome summary at 12 months.
(A) Preoperative MRI shows an intraaxial enhancing mass centered in the left frontal lobe crossing the midline with a component of the mass within the left frontal lobe as well consistent with a butterfly lesion measuring 59.8 × 44.2 mm. There is a large amount of adjacent vasogenic edema and mass affect in both frontal lobes and mass affect upon both frontal lobes of the lateral ventricles with left to right midline shift with subfalcine herniation causing ventricular entrapment and ballooning/hydrocephalus of the right lateral ventricle.
(B) MRI at 6 months. There is regressing of the mass post–surgical resection with chemotherapy and radiation therapy with mild foci of rim enhancement in the tumor resection bed 6 months posttherapy measuring 5.4 mm anteriorly and 7.3 mm posteriorly, which could represent residual disease versus enhancement related to postradiation necrosis.
(C-D) MRI at 12 months. Clear recurrence in the tumor resection bed by 12 months evidenced by nodular enhancing foci in the posterior margin of the resection bed measuring 11.3 mm and 16.3 mm each. Linear dural enhancement is attributed to postsurgical enhancement from prior craniotomy.
(E-F) MRI at 18 months. Progression of recurrent disease at 18 months post–initial therapy with large enhancing irregular infiltrative mass measuring 43.9 mm × 43.0 mm at the level of the corpus callosum and more superiorly in the left frontal lobe measuring 51.4 × 30.0 mm in the tumor resection cavity crossing the midline involving both frontal lobes, left more so than right, and invading the anterior genu of the corpus callosum, again with mass affect on the frontal horns of both lateral ventricles.
(G) Line diagram of the mean volumes in mm3 (±SD) from weeks 2 to 8 of the PDX tumors in 10 NOD-Scid mice following 4 weeks of treatment with various anticancer drugs. The mean tumor volumes are indicated on the ordinate. Asterisks indicate weeks in which treatment was performed. On the right are indicated the different treatment arms. PBS: saline solution, negative control. TMZ (Temodar); Methotrexate (MTX). Irinotecan (CPT-11). Bevacizumab (Avastin). Irinotecan (CPT-11) + Bevacizumab (Avastin).
Figure 5.

MRIs of response in a multifocal GBM in a patient treated with standard of care comprising of diagnostic biopsy and concurrent adjuvant TMZ/radiation therapy, and mean tumor volume of PDXs treated with i.p. injection of anticancer drugs.
Top shows the percent of cell kill determined by ChemoID assay on bulk of tumor and on CSC and the patient outcome summary at 12 months.
(A-B) Preoperative MRI. Multifocal GBM multiforme with multiple infiltrative irregular enhancing masses in the left temporal lobe. Two target lesions are detailed in the left temporal lobe with the (target 1) more anterior of which measuring 19.8 mm in long axis and the (target 2) more posterior of which measuring 37.6 mm in long axis. Two adjacent target lesions in the left occipital lobe are referenced, one of which has a more cystic component (target 3) with thin rim enhancement measuring 23.5 × 16.9 mm with more solid enhancing nodular component (target 4) along the left anterior aspect of the lesion measuring 15.7 mm in long axis. Other smaller nontarget enhancing lesions are present in the left temporal lobe.
(C-D) MRI at 12 months. There is regression of the target and nontarget lesion post–surgical resection with adjunct chemotherapy and radiation 12 months later with target 1 measuring 12.4 mm in long axis, target 2 measuring 5.0 mm, target 3 measuring 17.9 mm in long axis, and target 4 measuring 8.2 mm.
(E) MRI at 36 months. Complete response at 3-yearfollow-up of therapy without residual enhancing tumor in all target and nontarget lesions.
(F) Line diagram of the mean volumes in mm3 (±SD) from weeks 2 to 8 of the PDX tumors in 10 NOD-Scid mice following 4 weeks of treatment with various anticancer drugs. The mean tumor volumes are indicated on the ordinate. Asterisks indicate weeks in which treatment was performed. On the right are indicated the different treatment arms. PBS: saline solution, negative control; TMZ (Temodar); Methotrexate (MTX); Irinotecan (CPT-11); Bevacizumab (Avastin); Irinotecan (CPT-11) + Bevacizumab (Avastin).
Figure 3B shows results for the entire panel of 15 tested therapies across all 41 patients with patient numbers on the x-axis and cell kill on the y-axis. TMZ response (numbered as drug 1) and the therapy with the optimal response (highest cell kill) are shown in bold for every patient; other therapies are shown with their numbers faded.
TMZ eliminated >40% of CSCs in only 15% of the 41 tested cases (i.e., it was predicted a priori as being ineffective for 85% of these patients), whereas TMZ killed >55% of bulk of tumor cells in 24% of the overall tested cases (i.e., predicted as ineffective in 76% of the cases).
Among all the tested drugs, BCNU killed >40% of CSCs in 36% of the 41 tested cases instead (i.e., it was ineffective in 63% of the cases) and eradicated >55% of bulk of tumor cells in 46% of the overall tested cases (i.e., it was ineffective in 54% of the cases).
With test results set on CSC at 40% cell kill (sensitive >40%), we found that, overall, 85% of CSCs were resistant to TMZ; 100% to Vincristine; 100% to Carboplatin; 98% to Etoposide; 95% to Oxaliplatin; 63% to BCNU; 93% to CCNU; 96% to Procarbazine; and 80% to a combination of Procarbazine, Vincristine, and CCNU (Figure 3, A and B).
With test results set on bulk of tumor at 55% cell kill (sensitive >55%), we found that, overall, 76% of bulk tumor cells were resistant to TMZ; 100% to Vincristine; 100% to Carboplatin; 100% to Etoposide; 95% to Oxaliplatin; 54% to BCNU; 95% to CCNU; 98% to Procarbazine; and 85% to a combination of Procarbazine, Vincristine, and CCNU (Figure 3, A and B).
Collectively, these results suggest that although cross-resistance is considered to be common in GBM, a number of patients (over 37%) may have had benefit from assay-informed individualized chemotherapy leading to different therapy rather than first-line TMZ.
Drug Response Assay and PDX Chemotherapy Response
The efficacy of several chemotherapies (including Temodar), which were screened in vitro by the ChemoID assay, was tested on PDXs generated by injecting CSCs in immune-deficient NOD-Scid mice (Table 4, Figures 4 and 5).
Table 4.
Percentage Cell Kill Determined by the ChemoID Drug Response Assay on a Panel of 13 Single Drugs and 2 Drug Combinations
| Patient Figure 4 |
Patient Figure 5 |
|||
|---|---|---|---|---|
| % Cell Kill | % Cell Kill | % Cell Kill | % Cell Kill | |
| Bulk of Tumor | CSCs | Bulk of Tumor | CSCs | |
| Temodar | 52.5 ± 3 | 4.2 ± 1 | 60 ± 3 | 64.8 ± 1 |
| Vincristine | 18.4 ± 2 | 2.1 ± 2 | 13.0 ± 1 | 2 ± 1 |
| Carboplatin | 16.3 ± 4 | 1.5 ± 2 | 16.2 ± 3 | 0 |
| Cisplatin | 34.9 ± 2 | 26.3 ± 3 | 17.2 ± 2 | 21.9 ± 2 |
| Etoposide | 16.5 ± 2 | 8.8 ± 2 | 8.3 ± 1 | 3.8 ± 2 |
| Methotrexate (MTX) | 33.1 ± 1 | 17.8 ± 2 | 25.3 ± 4 | 6.5 ± 2 |
| Arabinocide-C | 29.9 ± 2 | 23.0 ± 2 | 37.5 ± 2 | 0 |
| Oxaliplatin | 32.3 ± 3 | 20.1 ± 3 | 41.7 ± 2 | 13.5 ± 2 |
| Irinotecan (CPT-11) | 32.8 ± 2 | 25.4 ± 1 | 45.5 ± 2 | 43.6 ± 3 |
| Avastin | 19.5 ± 2 | 8.4 ± 1 | 14.4 ± 1 | 0.8 ± 1 |
| BCNU | 35.3 ± 2 | 38.4 ± 2 | 33.5 ± 3 | 22.3 ± 1 |
| CCNU | 11.3 ± 1 | 15.0 ± 3 | 17.2 ± 1 | 16.7 ± 2 |
| Procarbazine | 15.3 ± 3 | 11.4 ± 2 | 44.6 ± 1 | 35.4 ± 2 |
| Irinotecan + Avastin | 39.9 ± 1 | 37.4 ± 2 | 52.1 ± 3 | 30.2 ± 3 |
| Procarbazine + Vincristine + CCNU | 27.6 ± 3 | 22 ± 1 | 44.6 ± 2 | 30.4 ± 2 |
The GBM CSCs from two patients, one identified as resistant to TMZ (Table 4, Figure 4) and one as sensitive (Table 4, Figure 5) by the ChemoID assay, were xenografted in the flank of 10 immune-deficient NOD-Scid mice/experimental group by injecting 1 × 10⁶GBM CSCs mixed to 100 μl of Matrigel (BD Biosciences, San Jose, CA). PDXs were grown to 100 mm3. Randomized mice were treated with weekly i.p. injections of the different treatment arms for 4 weeks and were observed for 4 more weeks. Group 1, serving as a control, received i.p. sterile saline injections. Groups 2 to 6 were the experimental groups that received i.p. injections of the least effective chemotherapy, or the most effective, the second most effective, and the most effective combinatorial chemotherapy, as determined by the ChemoID drug response assay.
As expected, TMZ treatment of PDX from a patient whose bulk of tumor cells was found to be sensitive to TMZ by the ChemoID assay, but contained instead CSCs resistant to TMZ, showed initial tumor regression followed by tumor regrowth after therapy cessation (Table 4, Figure 4). We also observed that tumor xenografts in mice injected with the least effective chemotherapy as determined by the ChemoID drug response assay grew faster than any other treatment other than the saline control–injected mice (Table 4, Figure 4). Additionally, we found that the best response was observed in the mice treated with the combination of Irinotecan (CPT-11) and Avastin that was determined as the best treatment by the ChemoID drug response assay.
We have observed instead prolonged tumor regression following TMZ treatment of NOD-Scid mice bearing PDX from a patient whose both bulk of tumor cells and CSCs was sensitive to TMZ, confirming the clinical observation that TMZ was an effective anticancer drug for this individual GBM patient (Table 4, Figure 5). Collectively, these in vivo data confirmed both the clinical observation and the indication provided by the ChemoID assay.
Discussion
Medical management of newly diagnosed GBMis typically a multimodal treatment plan constituted by surgical resection (when possible) followed by radiotherapy with concomitant and adjuvant TMZ [1], [40]. However, the management of GBMs remains difficult in that no contemporary therapies are curative. In fact, despite maximal treatment, recurrence is nearly universal [3].
TMZ has become a key component of standard therapy for GBM patients following several studies which showed increased median survival of 2.2 months over combination of surgery and radiation therapy [2]. As with radiation treatment, however, sensitivity of GBM tumors to TMZ is as variable as the genetic signature of these GBMs. Similarly, a more recent population-based study analysis conducted on progressive GBM showed that Bevacizumab (Avastin) increased the median survival by 1 month with respect to other treatments administered [41].
The major problem with GBM treatment is that several of the different clinically acceptable and equivalent treatment choices are identified in current treatment guidelines [42], with insufficient evidence to indicate that any one agent is superior to any other. Additionally, in GBM, although some biomarkers have been studied [43], [44], [45], [46], there are still some controversial data on their validation to stratify patients for individualized treatment choices, and population-based studies continue to be the primary source of information for physicians’ empiric treatment decisions.
Intratumoral heterogeneity appears to be responsible, at least in part, for resistance to standard treatments and the variable responses seen to treatment, and it has important implications for the development of prognostic and predictive biomarkers and their ability to guide personalized treatment regimens. [47]. Spatial heterogeneity in GBM can make treatment decisions based on samples obtained from limited areas difficult, especially when we enter the realm of personalized medicine. Sampling of brain tumors presents a challenge that is unique. In fact, extracranial tumors can be resected en bloc, thereby preserving the spatial heterogeneity from which multiple biopsies can be obtained. However, some gliomas are located in eloquent areas of the brain, which limits the surgeon's ability to obtain multiple samples. Additionally, larger gliomas are generally resected in a piecemeal fashion to minimize damage to surrounding brain and preserve function and quality of life of the individual. Although major advances in sequencing approaches are enabling tumor heterogeneity to be studied at unprecedented resolution, the interpretation of genomic data analysis is still evolving, with the detection and the clinical significance of genetic changes still in question. However, it is likely that a substantial fraction of heterogeneity seen in tumors can arise from phenotypic plasticity and differentiation of CSCs and can have profound implications for both tumor development and therapeutic outcomes. ChemoID is a functional test that uses patient's live tumor cells and CSCs isolated by multiple tumor biopsies to indicate which chemotherapy agent (or “combinations”) is more effective. Targeting of CSCs alongside the bulk of other cancer cells is a new paradigm in cancer treatment. This constitutes an important advantage of ChemoID approach over other diagnostic methods for personalized medicine.
The current study evaluated the correlation of CSCs and bulk of tumor cells chemoresponse assay results of GBM patients to treatment outcomes independently of other biomarkers, with assay results blinded to treating physicians. All patients were treated with maximal surgical resection, during which multiple biopsies were obtained for the ChemoID assay when possible, followed by concurrent adjuvant TMZ/radiotherapy.
This study demonstrates for the first time in GBM patients that a drug response assay such as ChemoID, which is directed to test the sensitivity of CSCs toward chemotherapies, correctly identified patients who would receive a benefit from certain chemotherapy versus other possible choices. In fact, panel results across 15 chemotherapy treatments indicated that therapies potentially more optimal than TMZ could have been chosen in 34/41 (83%) patients using CSC results and 27/41 (66%) patients using bulk tumor results. Importantly, the CSC test identified a different potential optimal therapy than the bulk test in 17/41 patients, 42% (95% CI 26%-57%),P < .001, suggesting that ChemoID could be a useful tool for optimizing anticancer treatment selection.
This study reveals that patients who were treated with a TMZ-sensitive regimen had an improvement in their time to recurrence compared to patients who were treated with assay-resistant regimens (Figure 1, Figure 2, Figure 4 and 5; Tables 2 and 4).
These observations were additionally confirmed by animal studies in which the efficacy of several chemotherapies (including Temodar) that were screened by the ChemoID assay was tested on PDXs generated by injecting the patients' tumor cells in immune-deficient NOD-Scid mice (Figures 4 and 5). In fact, as expected, TMZ treatment of PDX from a patient whose bulk of tumor cells was found sensitive to TMZ by the ChemoID assay, but in addition contained CSCs resistant to TMZ, showed initial tumor regression followed by tumor regrowth after therapy cessation (Figure 4, Table 4), indicating that the CSCs, which were resistant to therapy, efficiently repopulated the tumor in mice, thereby mimicking the clinical observation. This study accurately predicted that the patient depicted in Figure 4 would relapse because the CSCs would not be affected by the TMZ treatment, thereby causing the CSCs to reinitiate the tumor.
We observed instead prolonged tumor regression following TMZ treatment of those NOD-Scid mice bearing PDX from a patient whose both bulk of tumor cells and CSCs were sensitive to TMZ, confirming the clinical observation that TMZ was an effective anticancer drug for this individual GBM patient (Figure 5, Table 4). Collectively, thesein vivo data confirmed not only the clinical observation but also the indication provided by the ChemoID assay.
These outcomes were also challenged by using NOD-Scid mice xenografts following treatments with the most effective, the second most effective, and the most effective combinatorial chemotherapy, as determined by the ChemoID drug response assay. Results from tumor xenografts generated by injecting the enriched GBM CSCs in the flank of NOD-Scid mice, followed by treatment with select chemotherapies, were also found to be in agreement with the ChemoID prediction (Figures 4 and 5,Table 4).
These data demonstrate the importance of determining the sensitivity of CSCs to chemotherapy and their role in predicting patient tumor response following chemotherapy. The data further support the belief that long-term tumor response in GBM is in fact more dependent on the intrinsic sensitivity or resistance of the CSC population than the general bulk tumor cell population and needs to be closely studied to determine how this population can be targeted for therapy. More clinical studies with a larger number of patients are needed to determine the clinical and economic implications of this novel test. This method of determining the sensitivity of CSCs to available FDA-approved chemotherapies for the treatment of various cancers may provide critical information about an individual patient's likelihood to achieve a durable tumor response before implementing the patient's treatment plan. The ChemoID assay takes 21 days to be completed from receiving a live biopsy, which corresponds to an average time that patients spend recovering from surgery prior to continuing further therapy and which is therefore suitable to timely guide chemotherapy for cancer patients who received surgery.
An important observation of clinical significance that our study showed was that in patients whose CSCs had >40% cell kill to TMZ, the median time to recurrence was 20 months versus 3 months when <40% cell kill was observed and that in patients whose bulk of tumor showed >55% cell kill to TMZ, the median time to recurrence was 13 months versus 4 months when <55% cell kill was observed. The significant improvement (P = .016) in time to recurrence we observed represents a difference of 17 months in median time between patients treated with TMZ-sensitive (>40% cell kill) versus -insensitive (<40% cell kill) CSCs and a difference of 9 months when bulk of tumor cells was considered instead.
Importantly, the ChemoID assay on CSCs demonstrated a sensitivity of 100% and a specificity of 97%, whereas the same test on bulk of tumor demonstrated a sensitivity of 100% but a specificity of only 89% (Table 2 and Figure 1). Notably, the test yielded only one false negative when considering CSCs but four false negatives when considering the bulk of tumor population. Our analysis of the data using a model of separate logistic regression for CSCs or bulk found that with a positive test threshold set at 40% cell kill for CSCs and 55% for bulk of tumor, for every 5% increase in cell kill, there was a statistically significant 2.2-fold increase in patient response (nonrecurrence of cancer) at 12 months for the CSC test (Table 2) but not for the bulk of tumor test. When the CSC and bulk test results were analyzed together in a single, multivariate model, the CSC test again showed a statistically supported OR of 2.36 versus a nonsignificant OR of 1.46 for bulk of tumor, indicating that the analysis of the drug response assay on CSCs provided additional and valuable information that can significantly increase the quality of life of these patients.
Because we found in our analysis that, according to the bulk test result, a select number of patients should have responded to TMZ but instead did not respond, we analyzed how much improvement there would be in the risk categorization of those patients who had a negative test for CSC (<40% cell kill) but a positive test for bulk of tumor (>55% cell kill) and found that, by using the CSCs results, we could correctly reclassify 11% of nonresponding patients (P = .030) (Table 3), again indicating that the analysis of the drug response assay on CSCs provided additional and more valuable information than the bulk test alone that can be used for personalized treatment, hopefully to obtain more durable responses and to increase the quality of life of these patients.
Another aspect to note in our study is that we also estimated with the ChemoID assay the proportion of patients who could have had the benefit of a sensitive treatment chosen prospectively, other than TMZ, by screening second-line drugs used in the therapy of high-grade gliomas. Figure 3A shows a pyramid diagram representation of the comparison in percent cell kill of the most cytotoxic drug from a panel of eight second-line chemotherapies compared to TMZ, and Figure 3B indicates the most effective single drug or drug combination compared to TMZ.
In Figure 3A are depicted several cases in which the ChemoID assay found for bulk of tumor cells and/or CSCs other treatments than TMZ that could have been used as a substitute or in combination with TMZ to obtain more durable response in these individual patients. CSC results outlined in red show patients whose CSC test identified an optimal therapy that was different than the optimal therapy identified by the bulk test. Interestingly, CSC results identified a more optimal therapy than TMZ in 34/41 patients (83%), and bulk tumor results identified a more optimal therapy than TMZ in 27/41 patients (66%). The CSC test identified a different optimal therapy than the bulk test in 17/41 patients, 42% (95% CI 26%-57%) P < .001. In Figure 3A, the single asterisk (*) indicates patient represented in Figure 4 and Table 4, who had a partial response and recurred within 12 months from treatment initiation. Interestingly, for this patient,although TMZ was the best option for bulk of tumor cells, BCNU was instead indicated by the ChemoID assay on CSCs, indicating that possibly the combination of TMZ and BCNU could have resulted in better outcome for this individual patient. The double asterisks (**) instead indicate patient in Figure 5 and Table 4 for whom TMZ was the best option for both bulk of tumor and CSCs. In general, we found in our study that for several of our patients who were treated with TMZ, a second-line therapy could have been more effective than the TMZ regimen. In fact, TMZ was found effective on CSCs by the ChemoID assay (>40% cell kill) in only 15% of the 41 tested cases, whereas TMZ killed >55% of bulk of tumor cells in 24% of the overall tested cases. However, individually, the ChemoID assay in several cases was able to pinpoint another drug among the several second-line therapies available for gliomas that individually decreased more efficiently the survival of the glioma cells tested. Collectively, these results suggest that although cross-resistance has been considered to be common in GBM, a number of patients (over 37%) may have had benefit from assay-informed individualized chemotherapy leading to different therapy choices rather than first-line TMZ.
Any drug response assay — molecular or cellular — is only as good as the drugs that are available. A diagnostic test may be effective in predicting chemotherapy response; nevertheless, it will not improve the results of a poorly chosen therapeutic option. Unfortunately, cytotoxic chemotherapy is not yet good enough to provide a cure for most patients with GBM, particularly for those with TMZ resistance. Overcoming this adaptation has been the challenge for this disease and the reason for its dismal prognosis, but the development of modulating agents for drug-resistance mechanisms is feasible and should add to the therapeutic index in GBM.
In conclusion, this prospective study showed statistically significant improved response rate (2.2-fold increase) in patients who were given assay-indicated chemotherapy. Larger trials will potentially provide additional statistical proof of assay-directed therapy versus empirical physician choice to determine the validity of ChemoID drug response assay directed toward CSCs, which contribute to tumor propagation, maintenance, and treatment resistance.
Our results differ from other studies previously conducted in several types of solid tumors that consisted of drug sensitivity assays based only on bulk of tumor cells. ChemoID is the first and only drug response assay available in the clinics that examineCSCs from solid tumors. Results from this study indicate that a drug response assay that targets CSCs may be a very useful tool for optimizing treatment selection when first-line therapy fails and when there are multiple clinically acceptable and equivalent treatments available. Furthermore, the results suggest that individualized functional drug response assays may provide more treatment options with improved outcomes for many more patients than are currently achieved by empiric population-based treatment. These compelling data suggest also that it may be reasonable to prospectively utilize functional testing with drug response assays such as ChemoID to assist clinicians in the optimal prioritization of therapy for GBM patients.
Declarations
Ethics Approval and Consent to Participate
Marshall University IRB has approved this research under protocol #326290. Participants provided their written consent on an IRB-approved informed consent form to participate in this study after being educated about the research protocol. Ethics committees/IRB at Marshall University approved this consent procedure. Assay was performed after obtaining patients' written informed consent in accordance with the ethical standards of the Helsinki Declaration (1964, amended most recently in 2008) of the World Medical Association.
Animal studies were conducted under the Marshall University–approved IACUC animal protocol #373017.
Consent for Publication
Not applicable.
Availability of Data and Material
The data sets generated and/or analyzed during the current study are not publicly available because of individual privacy restriction on medical records but are available from the corresponding author on reasonable request.
The following is the supplementary data related to this article.
Estimated hazard Ratios for Secondary Time to Event Outcomes for the Individual and Combined CSC and Bulk Tumor TMZ Assay Results
Competing Interests
The authors declare that they have no competing interests.
Funding Acknowledgements
This research was in part supported by funds from the Neuroscience Department at Marshall University, the BioMolecular Department, and the Center for Natural Product Research at the University of Mississippi. This research was also supported by grants from NASA, Marshall University (Translational Research Award), and the National Institutes of Health through grant UL1TR000117. The content is solely the responsibility of the authors and does not necessarily represent the official views of the National Institutes of Health.
Authors’ Contributions
All authors contributed significantly to the present research and reviewed the entire manuscript.
C. M. H.: participated substantially in conception and execution of the study and in the analysis and interpretation of data; also participated substantially in the drafting and editing of the manuscript.
J. V.: participated substantially in conception and execution of the study and in the analysis and interpretation of data; also participated substantially in the drafting and editing of the manuscript.
A. A.: participated substantially in providing patients' samples and in the analysis and interpretation of data; also participated substantially in the drafting and editing of the manuscript.
T. J.: participated substantially in providing patients' samples and in the analysis and interpretation of data; also participated substantially in the drafting and editing of the manuscript.
R. i. M.: participated substantially in providing patients' samples and in the analysis and interpretation of data; also participated substantially in the drafting and editing of the manuscript.
R. o. M.: participated substantially in providing patients' samples and in the analysis and interpretation of data; also participated substantially in the drafting and editing of the manuscript.
H. A.: participated substantially in providing patients' samples and in the analysis and interpretation of data; also participated substantially in the drafting and editing of the manuscript.
A. C.: participated substantially in providing patients' samples and in the analysis and interpretation of data; also participated substantially in the drafting and editing of the manuscript.
M. G.: participated substantially in analysis and interpretation of data; also participated substantially in the drafting and editing of the manuscript.
W. W.: participated substantially in providing patients' samples and in the analysis and interpretation of data.
K. D.: participated substantially in providing patients' samples and in the analysis and interpretation of data;
L. B.: participated substantially in providing patients' samples and in the analysis and interpretation of data;
P. P. C.: participated substantially in conception and execution of the study and in the analysis and interpretation of data; also participated substantially in the drafting and editing of the manuscript.
Acknowledgements
We gratefully acknowledge Sarah Mathis, Logan Lawrence, and Rounak Nande for technical assistance.
References
- 1.Delgado-Lopez PD, Corrales-Garcia EM. Survival in glioblastoma: a review on the impact of treatment modalities. Clin Transl Oncol. 2016;11:1062–1071. doi: 10.1007/s12094-016-1497-x. [DOI] [PubMed] [Google Scholar]
- 2.Johnson DR, O'Neill BP. Glioblastoma survival in the United States before and during the temozolomide era. J Neurooncol. 2012;107(2):359–364. doi: 10.1007/s11060-011-0749-4. [DOI] [PubMed] [Google Scholar]
- 3.Sundar SJ, Hsieh JK, Manjila S, Lathia JD, Sloan A. The role of cancer stem cells in glioblastoma. Neurosurg Focus. 2014;37(6) doi: 10.3171/2014.9.FOCUS14494. [DOI] [PubMed] [Google Scholar]
- 4.Theeler BJ, Gilbert MR. Advances in the treatment of newly diagnosed glioblastoma. BMC Med. 2015;13:293. doi: 10.1186/s12916-015-0536-8. [DOI] [PMC free article] [PubMed] [Google Scholar]
- 5.Steffens R, Semrau S, Lahmer G, Putz F, Lettmaier S, Eyupoglu I, Buchfelder M, Fietkau R. Recurrent glioblastoma: who receives tumor specific treatment and how often? J Neurooncol. 2016;128(1):85–92. doi: 10.1007/s11060-016-2079-z. [DOI] [PubMed] [Google Scholar]
- 6.Mathis SE, Alberico A, Nande R, Neto W, Lawrence L, McCallister DR, Denvir J, Kimmey GA, Mogul M, Oakley G., III Chemo-predictive assay for targeting cancer stem-like cells in patients affected by brain tumors. PLoS One. 2014;9(8) doi: 10.1371/journal.pone.0105710. [DOI] [PMC free article] [PubMed] [Google Scholar]
- 7.Pan ST, Li ZL, He ZX, Qiu JX, Zhou SF. Molecular mechanisms for tumor resistance to chemotherapy. Clin Exp Pharmacol Physiol. 2016;8:723–737. doi: 10.1111/1440-1681.12581. [DOI] [PubMed] [Google Scholar]
- 8.Brower SL, Fensterer JE, Bush JE. The ChemoFx assay: an ex vivo chemosensitivity and resistance assay for predicting patient response to cancer chemotherapy. Methods Mol Biol. 2008;414:57–78. doi: 10.1007/978-1-59745-339-4_6. [DOI] [PubMed] [Google Scholar]
- 9.Ochs RL, Burholt D, Kornblith P. The ChemoFx assay: an ex vivo cell culture assay for predicting anticancer drug responses. Methods Mol Med. 2005;110:155–172. doi: 10.1385/1-59259-869-2:155. [DOI] [PubMed] [Google Scholar]
- 10.Breidenbach M, Rein DT, Mallmann P, Kurbacher CM. Individualized long-term chemotherapy for recurrent ovarian cancer after failing high-dose treatment. Anticancer Drugs. 2002;13(2):173–176. doi: 10.1097/00001813-200202000-00010. [DOI] [PubMed] [Google Scholar]
- 11.Ballard KS, Tedjarati SS, Robinson WR, Homesley HD, Thurston EL. Embryonal rhabdomyosarcoma: adjuvant and ex vivo assay-directed chemotherapy. Int J Gynecol Cancer. 2010;20(4):561–563. doi: 10.1111/IGC.0b013e3181d320dd. [DOI] [PubMed] [Google Scholar]
- 12.Gallion H, Christopherson WA, Coleman RL, DeMars L, Herzog T, Hosford S, Schellhas H, Wells A, Sevin BU. Progression-free interval in ovarian cancer and predictive value of an ex vivo chemoresponse assay. Int J Gynecol Cancer. 2006;16(1):194–201. doi: 10.1111/j.1525-1438.2006.00301.x. [DOI] [PubMed] [Google Scholar]
- 13.Herzog TJ, Krivak TC, Fader AN, Coleman RL. Chemosensitivity testing with ChemoFx and overall survival in primary ovarian cancer. Am J Obstet Gynecol. 2010;203(1):68.e61–68.e66. doi: 10.1016/j.ajog.2010.01.059. [DOI] [PubMed] [Google Scholar]
- 14.Huh WK, Cibull M, Gallion HH, Gan CM, Richard S, Cohn DE. Consistency of in vitro chemoresponse assay results and population clinical response rates among women with endometrial carcinoma. Int J Gynecol Cancer. 2011;21(3):494–499. doi: 10.1097/IGC.0b013e31820c4cb5. [DOI] [PubMed] [Google Scholar]
- 15.Ness RB, Wisniewski SR, Eng H, Christopherson W. Cell viability assay for drug testing in ovarian cancer: in vitro kill versus clinical response. Anticancer Res. 2002;22(2B):1145–1149. [PubMed] [Google Scholar]
- 16.Rice SD, Cassino TR, Sakhamuri L, Song N, Williams KE, Brower SL. An in vitro chemoresponse assay defines a subset of colorectal and lung carcinomas responsive to cetuximab. Cancer Biol Ther. 2011;11(2):196–203. doi: 10.4161/cbt.11.2.13701. [DOI] [PubMed] [Google Scholar]
- 17.Rice SD, Heinzman JM, Brower SL, Ervin PR, Song N, Shen K, Wang D. Analysis of chemotherapeutic response heterogeneity and drug clustering based on mechanism of action using an in vitro assay. Anticancer Res. 2010;30(7):2805–2811. [PubMed] [Google Scholar]
- 18.Antoniou A, Hebrant A, Dom G, Dumont JE, Maenhaut C. Cancer stem cells, a fuzzy evolving concept: a cell population or a cell property? Cell Cycle. 2013;12(24):3743–3748. doi: 10.4161/cc.27305. [DOI] [PMC free article] [PubMed] [Google Scholar]
- 19.Coskun V, Wu H, Blanchi B, Tsao S, Kim K, Zhao J, Biancotti JC, Hutnick L, Krueger RC, Jr., Fan G. CD133+ neural stem cells in the ependyma of mammalian postnatal forebrain. Proc Natl Acad Sci U S A. 2008;105(3):1026–1031. doi: 10.1073/pnas.0710000105. [DOI] [PMC free article] [PubMed] [Google Scholar]
- 20.Dirks PB. Brain tumor stem cells: bringing order to the chaos of brain cancer. J Clin Oncol. 2008;26(17):2916–2924. doi: 10.1200/JCO.2008.17.6792. [DOI] [PubMed] [Google Scholar]
- 21.Lathia JD, Hitomi M, Gallagher J, Gadani SP, Adkins J, Vasanji A, Liu L, Eyler CE, Heddleston JM, Wu Q. Distribution of CD133 reveals glioma stem cells self-renew through symmetric and asymmetric cell divisions. Cell Death Dis. 2011;2 doi: 10.1038/cddis.2011.80. [DOI] [PMC free article] [PubMed] [Google Scholar]
- 22.Singh SK, Clarke ID, Terasaki M, Bonn VE, Hawkins C, Squire J, Dirks PB. Identification of a cancer stem cell in human brain tumors. Cancer Res. 2003;63(18):5821–5828. [PubMed] [Google Scholar]
- 23.Singh SK, Hawkins C, Clarke ID, Squire JA, Bayani J, Hide T, Henkelman RM, Cusimano MD, Dirks PB. Identification of human brain tumour initiating cells. Nature. 2004;432(7015):396–401. doi: 10.1038/nature03128. [DOI] [PubMed] [Google Scholar]
- 24.Deng J, Gao G, Wang L, Wang T, Yu J, Zhao Z. CD24 expression as a marker for predicting clinical outcome in human gliomas. J Biomed Biotechnol. 2012;2012:517172. doi: 10.1155/2012/517172. [DOI] [PMC free article] [PubMed] [Google Scholar]
- 25.Ranuncolo SM, Ladeda V, Specterman S, Varela M, Lastiri J, Morandi A, Matos E, Bal de Kier Joffe E, Puricelli L, Pallotta MG. CD44 expression in human gliomas. J Surg Oncol. 2002;79(1):30–35. doi: 10.1002/jso.10045. [discussion 35-36] [DOI] [PubMed] [Google Scholar]
- 26.Ehtesham M, Mapara KY, Stevenson CB, Thompson RC. CXCR4 mediates the proliferation of glioblastoma progenitor cells. Cancer Lett. 2009;274(2):305–312. doi: 10.1016/j.canlet.2008.09.034. [DOI] [PMC free article] [PubMed] [Google Scholar]
- 27.Fareh M, Turchi L, Virolle V, Debruyne D, Almairac F, de-la-Forest Divonne S, Paquis P, Preynat-Seauve O, Krause KH, Chneiweiss H. The miR 302-367 cluster drastically affects self-renewal and infiltration properties of glioma-initiating cells through CXCR4 repression and consequent disruption of the SHH-GLI-NANOG network. Cell Death Differ. 2012;19(2):232–244. doi: 10.1038/cdd.2011.89. [DOI] [PMC free article] [PubMed] [Google Scholar]
- 28.Balik V, Mirossay P, Bohus P, Sulla I, Mirossay L, Sarissky M. Flow cytometry analysis of neural differentiation markers expression in human glioblastomas may predict their response to chemotherapy. Cell Mol Neurobiol. 2009;29(6–7):845–858. doi: 10.1007/s10571-009-9366-6. [DOI] [PubMed] [Google Scholar]
- 29.Ashizawa T, Miyata H, Iizuka A, Komiyama M, Oshita C, Kume A, Nogami M, Yagoto M, Ito I, Oishi T. Effect of the STAT3 inhibitor STX-0119 on the proliferation of cancer stem-like cells derived from recurrent glioblastoma. Int J Oncol. 2013;43(1):219–227. doi: 10.3892/ijo.2013.1916. [DOI] [PubMed] [Google Scholar]
- 30.Higgins DM, Wang R, Milligan B, Schroeder M, Carlson B, Pokorny J, Cheshier SH, Meyer FB, Weissman IL, Sarkaria JN. Brain tumor stem cell multipotency correlates with nanog expression and extent of passaging in human glioblastoma xenografts. Oncotarget. 2013;4(5):792–801. doi: 10.18632/oncotarget.1059. [DOI] [PMC free article] [PubMed] [Google Scholar]
- 31.Cortese A, Pantaleo G, Amato M, Lawrence L, Mayes V, Brown L, Sarno MR, Valluri J, Claudio PP. A new complementary procedure for patients affected by head and neck cancer: chemo-predictive assay. Int J Surg Case Rep. 2016;26:42–46. doi: 10.1016/j.ijscr.2016.07.013. [DOI] [PMC free article] [PubMed] [Google Scholar]
- 32.Kelly SE, Di Benedetto A, Greco A, Howard CM, Sollars VE, Primerano DA, Valluri JV, Claudio PP. Rapid selection and proliferation of CD133+ cells from cancer cell lines: chemotherapeutic implications. PLoS One. 2010;5(4) doi: 10.1371/journal.pone.0010035. [DOI] [PMC free article] [PubMed] [Google Scholar]
- 33.Claudio PP, Mathis SE, Nande R, Lawrence L, Alberico A, Julien TJ, Mazagri RS, Marsh R, Muizelaar P, Denning KL. Vol. 33. 2015. ChemoID Assay for Glioblastoma. (ASCO Annual Meeting). [Chicago] [Google Scholar]
- 34.Claudio PP, Mathis SE, Nande R, Alberico A, Neto W, Lawrence L, Denvir J, Kimmey G, Chowdhari A, Tirona MRBT. Vol. 32. 2014. Novel Chemosensitivity Assay for Targeting Cancer Stem-Like Cells in Brain Tumors; p. e13102. (ASCO Annual Meeting). [Chicago] [Google Scholar]
- 35.Claudio PP, Valluri J, Mathis SE, Alberico A, Alberico T, Denvir J, Kimmey GA, Mogul MJ, Sehgal R, Chowdhary AA. Vol. 31. 2013. Chemopredictive Assay for Patients with Primary Brain Tumors. (ASCO Annual Meeting). [abstr 2089. Chicago] [Google Scholar]
- 36.Wen PY, Macdonald DR, Reardon DA, Cloughesy TF, Sorensen AG, Galanis E, Degroot J, Wick W, Gilbert MR, Lassman AB. Updated response assessment criteria for high-grade gliomas: response assessment in neuro-oncology working group. J Clin Oncol. 2010;28(11):1963–1972. doi: 10.1200/JCO.2009.26.3541. [DOI] [PubMed] [Google Scholar]
- 37.Chinot OL, Macdonald DR, Abrey LE, Zahlmann G, Kerloeguen Y, Cloughesy TF. Response assessment criteria for glioblastoma: practical adaptation and implementation in clinical trials of antiangiogenic therapy. Curr Neurol Neurosci Rep. 2013;13(5):347. doi: 10.1007/s11910-013-0347-2. [DOI] [PMC free article] [PubMed] [Google Scholar]
- 38.van den Bent MJ, Wefel JS, Schiff D, Taphoorn MJ, Jaeckle K, Junck L, Armstrong T, Choucair A, Waldman AD, Gorlia T. Response assessment in neuro-oncology (a report of the RANO group): assessment of outcome in trials of diffuse low-grade gliomas. Lancet Oncol. 2011;12(6):583–593. doi: 10.1016/S1470-2045(11)70057-2. [DOI] [PubMed] [Google Scholar]
- 39.Reagan-Shaw S, Nihal M, Ahmad N. Dose translation from animal to human studies revisited. FASEB J. 2008;22(3):659–661. doi: 10.1096/fj.07-9574LSF. [DOI] [PubMed] [Google Scholar]
- 40.Sanchez LM. Glioblastoma: multidisciplinary treatment approaches. Appl Radiat Oncol. 2016;(March):17–25. [Google Scholar]
- 41.Johnson DR, Leeper HE, Uhm JH. Glioblastoma survival in the United States improved after Food and Drug Administration approval of bevacizumab: a population-based analysis. Cancer. 2013;119(19):3489–3495. doi: 10.1002/cncr.28259. [DOI] [PubMed] [Google Scholar]
- 42.NCCN adult brain tumor practice guidelinesOncology (Williston Park) 1997;11(11A):237–277. [PubMed] [Google Scholar]
- 43.Berghoff AS, Stefanits H, Heinzl H, Preusser M. Clinical Neuropathology Practice News 4-2012: levels of evidence for brain tumor biomarkers. Clin Neuropathol. 2012;31(4):206–209. doi: 10.5414/NP300511. [DOI] [PMC free article] [PubMed] [Google Scholar]
- 44.Labussiere M, Sanson M, Idbaih A, Delattre JY. IDH1 gene mutations: a new paradigm in glioma prognosis and therapy? Oncologist. 2010;15(2):196–199. doi: 10.1634/theoncologist.2009-0218. [DOI] [PMC free article] [PubMed] [Google Scholar]
- 45.Combs SE, Rieken S, Wick W, Abdollahi A, von Deimling A, Debus J, Hartmann C. Prognostic significance of IDH-1 and MGMT in patients with glioblastoma: one step forward, and one step back? Radiat Oncol. 2011;6:115. doi: 10.1186/1748-717X-6-115. [DOI] [PMC free article] [PubMed] [Google Scholar]
- 46.Ichimura K, Pearson DM, Kocialkowski S, Backlund LM, Chan R, Jones DT, Collins VP. IDH1 mutations are present in the majority of common adult gliomas but rare in primary glioblastomas. Neuro Oncol. 2009;11(4):341–347. doi: 10.1215/15228517-2009-025. [DOI] [PMC free article] [PubMed] [Google Scholar]
- 47.Parker NR, Hudson AL, Khong P, Parkinson JF, Dwight T, Ikin RJ, Zhu Y, Cheng ZJ, Vafaee F, Chen J. Intratumoral heterogeneity identified at the epigenetic, genetic and transcriptional level in glioblastoma. Sci Rep. 2016;6:22477. doi: 10.1038/srep22477. [DOI] [PMC free article] [PubMed] [Google Scholar]
Associated Data
This section collects any data citations, data availability statements, or supplementary materials included in this article.
Supplementary Materials
Estimated hazard Ratios for Secondary Time to Event Outcomes for the Individual and Combined CSC and Bulk Tumor TMZ Assay Results