

Abstract
The effect of global climate change on infectious disease remains hotly debated because multiple extrinsic and intrinsic drivers interact to influence transmission dynamics in nonlinear ways. The dominant drivers of widespread pathogens, like West Nile virus, can be challenging to identify due to regional variability in vector and host ecology, with past studies producing disparate findings. Here, we used analyses at national and state scales to examine a suite of climatic and intrinsic drivers of continental-scale West Nile virus epidemics, including an empirically derived mechanistic relationship between temperature and transmission potential that accounts for spatial variability in vectors. We found that drought was the primary climatic driver of increased West Nile virus epidemics, rather than within-season or winter temperatures, or precipitation independently. Local-scale data from one region suggested drought increased epidemics via changes in mosquito infection prevalence rather than mosquito abundance. In addition, human acquired immunity following regional epidemics limited subsequent transmission in many states. We show that over the next 30 years, increased drought severity from climate change could triple West Nile virus cases, but only in regions with low human immunity. These results illustrate how changes in drought severity can alter the transmission dynamics of vector-borne diseases.
Keywords: vector-borne disease, nonlinear temperature–disease relationship, Culex, disease ecology, global warming
1. Background
Climate change and emerging infectious diseases are predicted to have substantial impacts on human health [1,2]. However, predictions about how these threats will interact and where disease risk will be greatest have been the subject of substantial controversy [2–5]. Warming is most likely to increase disease risk in places where transmission is primarily limited by low temperatures [3–5]. However, public health efforts may limit the effects of climate on disease risk [6]. Similarly, precipitation and drought can have contrasting effects on vector population and host–vector dynamics [7], further complicating prediction efforts.
Although climate change impacts on disease have drawn substantial attention, acquired immunity also plays a large role in disease dynamics [8,9]. Even when herd immunity has traditionally been considered less important for disease transmission (e.g. in cases when seroprevalence is low, or for zoonotic pathogens for which humans are incidental hosts), host heterogeneity in risk of exposure to vectors can increase the effective immunity far above measured levels [10]. The interaction of intrinsic and extrinsic factors makes it difficult to examine immunity or climate alone [11].
Predicting yearly epidemics of West Nile virus (WNV) is emblematic of these challenges. Since the introduction of WNV to the USA in 1999, there has been, on average, 50-fold interannual variation in the number of cases in each state where WNV occurs [12,13]. This enormous variability makes public health allocation decisions difficult, and highlights the utility of accurate predictions of future case burdens [14].
Transmission of vector-borne pathogens like WNV is influenced by multiple climatic drivers (figure 1a). Temperature is hypothesized to have unimodal effects on transmission, because increases in replication rates of pathogens and vectors are eventually overwhelmed by accelerating decreases in vector survival at high temperatures [5,20] (figure 1b–e). Increased precipitation could either increase or reduce mosquito abundance by creating breeding sites or flushing container-breeding mosquitoes, depending upon the intensity [21,22]. Additionally, mosquito populations could either decline during droughts due to reduced breeding habitat, or increase in abundance due to increased habitat quality or reduced predators [23]. Furthermore, drought—which is influenced by both precipitation and temperature—could increase WNV prevalence in mosquitoes via increased contact (due to host movement to mosquito habitats [24]), or higher vector-to-host ratios (due to drought-induced reductions in juvenile birds [25,26]).
Figure 1.

Mechanisms influencing WNV transmission. (a) Variables (blue) that influence human WNND cases (red) either positively (green arrows) or negatively (black arrows), either directly, or via effects on mosquito populations (purple). Note that it is the product of mosquito abundance and prevalence that determines risk to humans. (b–e) The fitted relationships for the temperature-dependent (b) biting rate [15], (c) mortality rate [16,17], and (d) the inverse of the extrinsic incubation period [18,19] (L.D.K., A. C. Matacchiero, A.T. Ciota & A.M.K. 2013, unpublished data) were used to generate (e) the resulting estimated relationships between temperature and partial-R0 for West Nile virus for C. tarsalis (triangles, dashed lines), C. pipiens (circles, solid lines) and C. quinquefasciatus (cross-hatches, dotted lines; see Material and methods). (Online version in colour.)
Our analyses build upon previous studies of climate–WNV associations that were conducted over smaller state- or county-level areas [7,27–31] or for shorter periods of time [22,32,33], or that analysed dichotomized values of WNV [34,35]. We have added key mechanistic drivers including human population immunity and a temperature-dependent R0, and we project WNV incidence, rather than changes in the distribution or probability of above-average years [32,35,36] or changes in vector populations [37] under future climate change. We analysed the intrinsic (immune) and extrinsic (climate) factors driving interannual variation in West Nile neuroinvasive disease (WNND) incidence across the continental USA since WNV introduction (1999–2013), and explored potential mechanisms by analysing vector transmission data from a WNV hotspot. State-level analyses allowed us to examine regional variation in WNV drivers that arise from varying host and vector ecologies and infection histories in different parts of the country. Specifically, we hypothesized that temperature would be most important at the colder edges of the vector distributions, and that immunity would be most important in states that had previously had large epidemics.
2. Material and methods
(a). Models
We fitted annual numbers of human WNND cases, N, to the following model:
| 2.1 |
where I is cumulative incidence (see the electronic supplementary material, figure S1), T is the value of the mosquito species-specific temperature-driven relative R0 value (using mean May–August temperatures; see the electronic supplementary material), P is total May–August precipitation, D is average May–August values of the Palmer Drought Severity Index [38] and F is winter severity (freezes: the number of weeks in the previous winter with average temperature below 0°C). The parameters λ, α, ω, δ and γ are the fitted coefficients for these predictors.
We chose these weather factors because they were biologically relevant to vector and host species involved in WNV transmission, and they were correlated with WNV risk in previous local-scale studies [27,28,39]. There was relatively low correlation among these predictors; the maximum variance inflation factor was 2.17, below a suggested cut-off of 3 [40]. We used county-level values of these weather variables to create state-wide weighted averages, with counties weighted by the relative number of WNND cases recorded in each county between 1999 and 2009; county-level WNND data after 2009 were not available from the Centers for Disease Control and Prevention (CDC). We used precipitation and temperature data from May through August, because these are the months when the majority of WNV infective mosquitoes become infected [41].
We estimated three temperature-dependent R0 relationships, one for each of the three most important WNV mosquito vector species, using the fitted relationships for temperature-dependent biting rates, mortality rates and inverse of the extrinsic incubation period for Culex tarsalis, C. quinquefasciatus and C. pipiens (electronic supplementary material). To calculate the vector-specific temperature–R0 curve shown in figure 1e, we derived the equation for effective reproductive ratio. We inserted the fitted relationships with temperature into the equation to estimate values of relative R0 at a given temperature for each mosquito species, which we used in place of raw temperature values (electronic supplementary material).
We constrained the parameters for the slope of the relationship between log cases and both cumulative incidence (λ) and number of freezes (γ) to be negative, and temperature-driven R0 (α) to be positive, to reflect the biological mechanisms these parameters represent. To fit this model at the national level, we used a generalized linear mixed effects model by penalized quasi-likelihood with a negative binomial distribution and log link, allowing the slope of the immunity term to vary as a random effect of state using function glmmPQL in the MASS package in R v. 3.0.2. At the state level, we fitted the same model (without the state random effects) using glm.nb in the MASS package. There was no evidence of significant temporal autocorrelation in the residuals of the fitted models. We excluded initial years in which human WNND was found in less than 30% of counties making up the final distribution in a state to ensure we analysed trends only after full establishment. We also excluded states with less than 10 total cases or less than 6 years of data. We performed analyses at the state level because this is the highest spatial resolution for which the CDC provides access to ArboNET data differentiated by case definition (e.g. fever, encephalitis, etc.). We calculated the relative importance of predictor variables based on the magnitude of coefficients of standardized (Z-transformed) predictor variables. We performed cross-validation of the fitted models by re-fitting the final models while excluding each year of data sequentially, and using the new fitted model to predict the excluded datapoints. We then generated a prediction accuracy value for each state (electronic supplementary material, table S2) as follows:
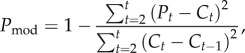 |
2.2 |
where t is the year, P is the predicted value and C is the number of cases. We chose an autoregressive null model since our model showed immunity to be important in some states and a grand mean null would always include the first year when there was no immunity built up in the population.
(b). Historical meteorological and future climate data sources
To build our predictive models, we used bias-corrected daily minimum and maximum temperature and precipitation data from 1999 to 2013 in the National Centers for Environmental Prediction North American Regional Reanalysis (NARR) data [42]. Owing to biases in the NARR data that can affect the frequency of occurrence of critical biological thresholds [43], we bias-corrected temperature and precipitation variables at the monthly scale using Oregon State University's monthly PRISM climate data as our observational standard [44] (see the electronic supplementary material). To project the influence of future climate change on the prevalence of WNND cases, we used bias-corrected data from an ensemble of 10 realizations of the International Center for Theoretical Physics regional climate model (‘RegCM4’) [45] using the RCP8.5 scenario, which is the IPCC scenario that is most consistent with the recent trajectory of historical emissions [46] (electronic supplementary material). Bias correction with historically observed standards assumes that the structure of biases in the historical period will remain similar in future projections [47].
(c). Future case projections
We generated projections for current and future numbers of WNND cases using fitted models that included only the significant predictors. We estimated mean current (MC) and extreme current (EC) cases by taking the mean (MC) and 95th percentile (EC) of projections for each year using the 1999–2013 bias-corrected NARR climate. For future projections, we estimated cases using climate data from the years 2036–2049 for each of the 10 climate model realizations in each year. We then averaged across years within each of the model realizations to get 10 projected values (one for each model realization), and calculated the mean (MF) and 95th percentile (EF) of those values. Error bars include both the standard error of the mean and the standard deviation of the residuals between current projected and actual numbers of cases nationally from 2003 to 2013 (after WNV had spread across the USA). Extreme outliers (e.g. values for Michigan and one model realization in Maryland) were excluded from the national case totals because they resulted from a non-asymptotic relationship between R0 and incidence (see the electronic supplementary material).
(d). Local mosquito data
Mosquitoes were collected from 15 counties in Colorado between 2003 and 2008 using CDC light and hay-infusion baited gravid traps that were run one night per week from June to September. Culex mosquitoes were pooled by species and tested for WNV using reverse transcriptase polymerase chain reaction in pools of up to 50 [48]. To determine whether there were more human infections at a given level of entomological risk in the first year, when all humans were naive, as compared with subsequent years after immunity had built up, we tested for an effect of the density of infected mosquitoes (DIM) and year (either 2003, or all subsequent years combined) on the number of human WNND cases. To do this, we used a generalized linear mixed effects model with a negative binomial distribution and log link, treating county as a random effect, and using function glmmPQL in the MASS package in R v. 3.0.2. We also used a generalized linear model to test for relationships between drought and vector abundance (using a negative binomial distribution) and vector WNV prevalence (using a binomial distribution) in each transmission season.
(e). Effective herd immunity
Previous research on fine-scale spatial variation in mosquito abundance suggests that 90% of transmission occurs in just 20% of locations for vector-borne infections (averaged from Woolhouse et al. [10]; figure 1a). While these data are for parasitic diseases within Anopheles mosquitoes, the general principle of heterogeneity has been found to be remarkably consistent across a range of disease systems [49]. If 90% of WNV-infected bites occur in a subset of 20% of a state's population, the effective herd immunity could be as much as 0.9/0.2, or 4.5 times, higher than the seroprevalence that is calculated by assuming that 100% of the population is at risk.
3. Results
Both intrinsic (immunity) and extrinsic (climate) drivers were important predictors of WNND incidence, with immunity and drought being the strongest predictors of the number of observed annual WNND cases at the national and state levels (figures 2 and 3; electronic supplementary material, figures S2–S6 and tables S1 and S2). Local data from Colorado, one of the states hit hardest by WNV, further support a mechanistic link between WNV incidence and drought and immunity. Drought was correlated with elevated infection prevalence in the two most important mosquito vectors in the state (C. pipiens and C. tarsalis), but was uncorrelated with mosquito abundance (electronic supplementary material, figure S7). Additionally, in the first year that WNV had spread across the full state of Colorado, when most of the population was naive, there were more human cases than expected for a given DIM [48] than in subsequent years (figure 3c; year coeff. = 1.7, t = 12.7, p < 0.001; DIM coeff. = 0.2, t = 13.8, p < 0.001). For instance, when the DIM was one infected mosquito per trap-night, there were five predicted cases in the first year, compared with just one predicted case in subsequent years. Temperature-driven R0 (calculated using May–September mean temperature), winter severity (no. of weeks below freezing) and total May–September precipitation were weakly significant predictors at the national level, and present in only 24%, 7% and 27% of states, respectively.
Figure 2.

Climate and immunity correlations with annual state WNND cases. The effect of (a) immunity (cumulative incidence; coeff. = −2.05, F1,300 = 96.42, p < 0.001), (b) precipitation (coeff. = −0.0009, F1,161 = 2.20, p = 0.14), (c) drought (coeff. = −0.14, F1,274 = 27.01, p < 0.001), (d) winter severity (coeff. = −0.05, F1,34 = 2.95, p = 0.09), (e) temperature (PIP: coeff. = 0.06, F1,276 = 2.58, p = 0.10; TAR: coeff. = 0.22, F1,144 = 53.59, p < 0.001; QUI: coeff. = 0.002, F1,104 = 0.0005, p = 0.98) and (f) temperature modelled as the relative R0 value at a given temperature (coeff. = 1.66, F1,121 = 17.33, p < 0.001) on the total logged number of WNND cases (adjusted for state random effects) in a given state and year (1999–2013). In (a–d,f), the filled red points and fitted lines are univariate regressions for states in which that predictor was significant (α < 0.05), while open black points depict states in which the predictor was not significant. In (e), green crosses, blue circles and green triangles denote states where C. tarsalis, C. pipiens and C. quinquefasciatus, respectively, dominate transmission and the relationship is only significant for C. tarsalis. (Online version in colour.)
Figure 3.

Climate, immunity and WNND cases. (a) Yearly WNND cases and fitted model (line) in nine representative states, and projections of the number of future cases under mean (M) or extreme (E—95th percentile) climate conditions for either current (cross-hatch) or future (star) climate projections. Error bars include both the standard error of the mean projected values and the standard deviation of the residuals between current projected and actual values. (b) Colours/shading indicate the significant variables in the fitted models by state with pie-charts showing their relative importance. (c) Human WNND cases and abundance of infected mosquitoes in Colorado when all humans were naive (2003, filled points, coeff = 0.99, F1,175 = 173.1, p < 0.001) and in subsequent years (2004–2008, open points, coeff = 0.72, F1,787 = 285.5, p < 0.001). Variables were power transformed (1/4) to equalize leverage and linearize the relationship. (Online version in colour.)
The explanatory power of state-level models was relatively high, except in the few states where variation in cases was uncorrelated with measures of climate and immunity. The null model was the best fit in states with relatively few cases (e.g. West Virginia and New Jersey), as well as in some large, climatically variable states (e.g. Texas, Arizona, New Mexico and Minnesota). Finer-spatial-scale analyses of weather drivers in these larger states may reveal additional weather drivers whose effects may have been masked when averaged across a climatically variable state [27]. Additionally, some of the unexplained variation may be due to factors that we were unable to include in the model, such as vector control efforts, and changes in virus genetics, host resistance [50] or bird communities [51]. Models explained an average of 58% of the non-stochastic variance in the number of neuroinvasive WNV cases in the 38 states where the best model was not the null (electronic supplementary material, table S2). Similarly, cross-validation techniques using the model to predict data not used to build the model indicated that fitted models had a prediction accuracy of 65% across the 31 states where they were a better predictor than the null hypothesis value of the previous year's case burden (electronic supplementary material, table S2 and figure S8). Prediction accuracies were highest in states where immunity was a significant predictor. In addition, models for states where immunity was not significant occasionally predicted larger than observed epidemics in some years (electronic supplementary material, figure S8).
We used the fitted models described above, along with an ensemble of high-resolution climate model simulations [45], to estimate current and future WNND cases in each state. The models project an average of 991 ± 683 WNND cases each year under average current climate conditions and 2013 levels of acquired immunity, whereas up to 1331 ± 712 cases could occur in a relatively intense year (95th percentile of projected cases) driven by climate variation (figure 4a). Climate change is projected to nearly double the mean WNND burden (1814 ± 783 cases) by the mid-twenty-first century, while the 95th percentile is likely to increase by a factor of 2.5 (3297 ± 1123 cases), assuming current immunity levels and no viral evolution that substantially increases competence in hosts or vectors, or allows re-infection of previously exposed individuals.
Figure 4.

(a) National historical and projected WNND cases. Interannual variation in human WNND cases (filled circle, solid line) and deaths (open circle, dashed line) in the USA and projections of WNND cases under mean current (MC), extreme current (EC—95th percentile) mean future (MF) or extreme future (EF) conditions. Error bars include both the standard error of the mean projected values and the standard deviation of the residuals between current projected and actual values. (b) Summed totals of current maximum number of yearly cases and projected future cases with and without immunity in states where immunity was (grey) or was not (black) significant.
4. Discussion
WNV has been called ‘unpredictable’ because of enormous local- and continental-scale variability in WNV incidence, and variation in avian host and mosquito vector ecology [14]. However, our results suggest that models that incorporate mechanistic hypotheses and both intrinsic and extrinsic drivers can improve the accuracy of predictions for complex multi-host, multi-vector pathogens like WNV. We found that the primary drivers of interannual variation in WNV across the USA include drought and immunity, and that increases in drought could potentially double WNV epidemic intensity nationally, with epidemics in areas of low immunity being even larger.
The projected future increase in WNV incidence is primarily due to a doubling of the drought index. The positive relationship between drought and WNV infection prevalence in Colorado mosquitoes suggests that drought alters transmission in this state not by reducing mosquito abundance, but by increasing infection prevalence. This could occur if lower avian reproduction [52] increases the vector–host ratio, or if patterns of host–vector contact are altered due to congregation [24] or avian stress [53]. Similarly, dry summer soil moisture conditions have been positively correlated with WNV prevalence in Culex mosquitoes in New York [39] as well as with spatial variation in the prevalence of the closely related Usutu flavivirus in Culex mosquitoes in Italy [54]. Increased aridity is projected in many regions of the USA in spite of increases in mean precipitation [55,56], highlighting the importance of considering moisture availability directly rather than relying on precipitation as a proxy measure, because precipitation alone was a poor predictor of WNV cases in most states.
The impact of immunity at both the national and state levels was evident through a large reduction in human cases in response to increasing cumulative incidence. At a local level, during the first year that WNND reached epidemic levels across Colorado (and a majority of humans were naive), the number of human cases for a given DIM was higher than in subsequent years (figure 3c). This difference in human cases at the same level of entomological risk suggests that human immunity rather than bird immunity was driving the decrease in incidence, because bird immunity can only affect human infections via mosquito infection, and this is already taken into account by using DIM as the predictor. Because humans are dead-end hosts for WNV, human immunity does not reduce transmission between mosquitoes and birds, but reduces human WNV cases by depleting the susceptible human population. Human immunity has frequently been dismissed as a factor in patterns of WNV incidence, because estimates of population-wide seroprevalence are uniformly low (less than 14%) [57,58], indicating most of the population remains susceptible. However, heterogeneity in the risk of mosquito exposure means that only a small subset of the population is likely to be at risk for WNV, and the effective seroprevalence may be 4.5-fold higher [10] (see Material and methods).
Although increased drought severity could approximately double the number of WNV cases annually, the projected increase would have been even greater without the limiting role of immunity, and the actual increase in WNV incidence may be smaller if herd immunity in human populations increases before drought increases. Without the observed build-up of human immunity, the number of projected future cases would be sixfold higher nationally (11 673 ± 1921 cases; figures 2 and 4b). Nonetheless, despite accumulating immunity, the number of WNND cases in each state does not always decline over time, because entomological risk varies from year to year [48], and both transmission and the build-up of herd immunity is spatially heterogeneous. In states where acquired immunity is already relatively high, intense future WNND epidemics are unlikely (electronic supplementary material, figure S9). For example, no more than 18 WNND cases are projected to occur in Wyoming under current or future climate conditions, which is less than 20% of the previous maximum of 92 cases. This state recorded only five and two WNND cases in 2014 and 2015, respectively, years not used to build the models [59]. However, states with above-average immigration or birth rates, or changes in human behaviour or age structure that increase their exposure to vectors or likelihood of developing the neuroinvasive form of the disease [57], and thus the at-risk population, could lead to more cases than projected in regions with high estimated immunity. Additionally, viral mutations that would allow WNV to re-infect previously exposed individuals could limit the effect of immunity. Furthermore, in states where there was little evidence of accumulated human immunity, such as Virginia, models suggest that up to 163 WNND cases could occur in an extreme year under future climate conditions, which is over eight times higher than the previous maximum of 20 cases. Our results thus identify states most likely to experience future WNV epidemics, which could be used by federal agencies to allocate control resources. An important question for future research is how population immunity in humans will change with variable yearly WNV transmission, and population turnover through births, deaths and immigration.
The effects of temperature observed at finer spatial scales in other studies may be less apparent at the state level, or after accounting for immunity, and warmer temperatures may increase incidence in areas that are on the edge of being suitable for transmission [27,35] (electronic supplementary material), as is the case for malaria [4]. Previous studies have demonstrated positive effects of temperature and precipitation on vector abundance [60–63], which can affect vector-borne disease transmission [64]; however, the strong effects of drought on infection prevalence in mosquitoes may overwhelm these effects in some areas (electronic supplementary material).
The anticipated regional variability in which predictors were most important can be partly explained by vector ecology and geography. For instance, temperature-driven R0 values tended to explain WNND cases in the northern range limits of C. quinquefasciatus, as well as in several far northern states (e.g. Montana, Idaho and Michigan). This is consistent with the idea that warming at northern boundary edges will push temperatures into more optimal ranges for transmission [3,5]. Winter freezes appear to be most important in extreme southern portions of the USA where vectors may be more poorly adapted to freezing temperatures. Precipitation had generally positive effects in the eastern portion of the country and negative effects in the west, consistent with the idea that container-breeding mosquitoes may benefit from rain that fills containers, while higher rain could increase wetland permanence and predation [22,23]. Additionally, irrigation appears to influence WNV transmission in the western USA [65], which could alter the importance of rainfall for mosquito populations there.
Our analyses, which incorporated laboratory-derived temperature–R0 relationships and immunity as a key intrinsic driver, has allowed us to determine the dominant drivers of WNV incidence across the USA. The projected future increase in WNV in the USA indicates a need for increased resources for WNV surveillance, mitigation and research, at a national scale. Furthermore, our results can improve allocation of WNV mitigation resources in areas where drought is a major driver, because the drought index (PDSI) is calculated in real time. Because drought severity is likely to alter transmission of other vector-borne diseases in ways not captured by analyses of temperature and precipitation alone, variations and changes in drought severity should be examined as potential drivers of disease dynamics.
Supplementary Material
Acknowledgements
We thank J. Lehman and M. Fisher for facilitating access to ArboNET data and J. Pape and the CDPHE for sharing the Colorado mosquito data. We thank Mr Martin Scherer for assistance with the NARR bias correction early in the project. We thank the climate modelling groups and DOE's PCMDI for CMIP5 access. The Oak Ridge Computing Facility at ORNL provided resources for the RegCM4 simulations. The National Science Foundation sponsors the National Center for Atmospheric Research.
Ethics
The research described conforms to all current laws of the USA, and no vertebrate animals were used in this research.
Data accessibility
Human WNND case data are available from the CDC at https://www.cdc.gov/westnile/statsmaps/finalmapsdata/index.html. The NARR climate data are available from NOAA at http://www.esrl.noaa.gov/psd. Colorado mosquito analysis data are available through Dryad at http://dx.doi.org/10.5061/dryad.t0027 [66].
Authors' contributions
A.M.K., S.H.P., N.S.D. and L.D.K. conceived the ideas. S.H.P. and A.M.K. performed analyses and wrote the manuscript. M.A. and D.R. performed the climate model simulations. D.E.H., N.S.D., M.A. and D.R. performed the climate analyses, and contributed to the text. All authors gave final approval for publication.
Competing interests
We declare we have no competing interests.
Funding
This work was supported with funding from the National Institutes of Health (1R01AI090159-01), the National Science Foundation (EF-0914866, DEB-1115895 and DEB-1336290) and NIAID contract no. 14-0131-01.
References
- 1.Morens DM, Folkers GK, Fauci AS. 2004. The challenge of emerging and re-emerging infectious diseases. Nature 430, 242–249. ( 10.1038/nature08554) [DOI] [PMC free article] [PubMed] [Google Scholar]
- 2.Patz JA, Campbell-Lendrum D, Holloway T, Foley JA. 2005. Impact of regional climate change on human health. Nature 438, 310–317. ( 10.1038/nature04188) [DOI] [PubMed] [Google Scholar]
- 3.Altizer S, Ostfeld RS, Johnson PTJ, Kutz S, Harvell CD. 2013. Climate change and infectious diseases: from evidence to a predictive framework. Science 341, 514–519. ( 10.1126/science.1239401) [DOI] [PubMed] [Google Scholar]
- 4.Siraj AS, Santos-Vega M, Bouma MJ, Yadeta D, Ruiz Carrascal D, Pascual M. 2014. Altitudinal changes in malaria incidence in highlands of Ethiopia and Colombia. Science 343, 1154–1158. ( 10.1126/science.1244325) [DOI] [PubMed] [Google Scholar]
- 5.Rogers DJ, Randolph SE. 2000. The global spread of malaria in a future, warmer world. Science 289, 1763–1766. ( 10.1126/science.289.5478.391b) [DOI] [PubMed] [Google Scholar]
- 6.Lindgren E, Andersson Y, Suk JE, Sudre B, Semenza JC. 2012. Monitoring EU emerging infectious disease risk due to climate change. Science 336, 418–419. ( 10.1126/science.1215735) [DOI] [PubMed] [Google Scholar]
- 7.Shaman J, Day JF, Stieglitz M. 2005. Drought-induced amplification and epidemic transmission of West Nile virus in southern Florida. J. Med. Entomol. 42, 134–141. ( 10.1603/0022-2585(2005)042%5B0134:DAAETO%5D2.0.CO;2) [DOI] [PubMed] [Google Scholar]
- 8.Rohani P, Earn DJ, Grenfell BT. 1999. Opposite patterns of synchrony in sympatric disease metapopulations. Science 286, 968–971. ( 10.1126/science.286.5441.968) [DOI] [PubMed] [Google Scholar]
- 9.Wearing HJ, Rohani P. 2006. Ecological and immunological determinants of dengue epidemics. Proc. Natl Acad. Sci. USA 103, 11 802–11 807. ( 10.1073/pnas.0602960103) [DOI] [PMC free article] [PubMed] [Google Scholar]
- 10.Woolhouse MEJ. 1997. Heterogeneities in the transmission of infectious agents: implications for the design of control programs. Proc. Natl Acad. Sci. USA 94, 338–342. ( 10.1073/pnas.94.1.338) [DOI] [PMC free article] [PubMed] [Google Scholar]
- 11.Koelle K, Rodó X, Pascual M, Yunus M, Mostafa G. 2005. Refractory periods and climate forcing in cholera dynamics. Nature 436, 696–700. ( 10.1038/nature03820) [DOI] [PubMed] [Google Scholar]
- 12.Petersen LR, Brault AC, Nasci RS. 2013. West Nile virus: review of the literature. JAMA 310, 308–315. ( 10.1001/jama.2013.8042) [DOI] [PMC free article] [PubMed] [Google Scholar]
- 13.Kilpatrick AM. 2011. Globalization, land use, and the invasion of West Nile virus. Science 334, 323–327. ( 10.1126/science.1201010) [DOI] [PMC free article] [PubMed] [Google Scholar]
- 14.Petersen L, Fischer M. 2012. Unpredictable and difficult to control—the adolescence of West Nile virus. N. Engl. J. Med. 367, 1281–1284. ( 10.1056/NEJMp1208347) [DOI] [PubMed] [Google Scholar]
- 15.Reisen WK, Milby MM, Presser SB, Hardy JL. 1992. Ecology of mosquitoes and St. Louis encephalitis virus in the Los Angeles Basin of California, 1987–1990. J. Med. Entomol. 29, 582–598. ( 10.1093/jmedent/29.4.582) [DOI] [PubMed] [Google Scholar]
- 16.Ciota AT, Matacchiero AC, Kilpatrick AM, Kramer LD, Matacchiero AMYC. 2014. The effect of temperature on life history traits of Culex mosquitoes. J. Med. Entomol. 51, 55–62. ( 10.1603/ME13003) [DOI] [PMC free article] [PubMed] [Google Scholar]
- 17.Reisen W. 1995. Effect of temperature on Culex tarsalis (Diptera, Culicidae) from the Coachella and San Joaquin valleys of California. J. Med. Entomol. 32, 636–645. ( 10.1093/jmedent/32.5.636) [DOI] [PubMed] [Google Scholar]
- 18.Kilpatrick AM, Meola MA, Moudy RM, Kramer LD. 2008. Temperature, viral genetics, and the transmission of West Nile virus by Culex pipiens mosquitoes. PLoS Pathog. 4, e1000092 ( 10.1371/journal.ppat.1000092) [DOI] [PMC free article] [PubMed] [Google Scholar]
- 19.Reisen WK, Fang Y, Martinez VM. 2006. Effects of temperature on the transmission of West Nile virus by Culex tarsalis (Diptera: Culicidae). J. Med. Entomol. 43, 309–317. ( 10.1093/jmedent/43.2.309) [DOI] [PubMed] [Google Scholar]
- 20.Mordecai EA, et al. 2013. Optimal temperature for malaria transmission is dramatically lower than previously predicted. Ecol. Lett. 16, 22–30. ( 10.1111/ele.12015) [DOI] [PubMed] [Google Scholar]
- 21.Koenraadt ACJM, Harrington LC. 2008. Flushing effect of rain on container-inhabiting mosquitoes Aedes aegypti and Culex pipiens (Diptera: Culicidae). J. Med. Entomol. 45, 28–35. ( 10.1093/jmedent/45.1.28) [DOI] [PubMed] [Google Scholar]
- 22.Landesman WJ, Allan BF, Langerhans RB, Knight TM, Chase JM. 2007. Inter-annual associations between precipitation and human incidence of West Nile virus in the United States. Vector Borne Zoonotic Dis. 7, 337–343. ( 10.1089/vbz.2006.0590) [DOI] [PubMed] [Google Scholar]
- 23.Chase JM, Knight TM. 2003. Drought-induced mosquito outbreaks in wetlands. Ecol. Lett. 6, 1017–1024. ( 10.1046/j.1461-0248.2003.00533.x) [DOI] [Google Scholar]
- 24.Shaman J, Day JF, Stieglitz M. 2002. Drought-induced amplification of Saint Louis encephalitis virus, Florida. J. Med. Entomol. 8, 575–580. [DOI] [PMC free article] [PubMed] [Google Scholar]
- 25.Hamer GL, et al. 2008. Rapid amplification of West Nile virus: the role of hatch-year birds. Vector Borne Zoonotic Dis. 8, 57–67. ( 10.1089/vbz.2007.0123) [DOI] [PubMed] [Google Scholar]
- 26.Kermack W, McKendrick A. 1927. A contribution to the mathematical theory of epidemics. Proc. R. Soc. Lond. A 115, 700–721. ( 10.1098/rspa.1927.0118) [DOI] [Google Scholar]
- 27.Chung WM, Buseman CM, Joyner SN, Hughes SM, Fomby TB, Luby JP, Haley RW. 2013. The 2012 West Nile encephalitis epidemic in Dallas, Texas. J. Am. Med. Assoc. 310, 297–307. ( 10.1001/jama.2013.8267) [DOI] [PubMed] [Google Scholar]
- 28.Ruiz MO, Chaves LF, Hamer GL, Sun T, Brown WM, Walker ED, Haramis L, Goldberg TL, Kitron UD. 2010. Local impact of temperature and precipitation on West Nile virus infection in Culex species mosquitoes in northeast Illinois, USA. Parasit. Vectors 3, 19 ( 10.1186/1756-3305-3-19) [DOI] [PMC free article] [PubMed] [Google Scholar]
- 29.Liu A, Lee V, Galusha D, Slade MD, Diuk-Wasser M, Andreadis T, Scotch M, Rabinowitz PM. 2009. Risk factors for human infection with West Nile Virus in Connecticut: a multi-year analysis. Int. J. Health Geogr. 8, 67 ( 10.1186/1476-072X-8-67) [DOI] [PMC free article] [PubMed] [Google Scholar]
- 30.Walsh MG. 2012. The role of hydrogeography and climate in the landscape epidemiology of West Nile virus in New York State from 2000 to 2010. PLoS ONE 7, e30620 ( 10.1371/journal.pone.0030620) [DOI] [PMC free article] [PubMed] [Google Scholar]
- 31.Shaman J, Day JF, Komar N. 2010. Hydrologic conditions describe West Nile virus risk in Colorado. Int. J. Environ. Res. Public Health 7, 494–508. ( 10.3390/ijerph7020494) [DOI] [PMC free article] [PubMed] [Google Scholar]
- 32.Semenza JC, Tran A, Espinosa L, Sudre B, Domanovic D, Paz S. 2016. Climate change projections of West Nile virus infections in Europe: implications for blood safety practices. Environ. Health 15, 28 ( 10.1186/s12940-016-0105-4) [DOI] [PMC free article] [PubMed] [Google Scholar]
- 33.Soverow JE, Wellenius GA, Fisman DN, Mittleman MA. 2009. Infectious disease in a warming world: how weather influenced West Nile virus in the United States (2001–2005). Environ. Health Perspect. 117, 1049–1052. ( 10.1289/ehp.0800487) [DOI] [PMC free article] [PubMed] [Google Scholar]
- 34.Manore CA, Davis JK, Christofferson RC, Wesson DM, Hyman JM, Mores CN. 2014. Towards an early warning system for forecasting human West Nile virus incidence. PLoS Curr. Outbreaks 2, 1–21. ( 10.1371/currents.outbreaks.f0b3978230599a56830ce30cb9ce0500.Abstract) [DOI] [PMC free article] [PubMed] [Google Scholar]
- 35.Hahn MB, Monaghan AJ, Hayden MH, Eisen RJ, Delorey MJ, Lindsey NP, Nasci RS, Fischer M. 2015. Meteorological conditions associated with increased incidence of West Nile virus disease in the United States, 2004–2012. Am. J. Trop. Med. Hyg. 92, 1013–1022. ( 10.4269/ajtmh.14-0737) [DOI] [PMC free article] [PubMed] [Google Scholar]
- 36.Harrigan RJ, Thomassen HA, Buermann W, Smith TB. 2014. A continental risk assessment of West Nile virus under climate change. Glob. Change Biol. 20, 2417–2425. ( 10.1111/gcb.12534) [DOI] [PubMed] [Google Scholar]
- 37.Morin CW, Comrie AC. 2013. Regional and seasonal response of a West Nile virus vector to climate change. Proc. Natl Acad. Sci. USA 110, 15 620–15 625. ( 10.1073/pnas.1307135110) [DOI] [PMC free article] [PubMed] [Google Scholar]
- 38.National Climatic Data Center. CDO divisional select. 2016. See http://www7.ncdc.noaa.gov/CDO/CDODivisionalSelect.jsp# .
- 39.Shaman J, Harding K, Campbell SR. 2011. Meteorological and hydrological influences on the spatial and temporal prevalence of West Nile virus in Culex mosquitoes, Suffolk County, New York. J. Med. Entomol. 48, 867–875. ( 10.1603/ME10269) [DOI] [PubMed] [Google Scholar]
- 40.Zuur AF, Ieno EN, Walker NJ, Saveliev AA, Smith GM. 2009. Mixed effects models and extensions in ecology with R. New York, NY: Springer. [Google Scholar]
- 41.CDC. 2015. Surveillance resources. See https://www.cdc.gov/westnile/resourcepages/survresources.html.
- 42.NOAA Earth System Research Laboratory. NCEP North American Regional Reanalysis: NARR. 2016. See https://www.esrl.noaa.gov/psd/data/gridded/data.narr.html .
- 43.Diffenbaugh NS, Scherer M. 2013. Using climate impacts indicators to evaluate climate model ensembles: temperature suitability of premium winegrape cultivation in the United States. Clim. Dyn. 40, 709–729. ( 10.1007/s00382-012-1377-1) [DOI] [Google Scholar]
- 44.Prism Climate Group. 2016. PRISM climate data. See http://www.prism.oregonstate.edu.
- 45.Ashfaq M, Rastogi D, Mei R, Kao S-C, Gangrade S, Naz BS, Touma D. 2016. High-resolution ensemble projections of near-term regional climate over the continental U.S. J. Geophys. Res. 141, 9943–9963. ( 10.1002/2016JD025285) [DOI] [Google Scholar]
- 46.Peters GP, Andrew RM, Boden T, Canadell JG, Ciais P, Le Quéré C, Marland G, Raupach MR, Wilson C. 2013. The challenge to keep global warming below 2°C. Nat. Clim. Change 3, 4–6. ( 10.1038/nclimate1783) [DOI] [Google Scholar]
- 47.Horton DE, Harshvardhan, Diffenbaugh NS. 2012. Response of air stagnation frequency to anthropogenically enhanced radiative forcing. Environ. Res. Lett. 7, 44034 ( 10.1088/1748-9326/7/4/044034) [DOI] [PMC free article] [PubMed] [Google Scholar]
- 48.Kilpatrick AM, Pape WJ. 2013. Predicting human West Nile virus infections with mosquito surveillance data. Am. J. Epidemiol. 178, 829–835. ( 10.1093/aje/kwt046) [DOI] [PMC free article] [PubMed] [Google Scholar]
- 49.Lloyd-Smith JO, Schreiber SJ, Kopp PE, Getz WM. 2005. Superspreading and the effect of individual variation on disease emergence. Nature 438, 355–359. ( 10.1038/nature04153) [DOI] [PMC free article] [PubMed] [Google Scholar]
- 50.Duggal NK, et al. 2014. Evidence for co-evolution of West Nile virus and house sparrows in North America. PLoS Negl. Trop. Dis. 8, e3262 ( 10.1371/journal.pntd.0003262) [DOI] [PMC free article] [PubMed] [Google Scholar]
- 51.LaDeau SL, Kilpatrick AM, Marra PP. 2007. West Nile virus emergence and large-scale declines of North American bird populations. Nature 447, 710–713. ( 10.1038/nature05829) [DOI] [PubMed] [Google Scholar]
- 52.Albright TP, Pidgeon AM, Rittenhouse CD, Clayton MK, Flather CH, Culbert PD, Wardlow BD, Radeloff VC. 2010. Effects of drought on avian community structure. Glob. Change Biol. 16, 2158–2170. ( 10.1111/j.1365-2486.2009.02120.x) [DOI] [Google Scholar]
- 53.Gervasi SS, Burkett-Cadena N, Burgan SC, Schrey AW, Hassan HK, Unnasch TR, Martin LB. 2016. Host stress hormones alter vector feeding preferences, success and productivity. Proc. R. Soc. B 283, 20161278 ( 10.1098/rspb.2016.1278) [DOI] [PMC free article] [PubMed] [Google Scholar]
- 54.Calzolari M, et al. 2012. Mosquito, bird and human surveillance of West Nile and Usutu viruses in Emilia-Romagna region (Italy) in 2010. PLoS ONE 7, e38058 ( 10.1371/journal.pone.0038058) [DOI] [PMC free article] [PubMed] [Google Scholar]
- 55.Diffenbaugh NS, Swain DL, Touma D. 2015. Anthropogenic warming has increased drought risk in California. Proc. Natl Acad. Sci. USA 112, 3931–3936. ( 10.1073/pnas.1422385112) [DOI] [PMC free article] [PubMed] [Google Scholar]
- 56.Dai A. 2010. Drought under global warming: a review. Wiley Interdiscip. Rev. Clim. Change 2, 45–65. ( 10.1002/wcc.81) [DOI] [Google Scholar]
- 57.Petersen LR, Carson PJ, Biggerstaff BJ, Custer B, Borchardt SM, Busch MP. 2012. Estimated cumulative incidence of West Nile virus infection in US adults, 1999–2010. Epidemiol. Infect. 141, 1–5. ( 10.1017/S0950268812001070) [DOI] [PMC free article] [PubMed] [Google Scholar]
- 58.Murphy T, Grandpre J, Novick S, Seys S, Harris R, Musgrave K. 2005. West Nile virus infection among health-fair participants, Wyoming 2003: assessment of symptoms and risk factors. Vector Borne Zoonotic Dis. 5, 246–251. ( 10.1089/vbz.2005.5.246) [DOI] [PubMed] [Google Scholar]
- 59.West Nile virus. See. http://www.cdc.gov/westnile/ .
- 60.Lebl K, Brugger K, Rubel F. 2013. Predicting Culex pipiens/restuans population dynamics by interval lagged weather data. Parasit. Vectors 6, 1–11. ( 10.1186/1756-3305-6-129) [DOI] [PMC free article] [PubMed] [Google Scholar]
- 61.Carrieri M, Fariselli P, Maccagnani B, Angelini P, Calzolari M, Bellini R. 2014. Weather factors influencing the population dynamics of Culex pipiens (Diptera: Culicidae) in the Po Plain Valley, Italy (1997–2011). Environ. Entomol. 5, 482–490. ( 10.1603/EN13173) [DOI] [PubMed] [Google Scholar]
- 62.Karki S, Hamer GL, Anderson TK, Goldberg TL, Kitron UD, Krebs BL, Walker ED, Ruiz MO. 2016. Effect of trapping methods, weather, and landscape on estimates of the Culex vector mosquito abundance. Environ. Health Insights 10, 93–103. ( 10.4137/EHI.S33384.TYPE) [DOI] [PMC free article] [PubMed] [Google Scholar]
- 63.Ewing DA, Cobbold CA, Purse BV, Nunn MA, White SM. 2016. Modelling the effect of temperature on the seasonal population dynamics of temperate mosquitoes. J. Theor. Biol. 400, 65–79. ( 10.1016/j.jtbi.2016.04.008) [DOI] [PubMed] [Google Scholar]
- 64.Guo S, Ling F, Hou J, Wang J, Fu G, Gong Z. 2014. Mosquito surveillance revealed lagged effects of mosquito abundance on mosquito-borne disease transmission: a retrospective study in Zhejiang, China. PLoS ONE 9, e112975 ( 10.1371/journal.pone.0112975) [DOI] [PMC free article] [PubMed] [Google Scholar]
- 65.DeGroote JP, Sugumaran R. 2012. National and regional associations between human West Nile virus incidence and demographic, landscape, and land use conditions in the coterminous United States. Vector Borne Zoonotic Dis. 12, 657–665. ( 10.1089/vbz.2011.0786) [DOI] [PubMed] [Google Scholar]
- 66.Paull SH, Horton DE, Ashfaq M, Rastogi D, Kramer LD, Diffenbaugh NS, Kilpatrick AM. 2017. Data from: Drought and immunity determine the intensity of West Nile virus epidemics and climate change impacts. Dryad Digital Repository. ( 10.5061/dryad.t0027) [DOI] [PMC free article] [PubMed]
Associated Data
This section collects any data citations, data availability statements, or supplementary materials included in this article.
Data Citations
- Paull SH, Horton DE, Ashfaq M, Rastogi D, Kramer LD, Diffenbaugh NS, Kilpatrick AM. 2017. Data from: Drought and immunity determine the intensity of West Nile virus epidemics and climate change impacts. Dryad Digital Repository. ( 10.5061/dryad.t0027) [DOI] [PMC free article] [PubMed]
Supplementary Materials
Data Availability Statement
Human WNND case data are available from the CDC at https://www.cdc.gov/westnile/statsmaps/finalmapsdata/index.html. The NARR climate data are available from NOAA at http://www.esrl.noaa.gov/psd. Colorado mosquito analysis data are available through Dryad at http://dx.doi.org/10.5061/dryad.t0027 [66].