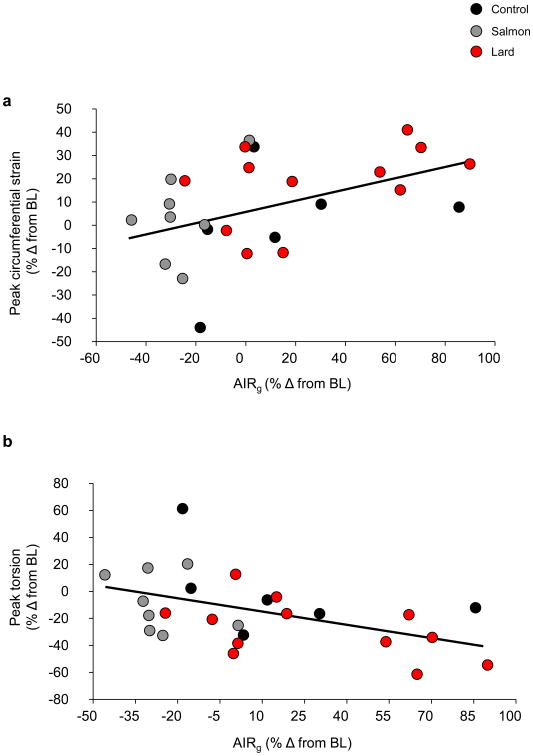
Fig. 6.
Scatter plots showing correlations between the change in AIRg and (a) the change in peak circumferential strain; r=±0.45; p=0.023 and (b) the change in peak torsion; r=−0.48; p=0.013 for all 26 animals. Black dots represent the control group, grey dots the salmon oil group and red dots the lard group. Data are reported as the percentage change (% Δ) from baseline level (BL). To convert AIRg to SI units, multiply by 6

