Abstract
The mechanical properties of the nucleus are closely related to many cellular functions; thus, measuring nuclear mechanical properties is crucial to our understanding of cell biomechanics and could lead to intrinsic biophysical contrast mechanisms to classify cells. Although many technologies have been developed to characterize cell stiffness, they generally require contact with the cell and thus cannot provide direct information on nuclear mechanical properties. In this work, we developed a flow cytometry technique based on an all-optical measurement to measure nuclear mechanical properties by integrating Brillouin spectroscopy with microfluidics. Brillouin spectroscopy probes the mechanical properties of material via light scattering, so it is inherently label-free, non-contact, and non-invasive. Using a measuring beam spot of submicron size, we can measure several regions within each cell as they flow, which enables us to classify cell populations based on their nuclear mechanical signatures at a throughput of ~200 cells per hour. We show that Brillouin cytometry has sufficient sensitivity to detect physiologically-relevant changes in nuclear stiffness by probing the effect of drug-induced chromatin decondensation.
Graphical Abstract
A flow cytometry technique featuring the all-optical measurement of nuclear mechanical properties is developed by integrating Brillouin spectroscopy with microfluidics.
1. Introduction
Cells sense and respond to the mechanical forces of their surrounding microenvironment. As such, cell mechanical properties are involved in almost all cellular functions, such as migration, differentiation, gene expression, and malignant transformation1–2. Thus, cell mechanical signatures are promising as biomarkers and diagnostic indicators for underlying disease or treatment response. In the past two decades, many experimental techniques have been developed to assess the mechanical properties of cells, including atomic force microscopy (AFM)3, micropipette aspiration4, magnetic twisting cytometry (MTC)5, and micro-rheology6. In particular, there has recently been great interest in the development of flow cytometry modalities to screen cells based on their mechanical properties. Guck et al. pioneered the optical stretcher7–9, which deformed cells by applying optical forces on the cell body. Recently, Lange et al.10 and Qi et al.11 used microfluidic constrictions to estimate cell deformability and fluidity with a throughput of 100 to 10,000 cells per hour. Hur et al.12 and Tse et al.13 employed inertial microfluidics to classify cells based on size and deformability at high throughput. Otto et al.14 used shear stresses and pressure gradients to deform cells in a microfluidic channel and captured cell images with a high-speed camera to achieve real-time deformability cytometry. By applying an acoustic radiation force to the flowing cells in the channel, Hartono et al. 15 and Li et al. 16 developed acoustic pressure methods either to measure the bulk modulus of cells or to separate cells of different kinds.
However, existing methods only provide an average measurement of the mechanical properties of the whole cell and cannot directly assess subcellular structures, such as nucleus. The nucleus has recently emerged as a key interest in cell mechanobiology18–25. Force-induced changes in nuclear shape could result in large-scale reorganization of genetic material within the nucleus18. Changes in nuclear stiffness are associated with diseases, such as Huntington-Gilford progeria syndrome19. As the largest and stiffest organelle within a cell, the nucleus imposes a major physical barrier for cell migration20. For cells to migrate through tissue, the nucleus must undergo complex changes in position, shape, and stiffness in coordination with cytoskeletal dynamics21–25.
Thus, nuclear mechanical properties are of great interest because they are closely related to cellular functions and could provide useful biophysical signatures to classify cells. Currently, extracting mechanical properties of the nucleus requires staining, along with additional information and assumptions about how forces are transmitted within a cell. For pristine mechanical information, the nucleus has to be isolated to allow AFM or micropipette measurement, which makes the procedure not suitable for microfluidic platforms17.
In this work, we present a technique that can directly measure nuclear mechanical properties on a microfluidic platform using Brillouin light scattering spectroscopy. Brillouin scattering arises from the interaction of light with acoustic phonons within a medium, and thus depends upon the elastic properties of the medium26. Brillouin spectroscopy measures the spectrum shift due to scattering, from which the longitudinal modulus of material can be quantified. Importantly, this information can be gathered without contact and without applying an external force to deform the sample. Until a decade ago, Brillouin spectroscopy relied on scanning Fabry-Perot etalons to acquire high-resolution spectra of Brillouin signatures27, which required long acquisition time and high laser power. Recently, the development of Brillouin spectrometers based on virtually-imaged phased array (VIPA)28 has enabled multiple applications in biomedical sciences, such as the characterization of ocular tissue in vivo29–31, the measurement of fibrous proteins of the extracellular matrix32, and the mapping of cell mechanical properties33–35.
Here, to probe nuclear mechanical properties of flowing cells, we combined a VIPA-based Brillouin microscope of submicron spatial resolution with microfluidics. The Brillouin measuring beam is fixed within a microfluidic channel and intracellular mechanical properties are measured as cells flow through the channel. This results in a flow cytometry technique for nuclear mechanics that is inherently label-free, non-contact and non-invasive.
2. Experimental methods
A. Relationship between Brillouin shift and standard elastic moduli
The measured Brillouin frequency shift vB is linked to the longitudinal modulus M′ (the ratio of uniaxial stress to uniaxial strain) of a material by the relationship
| (1) |
where n is the refractive index of the material, λ is the wavelength of the light source, ρ is the density of the material, and θ is the angle between the incident and scattered light. Since we collect the backward scattering light in this work, θ = π. For cell measurements, the ratio of the density and refractive index is approximately constant33, which means the measured Brillouin shift is proportional to the longitudinal modulus of the subcellular region. For crystalline materials, the longitudinal modulus is related to the Young’s modulus E′ and Poisson’s ratio σ by M′ = E′ (1 − σ)/(1 + σ) (1 − 2σ). In soft matter such as biopolymers, biological tissues, and cells, the relationship between the longitudinal modulus extracted by Brillouin measurements and the Young’s or shear moduli is not established. Empirically, we previously found that the longitudinal modulus has a log-log linear relationship to the conventional Young’s modulus through log(M′) = a log(E′) + b, where a and b are material-dependent coefficients29. Thus, the relationship between relative changes in the longitudinal modulus and Young’s modulus can be approximated by δE′/E′ = (1/a) δM′/M′. For 3T3 cells, the factor (1/a) has been measured to be around 1533. In this paper, we report all data in terms of the Brillouin shift, as this is the direct experimental metric we measure.
B. Experimental setup
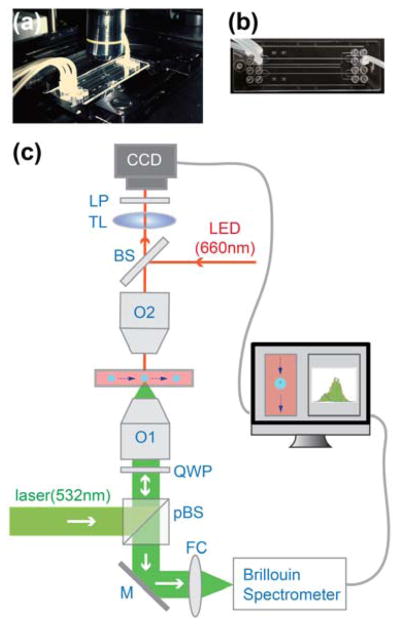
The experimental setup is shown in Fig. 1. An 11-mW single-mode linearly-polarized 532-nm cw laser (Torus, Laser Quantum) was used as light source to probe Brillouin scattering. The laser beam was focused into the centre of the microfluidic channel by an objective lens O1 (NA=0.6, Magnification: 40x) yielding a spot size of ~0.5 μm (transverse) by ~2 μm (axial). The backward scattered light was collected by the same objective lens. The scattered light was then coupled into the Brillouin spectrometer by a fibre coupling lens FC. To minimize losses within the microscope, we used a combination of polarized beam splitter (pBS) and quarter-wave plate (QWP) so that all vertically-polarized laser light was reflected off the pBS to reach the sample, and all the scattered light was transmitted by the pBS to reach the spectrometer.
Fig. 1.
Experimental setup. (a)–(b) Photos of the microscope stage and microfluidic device. (c) Sketch of the experimental setup. pBS: polarized beam splitter, M: mirror, FC: fibre coupler, QWP: quarter wave plate, O1 and O2: objective lens, BS: 50% beam splitter, TL: tube lens, LP: long-pass filter, CCD: charge coupled device. The dashed arrows indicate the flowing direction of the cells.
The Brillouin spectrometer consisted of a two-stage VIPA in cross-axis configuration, similar to previous reports30,33,36–37. To guide the data acquisition, on the top side of the microfluidic channel, we built a bright-field/fluorescence microscope that monitored the flow of cells inside the channel. For these modalities, we generally used a red (660 nm) illumination LED light source and a long-pass emission filter (FEL0600, Thorlabs) so that all residual Brillouin laser components were blocked.
The location of the focused laser beam was pre-determined by removing the long-pass filter. To block the red LED light from bleeding through the Brillouin channel, a narrow-band filter (FL532-10, Thorlabs) was placed in front of the Brillouin spectrometer. A home-built LabVIEW program synchronized the CCD camera and the Brillouin spectrometer; this enabled us to co-register the acquired data of the spectrometer with the bright-field image and extract the subcellular mechanical properties with high spatial accuracy. During the experiment, the sampling time of the spectrometer was set to 50 ms.
C. Microfluidic device
The chip (microfluidic ChipShop GmbH) was made of PMMA, with a base thickness of ~2 mm and lid thickness of 0.175 mm, and the overall size was 25.4 mm by 76.2 mm. It had a single straight channel with a sheath flow configuration at the inlet. The channel had dimensions of 150 μm (width), 50 μm (depth), and 50mm (length). The inlet of the channel had three sub-channels. The middle one was for the sample stream and the side two were for sheath streams. The chip was placed on a 2D stage of the microscope (IX81, Olympus) and connected to a syringe pump (Harvard Apparatus) that delivered the cell suspension into the channel. A second syringe pump was used to deliver sheath streams from the side-channels to establish sheath flow. By tuning the relative flow rate of the sheath streams and sample stream, the cells were aligned into the centre of the channel. In these experiments, the flowing velocity was about 40 μm/s, and the overall throughput was about 230 cells per hour.
D. Sample Preparation
NIH 3T3 fibroblast cells purchased from American Type Culture Collection (ATCC) were used for all experiments. Cells were cultured following standard protocols. For most flow experiments, cells were harvested by trypsinization and re-suspended in a solution of phosphate-buffered saline (PBS) without Mg2+ and Ca2+ at a concentration of ~106 cells/mL. For fluorescent staining of nucleus, the Vybrant DyeCycle Ruby stain (Thermo Fisher) was used following the manufacturer’s suggested protocol. In short, 1 μL of stain was added to a cell suspension of 500,000 cells/mL. The final stain concentration was 5 μM. The mixture was then incubated at 37°C for 15–30 minutes protected from light, then immediately used for fluorescence experiments. For chromatin decondensation experiments, cells were incubated for two hours in a solution of 100 ng/mL trichostatin A (TSA) in complete growth media. After incubation, cells were harvested using 0.25% trypsin-EDTA, centrifuged at 250 g for 5 minutes and re-suspended in PBS without Mg2+ and Ca2+ at approximately 2.5 million cells/mL.
E. Data acquisition and post-processing
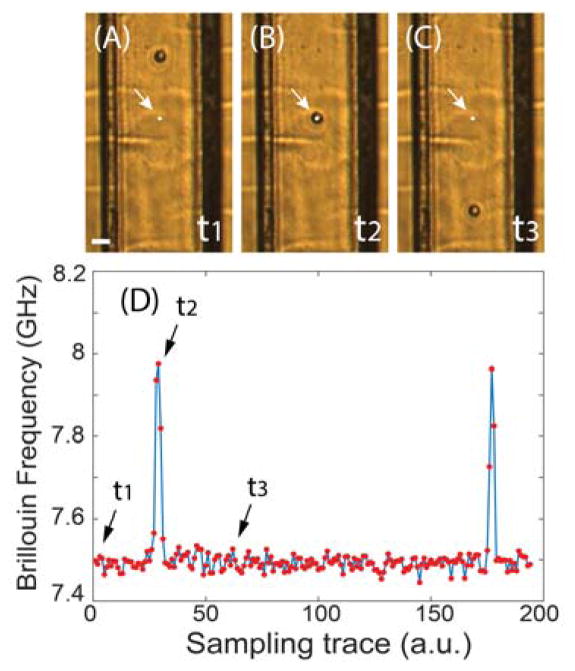
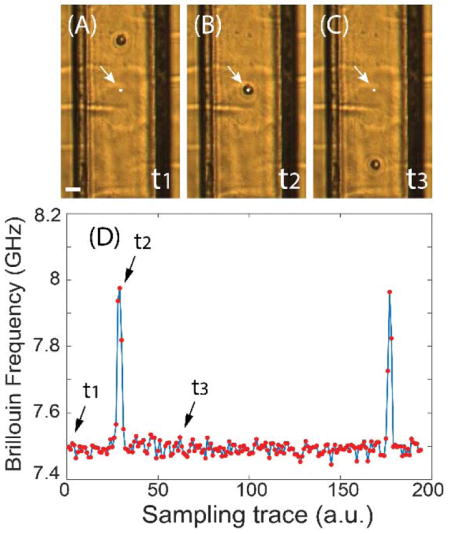
Figure 2a-c show snapshots captured by the bright-field microscope as a cell flows through the microfluidic channel from top to bottom. The arrow and white dot indicate the location of the laser beam spot. Fig. 2d shows the Brillouin signal recorded in real-time. Before the cell reaches the laser beam spot (Fig. 2a), the spectrometer senses the Brillouin signature of the PBS buffer medium (indicated as time t1 in the figure). As the cell crosses the measuring beam spot (Fig. 2b), the Brillouin signal spikes (time t2), indicating the greater stiffness of the cell compared to the surrounding medium. After the cell has passed through the beam spot, the spectrometer reverts to recording the Brillouin signature of the medium (time t3). Therefore, the continuous time-trace raw data contains the signatures of both the cells and medium, which are separated in post-processing. The diameter of suspended cells varied from 10 μm to 15 μm, thus 4 to 5 points per cell could be measured as cells flowed across the beam spot.
Fig. 2.
Demonstration of the measurement procedures. (A) to (C) are snapshots of the video captured by bright-field microscope as one cell flows through the microfluidic channel at different times (t1, t2, and t3). The scale bar is 30 μm. The white dot indicated by the arrow is the location of the focused laser beam spot. (D) Sampling trace of the corresponding Brillouin signal. Red dots represent measured data, and the solid line is a guide of eye.
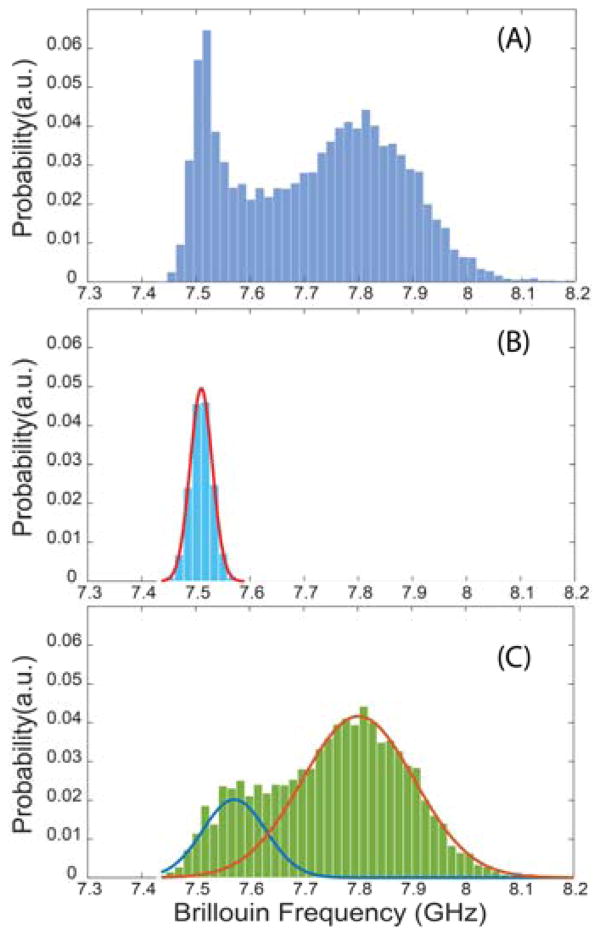
Data processing was carried out by home-written codes based on MATLAB (MathWorks) platform. The Brillouin spectrometer was pre-calibrated using standard materials, and the measurement sensitivity was determined to be ~0.01 GHz. From the time-trace raw data of Fig. 2d, we created a histogram picturing the distribution of frequency shifts collected during an experimental run and used this histogram to extract the mechanical signatures of cells by fitting the distributions. Figure 3 illustrates this procedure. We ran a suspension of normal 3T3 cells through the channel. Figure 3a shows the histogram of an experimental run corresponding to the data captured from 577 flowing cells. The leftmost peak of the histogram is the signature of PBS buffer medium, which is constant throughout all experimental runs and can be easily removed by fitting a normal distribution with a mean Brillouin shift of 7.51 GHz (Fig. 3b). After fitting and removing the data corresponding to the PBS buffer, we obtained the histogram shown in Fig. 3c, in which the Brillouin signature of the cells reveals two characteristic peaks. To fit the cell data, we used a linear superposition of two normal distributions, and the results are indicated by the solid curves of Fig. 3c. We obtained central frequencies at 7.57 GHz and 7.80 GHz, respectively. As it is expected that the nucleus is the stiffest component of a cell20, 33, we hypothesized that the 7.80-GHz peak fitted by the orange curve was the signature of nucleus, while the blue curve represented the signature of the cytoplasm. We proved this hypothesis true by fluorescently labelling the nucleus in Sec. 3B. We used this same fitting procedure in all the experiments of this paper to extract cell signatures.
Fig. 3.
Representative of data post-processing. Each data point in the histogram corresponds to one measurement event of the Brillouin spectrometer. (A) Original data contains signatures of both PBS buffer and cells. (B) Calibrated signature of the PBS buffer alone. The red curve is the fitted result based on a normal distribution. (C) Extracted signature of the cells. The blue and orange curves are fitted to the measured data based on normal distribution.
3. Results and Discussions
A. Flow data represents cell population mechanics
In our setup, as cells flow through the channel and are probed by a submicron-sized beam spot, a few points per cells are sampled. After measuring hundreds of cells, Brillouin flow cytometry enables building a characteristic distribution of Brillouin shifts within the cell population under study. First, we tested that this distribution is indeed indicative of the mechanical properties of the cell population under examination.
To do so, we compared the distribution obtained through Brillouin flow measurements and the distribution extracted from comprehensive Brillouin cell images. Suspended cells generally feature a rounded shape. With sheath flow, we can align the centre of the cells to the location of the focused beam spot as cells flow through the microfluidic channel. Thus, when a cell passes across the fixed laser beam spot, a line through the centre of the cell will be sampled. However, because the depth of the channel is larger than the cell size, not all cells will be sampled through their centre in the depth direction. As a result, when averaging over the whole cell population, we expect the flow data to represent equivalent information to cross-sectional Brillouin images.
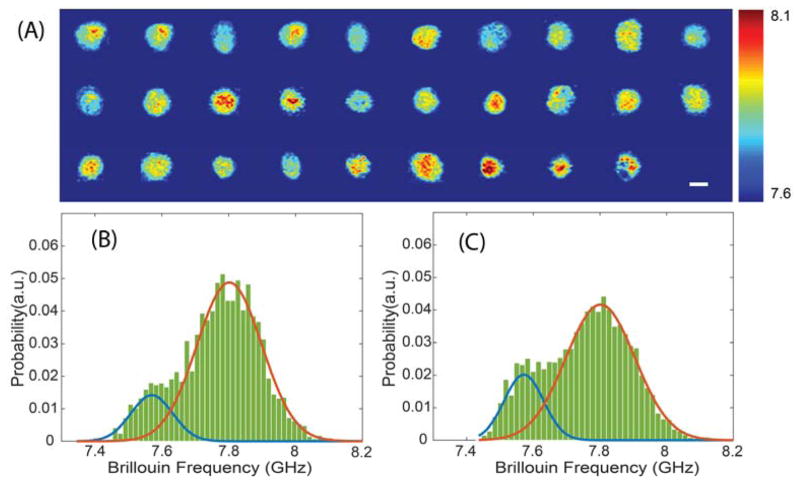
To verify this expectation, we collected Brillouin images of cross sections of static cells. We first delivered the cell suspension into the microfluidic channel slowly using a syringe pump. Once the cell suspension filled the channel, the pump was stopped. After several minutes, the cells settled to the bottom of the channel, still keeping their rounded shape. The height of the laser beam spot was then adjusted to the centre of the cell, and 2D scanning was performed by moving the stage of the microscope. The step size of the scan was set to 0.5 μm in both dimensions. The scanning was done automatically by a home-made LabVIEW program. We obtained 2D Brillouin images of 29 cells, as shown in Fig. 4a. From the whole set of images, we extracted a histogram featuring the distribution of stiffness values within all the cells (Fig. 4b), which represents the overall mechanics of cell population. For comparison, we also plotted the distribution of the flow data in Fig. 4c (i.e. Fig. 3c). By comparing the distributions obtained with the two methods, i.e. the 2D image data and the flow data, we found they provided the same signatures: both feature two peaks, with the same central Brillouin shifts at 7.57 GHz and 7.80 GHz. We also ran a two-sample Kolmogorov-Smirnov test and confirmed no statistically significant difference between the two distributions (p-value<0.05). We are thus confident that the flow data truly reveals information about the mechanical properties of the cell population.
Fig. 4.
Comparison between flow results and 2D Brillouin images of cell population. (A) Two-dimensional Brillouin images of cell population (29 cells). The colorbar has a unit of GHz. (B) and (C) show the distribution of the data points from 2D images and flow experiment, respectively. Solid curves are fitted results based on the method of Sec.3A. The peaks of two blue curves are7.57 GHz, and two red curves 7.80 GHz. The scale bar is 10 μm.
B. Identification of nuclear signature by fluorescence image
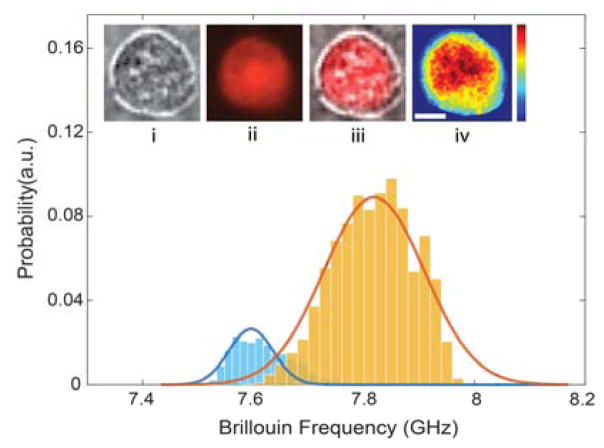
As previously mentioned, in our histograms, we observed a characteristic distribution of intracellular mechanical properties featuring two peaks, which we ascribed to the nucleus and the cytoplasm. To prove that the two peaks in the distribution indeed correspond to cytoplasmic and nuclear signatures, we used fluorescent dye to stain the nucleus of cells, and then acquired co-registered bright-field fluorescence and Brillouin images. This enabled us to build separate distribution plots for the nucleus and cytoplasm based on the co-localized fluorescent signal. Figure 5 shows a representative result of this experiment. By analysing the merged image of the bright-field and fluorescence with Brillouin image, we easily separated the Brillouin signature of the nucleus from that of the cytoplasm and obtained two separate histograms. We then plotted the data distribution obtained from the Brillouin image alone without fluorescent labels and fitted a two-peak distribution curve as described in Sec. 2E. To compare the two procedures, in Fig. 5, we plotted the two histograms for the nucleus (yellow histogram) and cytoplasm (blue histogram) and superimposed the curve obtained by label-free Brillouin fitting (solid curves). The match between the two procedures is evident; for quantitative comparison, we fitted the yellow and blue histograms based on normal distributions and obtained peaks of 7.60 GHz and 7.82 GHz for the cytoplasm and nucleus respectively; these values are within the instrument sensitivity when compared to the label-free Brillouin fitted values of 7.60 GHz and 7.81 GHz. We thus verified that the two peaks of the flow data can be used as a representation of the signatures of nucleus and cytoplasm, respectively. As expected, the area under the histogram curves is proportional to the size of nucleus and cytoplasm. The ratio of the areas of the nucleus (yellow) and cytoplasm (blue) in Fig. 5 is about 0.8:0.2, which corresponds to a diameter ratio of 0.89:0.11, consistent with the merged image in Fig. 5(iii).
Fig. 5.
Brillouin signatures of the cell verified by fluorescent image. The yellow and blue histograms represent the Brillouin signatures from the nucleus and cytoplasm, respectively. The solid lines are fitted curves of the distribution data from the Brillouin image without labels. Insert pictures: (i) bright-field image, (ii) fluorescent image of nucleus, (iii) merged image, and (iv) Brillouin image. The colorbar indicates Brillouin frequency shift ranges from 7.50 GHz to 7.95 GHz. The scale bar is 5 μm.
This figure also shows that Brillouin signatures could be integrated with fluorescence measurements. Combining Brillouin and confocal fluorescence microscopy, can improve the ability to mechanically phenotype specific subcellular components.
C. Chromatin decondensation softens nucleus
To demonstrate the potential impact of our new technology, we used Brillouin flow cytometry to characterize the change in mechanical properties of the nucleus caused by chromatin decondensation, as induced by TSA, a histone deacetylase inhibitor. Chromatin is the complex of DNA and proteins that makes up chromosomes within the nucleus. Several contact-based mechanical studies have recently found that the level of chromatin condensation affects the stiffness of the nucleus: chromatin decondensation results in the reduction of the stiffness of the nucleus38–40 and conversely, chromatin condensation leads to a stiffer nucleus41.
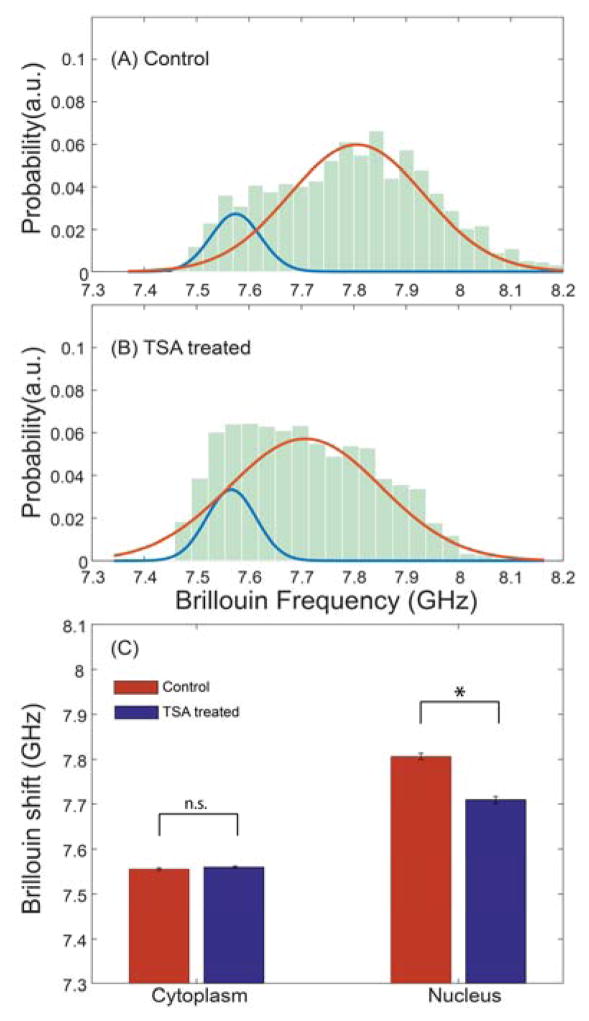
Both control and TSA treated cells were first prepared according to Sec. 2D, and then ran on the Brillouin flow cytometer. We collected data from a population of 353 control cells and 356 treated cells. By comparing Fig. 6a with Fig. 6b, the Brillouin shift of the nucleus (orange curves) moved from 7.80 GHz to 7.71 GHz after TSA treatment; this corresponds to a highly statistically significant reduction in Brillouin shifts compared to control cells (p-value<0.0001). On the other hand, the Brillouin shift of the cytoplasm (blue curves) remained nearly unchanged (~7.56 GHz), as expected given that the cytoplasm is not affected by TSA. This result indicates distinct softening of the nucleus with chromatin decondensation easily captured by Brillouin technology. To quantify the TSA-induced softening, the measured change of nuclear Brillouin shift corresponds to a relative change in longitudinal modulus δM′/M′ = 2.31%, which would correspond to a relative change of Young’s modulus δE′/E′ ≈ 34.4%. This is consistent with previous results obtained with optical stretcher, which estimated a TSA-induced decrease in nuclear stiffness as large as 50% in embryonic stem cells40.
Fig. 6.
Experimental observation of nuclear softening by chromatin decondensation. The histograms show measured data and were fitted by a linear combination of two normal distributions according to Sec. 2E. (A) Control group, N=353; (B) TSA treated group, N=356; (C) Average Brillouin shifts of cytoplasm and nucleus for control and TSA treated cells. *p < 0.0001; n.s.: not statistically significant difference. Error bar shows the standard error of the mean.
Conclusions
In conclusion, we reported a new flow cytometry method to identify nuclear mechanical signature of cells using on-chip Brillouin spectroscopy. Our novel technique provides a label-free, non-contact, and non-invasive method to measure the nuclear mechanical properties of cell populations, with an overall throughput of about 200 cells per hour. Currently, the throughput is mainly limited by the sampling rate of the Brillouin spectrometer, as it takes ~50 ms to record the spectrum at one location of a cell with high signal to noise ratio. Throughput improvements can be achieved by switching the laser wavelength from green to near infrared, as cells have much less absorption at longer wavelength, or by using stimulated Brillouin scattering42–43.
Another improvement to the current setup could be the microfluidic focusing. Our sheath flow technique only aligns cells in horizontal plane. The potential misalignment in the vertical direction may introduce an artificial broadening of the histogram distribution and thus reduce the sensitivity of the measurement. To address this issue, recently developed hydrodynamic focusing techniques, such as inertial microfluidics44–49, 3D symmetric focusing50–51 and surface acoustic wave microfluidics52, could be used.
To validate our method, we used Brillouin flow cytometry to evaluate the effect of chromatin decondensation on the stiffness of the nucleus and found distinct softening of the nucleus. Since changes of nuclear stiffness are involved in many important activities of the cell, such as migration, differentiation and malignant transformation, our technology has the potential to find a wide range of applications in cell mechanobiology.
Acknowledgments
This work was supported in part by the National Institutes of Health (K25EB015885, R33CA204582, U01CA202177); Human Frontier Science Program (Young Investigator Grant); and Canon Innovation Award.
Footnotes
Footnotes relating to the title and/or authors should appear here.
References
- 1.Bao G, Suresh S. Nature materials. 2003;2:715–725. doi: 10.1038/nmat1001. [DOI] [PubMed] [Google Scholar]
- 2.Vogel V, Sheetz M. Nature Reviews Molecular Cell Biology. 2006;7:265–275. doi: 10.1038/nrm1890. [DOI] [PubMed] [Google Scholar]
- 3.Lulevich V, Zimmer CC, Hong H-S, Jin L-W, Liu G-Y. Proc Natl Acad Sci USA. 2010;107:13872–13877. doi: 10.1073/pnas.1008341107. [DOI] [PMC free article] [PubMed] [Google Scholar]
- 4.Mitchison JM, Swan MM. J Exp Biol. 1954;31:443–460. [Google Scholar]
- 5.Wang N, Butler JP, Ingber DE. Science. 1993;260:1124–1127. doi: 10.1126/science.7684161. [DOI] [PubMed] [Google Scholar]
- 6.Weihs D, Mason TG, Teitell MA. Biophys J. 2006;91:4296–4305. doi: 10.1529/biophysj.106.081109. [DOI] [PMC free article] [PubMed] [Google Scholar]
- 7.Guck J, Ananthakrishnan R, Mahmood H, Moon TJ, Cunningham CC, Käs J. Biophys J. 2001;81:767–784. doi: 10.1016/S0006-3495(01)75740-2. [DOI] [PMC free article] [PubMed] [Google Scholar]
- 8.Guck J, Schinkinger S, Lincoln B, Wottawah F, Ebert S, Romeyke M, Lenz D, Erickson HM, Ananthakrishnan R, Mitchell D, Käs J, Ulvick S, Bilby C. Biophys J. 2005;88:3689–3698. doi: 10.1529/biophysj.104.045476. [DOI] [PMC free article] [PubMed] [Google Scholar]
- 9.Faigle C, Lautenschläger F, Whyte G, Homewood P, Martín-Badosa E, Guck J. Lab Chip. 2015;15:1267–1275. doi: 10.1039/c4lc01196a. [DOI] [PubMed] [Google Scholar]
- 10.Lange JR, Steinwachs J, Kolb T, Lautscham LA, Harder I, Whyte G, Fabry B. Biophysical Journal. 2015;109:26–34. doi: 10.1016/j.bpj.2015.05.029. [DOI] [PMC free article] [PubMed] [Google Scholar]
- 11.Qi D, et al. Sci Rep. 2015;5:17595. doi: 10.1038/srep17595. [DOI] [PMC free article] [PubMed] [Google Scholar]
- 12.Hur SC, Henderson-MacLennan NK, McCabe ERB, Di Carlo D. Lab Chip. 2011;11:912–920. doi: 10.1039/c0lc00595a. [DOI] [PubMed] [Google Scholar]
- 13.Tse HTK, Gossett DR, Moon YS, Masaeli M, Sohsman M, Ying Y, Mislick K, Adams RP, Rao J, Di Carlo D. Sci Transl Med. 2013;5:212ra163. doi: 10.1126/scitranslmed.3006559. [DOI] [PubMed] [Google Scholar]
- 14.Otto O, Rosendahl P, Mietke A, Golfier S, Herold C, Klaue D, Girardo S, Pagliara S, Ekpenyong A, Jacobi A, Wobus M, Toepfner N, Keyser UF, Mansfeld J, Fischer-Friedrich E, Guck J. Nat Methods. 2015;12:199–202. doi: 10.1038/nmeth.3281. [DOI] [PubMed] [Google Scholar]
- 15.Hartono D, Liu Y, Tan PL, Then XYS, Yung LY, Lim KM. Lab Chip. 2011;11:4072–4080. doi: 10.1039/c1lc20687g. [DOI] [PubMed] [Google Scholar]
- 16.Li P, et al. Proc Natl Acad Sci USA. 2015;112:4970–4975. doi: 10.1073/pnas.1504484112. [DOI] [PMC free article] [PubMed] [Google Scholar]
- 17.Lammerding J. Compr Physiol. 2011;1:783–807. doi: 10.1002/cphy.c100038. [DOI] [PMC free article] [PubMed] [Google Scholar]
- 18.Dahl KN, Ribeiro AJ, Lammerding J. Circ Res. 2008;102:1307–1318. doi: 10.1161/CIRCRESAHA.108.173989. [DOI] [PMC free article] [PubMed] [Google Scholar]
- 19.Booth EA, Spagnol ST, Alcoser TA, Dahl KN. Soft Matter. 2015;11:6412–6418. doi: 10.1039/c5sm00521c. [DOI] [PubMed] [Google Scholar]
- 20.Friedl P, Wolf K, Lammerding J. Curr Opin Cell Biol. 2011;23:55–64. doi: 10.1016/j.ceb.2010.10.015. [DOI] [PMC free article] [PubMed] [Google Scholar]
- 21.Denais CM, Gilbert RM, Isermann P, McGregor AL, te Lindert M, Weigelin B, Davidson PM, Friedl P, Wolf K, Lammerding J. Science. 2016;352:353–358. doi: 10.1126/science.aad7297. [DOI] [PMC free article] [PubMed] [Google Scholar]
- 22.Davidson PM, Denais C, Bakshi MC, Lammerding J. Cell Mol Bioeng. 2014;7:293–306. doi: 10.1007/s12195-014-0342-y. [DOI] [PMC free article] [PubMed] [Google Scholar]
- 23.Khatau SB, Bloom RJ, Bajpai S, Razafsky D, Zang S, Giri A, Wu PH, Marchand J, Celedon A, Hale CM, Sun SX, Hodzic D, Wirtz D. Sci Rep. 2012;2:448. doi: 10.1038/srep00488. [DOI] [PMC free article] [PubMed] [Google Scholar]
- 24.Fruleux A, Hawkins RJ. J Phys Condens Matter. 2016;28:363002. doi: 10.1088/0953-8984/28/36/363002. [DOI] [PubMed] [Google Scholar]
- 25.Fu Y, Chin LK, Bourouina T, Liu AQ, VanDongen AM. Lab Chip. 2012;12:3774–3778. doi: 10.1039/c2lc40477j. [DOI] [PubMed] [Google Scholar]
- 26.Dil JG. Rep Prog Phys. 1982;45:286–334. [Google Scholar]
- 27.Koski KJ, Akhenblit P, McKiernan K, Yarger JL. Nat materials. 2013;12:262–267. doi: 10.1038/nmat3549. [DOI] [PubMed] [Google Scholar]
- 28.Scarcelli G, Yun SH. Nat Photonics. 2007;2:39–43. doi: 10.1038/nphoton.2007.250. [DOI] [PMC free article] [PubMed] [Google Scholar]
- 29.Scarcelli G, Kim P, Yun SH. Biophysical Journal. 2011;101:1539–1545. doi: 10.1016/j.bpj.2011.08.008. [DOI] [PMC free article] [PubMed] [Google Scholar]
- 30.Scarcelli G, Yun SH. Opt Express. 2012;20:9197–9202. doi: 10.1364/OE.20.009197. [DOI] [PMC free article] [PubMed] [Google Scholar]
- 31.Scarcelli G, Besner S, Pineda R, Yun SH. Invest Ophthalmol Vis Sci. 2014;55:4490–4495. doi: 10.1167/iovs.14-14450. [DOI] [PMC free article] [PubMed] [Google Scholar]
- 32.Palombo F, Winlove CP, Edginton RS, Green E, Stone N, Caponi S, Madami M, Fioretto D. J R Soc Interface. 2014;11:20140739. doi: 10.1098/rsif.2014.0739. [DOI] [PMC free article] [PubMed] [Google Scholar]
- 33.Scarcelli G, Polacheck WJ, Nia HT, Patel K, Grodzinsky AJ, Kamm RD, Yun SH. Nat Methods. 2015;12:1132–1134. doi: 10.1038/nmeth.3616. [DOI] [PMC free article] [PubMed] [Google Scholar]
- 34.Antonacci G, Braakman S. Sci Rep. 2016;6:37217. doi: 10.1038/srep37217. [DOI] [PMC free article] [PubMed] [Google Scholar]
- 35.Elsayad K, Werner S, Gallemí M, Kong J, Sánchez Guajardo ER, Zhang L, Jaillais Y, Greb T, Belkhadir Y. Sci Signal. 2016;9:rs5. doi: 10.1126/scisignal.aaf6326. [DOI] [PubMed] [Google Scholar]
- 36.Berghaus KV, Yun SH, Scarcelli G. J Vis Exp. 2015;106:e53468. doi: 10.3791/53468. [DOI] [PMC free article] [PubMed] [Google Scholar]
- 37.Scarcelli G, Yun SH. Opt Express. 2011;19:10913–10922. doi: 10.1364/OE.19.010913. [DOI] [PMC free article] [PubMed] [Google Scholar]
- 38.Dahl KN, Engler AJ, Pajerowski JD, Discher DE. Biophys J. 2005;89:2855–2864. doi: 10.1529/biophysj.105.062554. [DOI] [PMC free article] [PubMed] [Google Scholar]
- 39.Mazumder A, Roopa T, Basu A, Mahadevan L, Shivashankar GV. Biophys J. 2008;95:3028–3035. doi: 10.1529/biophysj.108.132274. [DOI] [PMC free article] [PubMed] [Google Scholar]
- 40.Chalut KJ, Höpfler M, Lautenschläger F, Boyde L, Chan CJ, Ekpenyong A, Martinez-Arias A, Guck J. Biophys J. 2012;103:2060–2070. doi: 10.1016/j.bpj.2012.10.015. [DOI] [PMC free article] [PubMed] [Google Scholar]
- 41.Pajerowski JD, Dahl KN, Zhong FL, Sammak PJ, Discher DE. Proc Natl Acad Sci USA. 2007;104:15619–15624. doi: 10.1073/pnas.0702576104. [DOI] [PMC free article] [PubMed] [Google Scholar]
- 42.Remer I, Bilenca A. APL Photonics. 2016;1:061301. [Google Scholar]
- 43.Ballmann CW, Thompson JV, Traverso AJ, Meng Z, Scully MO, Yakovlev VV. Sci Rep. 2015;5:18139. doi: 10.1038/srep18139. [DOI] [PMC free article] [PubMed] [Google Scholar]
- 44.Di Carlo D, Irimia D, Tompkins RG, Toner M. Proc Natl Acad Sci USA. 2007;104:18892–18897. doi: 10.1073/pnas.0704958104. [DOI] [PMC free article] [PubMed] [Google Scholar]
- 45.Mao X, Waldeisen JR, Huang TJ. Lab Chip. 2007;7:1260–1262. doi: 10.1039/b711155j. [DOI] [PubMed] [Google Scholar]
- 46.Di Carlo D. Lab Chip. 2009;9:3038–3046. doi: 10.1039/b912547g. [DOI] [PubMed] [Google Scholar]
- 47.Chung AJ, Gossett DR, Di Carlo D. Small. 2013;9:685–690. doi: 10.1002/smll.201202413. [DOI] [PubMed] [Google Scholar]
- 48.Chung AJ, Pulido D, Oka JC, Amini H, Masaeli M, Di Carlo D. Lab Chip. 2013;13:2942–2949. doi: 10.1039/c3lc41227j. [DOI] [PubMed] [Google Scholar]
- 49.Wang X, Zandi M, Ho CC, Kaval N, Papautsky I. Lab Chip. 2015;15:1812–1821. doi: 10.1039/c4lc01462f. [DOI] [PMC free article] [PubMed] [Google Scholar]
- 50.Chiu YJ, Cho SH, Mei Z, Lien V, Wu TF, Lo YH. Lab Chip. 2013;13:1803–1809. doi: 10.1039/c3lc41202d. [DOI] [PMC free article] [PubMed] [Google Scholar]
- 51.Paiè P, Bragheri F, Vazquez RM, Osellame R. Lab Chip. 2014;14:1826–1833. doi: 10.1039/c4lc00133h. [DOI] [PubMed] [Google Scholar]
- 52.Ding X, Li P, Lin SC, Stratton ZS, Nama N, Guo F, Slotcavage D, Mao X, Shi J, Costanzo F, Huang TJ. Lab Chip. 2013;13:3626–3649. doi: 10.1039/c3lc50361e. [DOI] [PMC free article] [PubMed] [Google Scholar]


