

Abstract
In ruminants, Interferon tau (IFNT) is the pregnancy recognition protein produced by the mononuclear trophectoderm of the conceptus, and is secreted into the uterine lumen during the peri-attachment period. In our previous study, the high-throughput RNA sequencing (RNA-seq) data obtained from bovine conceptuses during the peri-attachment period identified two IFNT mRNAs, IFNT2 and IFNTc1. However, how each of these IFNT variants regulates endometrial gene expression has not been characterized. Using RNA-seq analysis, we evaluated how IFNT2 and IFNTc1 affected transcript expression in primary bovine endometrial epithelial cells (EECs). IFNT treatment induced 348 differentially expressed genes (DEGs); however, there are few DEGs in IFNT2 or IFNTc1 treated EECs, indicating that IFNT2-induced DEGs were similar to those induced by IFNTc1 treatment. In in silico analysis, we identified four IFNT2- and IFNTc1-induced pathways: 1) type II interferon signaling, 2) proteasome degradation, 3) type III interferon signaling, and 4) DNA damage response. We further demonstrated that IFNT2 and IFNTc1 up-regulated several transcription factors, among which forkhead box S1 (FOXS1) was identified as the most highly expressed gene. Furthermore, the knockdown of FOXS1 in IFNT2- or IFNTc1-treated EECs similarly down-regulated 9 genes including IRF3 and IRF9, and up-regulated 9 genes including STAT1, STAT2, and IRF8. These represent the first demonstration that effects of each IFNT on EECs were studied, and suggest that endometrial response as well as signaling mechanisms were similar between two IFNT variants existed in utero.
Introduction
Interferon tau (IFNT), classified as a type I IFN along with IFN alpha, IFN beta and IFN omega, is the pregnancy recognition protein in all ruminants [1]. IFNT, produced by the mononuclear trophectoderm of the conceptus, is secreted into the uterine lumen during the peri-attachment period [1, 2], although a few studies indicate that IFNT is detected in uterine vein serum [3, 4]. IFNT down-regulates the expression of endometrial oxytocin receptors and then maintains the corpus luteum function via inhibition of the luteolytic pulse of endometrial prostaglandin F2α [5–7]. Bovine IFNT increases on day 15 of pregnancy (day 0 = day of estrus), peaks on days 19–20 (conceptus attachment to endometrium begins on days 19–19.5), and is decreased soon after the initiation of conceptus attachment to the uterine epithelium [8–11].
To determine the number of IFNT genes expressed in the bovine uterus, several studies with the use of PCR have previously been executed [12, 13]. We also utilized the high-throughput RNA sequencing (RNA-seq) analysis, identifying two IFNT transcripts, IFNT2 and IFNTc1, in RNAs obtained from pregnant days 17, 20, and 22 bovine conceptuses [9, 14]. In addition, we showed that IFNT2 expression in utero was five-fold higher than that of IFNTc1 [9]. Over the past decade, various global analyses were performed to study the expression of transcripts in bovine endometrium [15–20]. These observations found changes in dynamic gene expression in pregnant and cyclic endometria, and identified optimal transcript and/or protein expression in utero for maintaining pregnancy at several stages in early pregnancy. In addition, those studies demonstrated the effects of IFNT and/or progesterone on differentially expressed genes in bovine endometrium. In the previous studies [12, 13], IFNT variants identified were subjected to assays of antiviral or anti-luteolytic activity; however, how each of those IFNT variants affects endometrial gene expression has not been characterized.
Our previous studies showed that the upstream region of IFNTc1 gene did not possess the JUN-binding site found in the IFNT2 gene, and TEAD2 increased transcriptional activity of IFNT2 only, resulting in the differential expression between IFNT2 and IFNTc1 in in vitro and possibly in vivo [21, 22]. In addition, both IFNT2 and IFNTc1 up-regulated IFN-stimulated genes (ISGs), including ISG12, ISG15, or MX dynamin-like GTPase (MX)1, while only IFNTc1 up-regulated the expression of MX2 in bovine endometrial epithelial cells [23]. We therefore hypothesized that effects of IFNT2 and IFNTc1 differ in the bovine endometrium. In this study, we evaluated how IFNT2 and IFNTc1 affected primary bovine endometrial epithelial cells using RNA-seq, followed by quantitative PCR analysis.
Materials and methods
Cell preparation, culture condition
In this study, we did not perform any animal experiments. Bovine uterine endometrial epithelial cells (EECs) were collected from Holstein cows at local abattoir (Tsuyama Meat Center) in accordance with protocols approved by local institutional animal care [24], and the protocol for bovine cell cultures was approved by the Ethics Committee of the University of Tokyo (Permit Number: 449–2126). In brief, uteri of the early luteal phase (days 2 to 5) were used in this study. The hysterectomized uterine lumen was trypsinized (0.3% w/v) in order to detach the epithelial cells and then EECs were isolated. The isolated EECs were cultured on collagen type I-coated culture dish in DMEM/F12 (1:1) medium supplemented with 10% (v/v) FBS, 40 units/ml of penicillin, and 40 μg/ml of streptomycin at 37°C under 5% CO2 in humidified air [11]. Human 293T cells (CRL-3216, ATCC) were grown in DMEM supplemented with 10% (v/v) FBS and antibiotics at 37°C in 5% CO2 [23].
Production and purification of recombinant IFNs
293T cells were transfected with the expression plasmid for IFNT2, IFNTc1 or IFNA [23] and culture media were collected at 48–72 hours after transfection [23]. Recombinant IFNs secreted to culture media from cells were purified using His-tagged protein purification reagent (Medical and Biological Laboratories, Nagoya, Japan) according to the manufacturer’s instructions [23]. The titers of purified recombinant IFNT2, IFNTc1, and IFNA were determined by the assay using MDBK cells and VSV as previously reported [25].
RNA extraction and preparation for RNA-seq analysis
RNA was extracted from cultured EECs using Isogen (Nippon gene, Tokyo, Japan) according to the manufacturer’s instructions. A portion of total RNA from cultured EECs treated with or without IFNT2 or IFNTc1 (n = 3 each) was pooled. High-throughput sequencing libraries were prepared using the SureSelect Strand Specific RNA Library Prep Kit (Agilent Technologies, Santa Clara, CA) according to the manufacturer’s instructions, and analysis was performed by Kazusa DNA Research Institute (Chiba, Japan). Primary sequencing data were deposited to the DDBJ (DNA Data Bank of Japan) Sequence Read Archive (accession number DRA005460).
Mapping reads to the bovine genome
Nucleotide sequences identified by RNA-seq analysis were trimmed by PRINSEQ-lite v0.19.2. Trimmed sequences were generated as FASTQ outputs and analyzed on the basis of the TopHat/Cufflinks pipeline based on the bovine genome (bosTau8) and reference annotations obtained from UCSC genome browser (http://genome.ucsc.edu). Differential and significant gene expression analysis was performed with the use of gene-level FPKM (fragments per kilobase of gene locus summarized mRNA per million reads) expression levels. Genes were selected with the criteria of an absolute expression level >10 FPKM in either IFNT2- or IFNTc1-treated samples with at least 1.5-fold higher expression in IFNT2 or IFNTc1 than non-treated EECs.
RNA extraction and quantitative RT-PCR
Using ISOGEN reagent (Nippon gene), total RNAs were extracted from cultured EECs treated with IFNTs, which were performed three times independently. For real-time PCR analyses, isolated RNA (total 0.5 μg) was reverse transcribed to cDNA using the ReverTra Ace qPCR RT Kit (Toyobo, Osaka, Japan) according to the manufacturer’s instructions. The cDNA reaction mixture was subjected to real-time PCR amplification using the Thunderbird SYBR qPCR Mix Kit (Toyobo) with primers listed in S1 Table, and PCR amplification was carried out on a Step One Plus real-time PCR System (Applied Biosystems, Foster City, CA). Amplification efficiencies of each target and the reference gene, bovine glyceraldehyde-3-phosphate dehydrogenase (GAPDH), were examined through their calibration curves and found to be comparable. The thermal profile for qPCR consisted of 40 cycles at 95°C for 15 sec, and annealing and extension at 60°C for 60 sec. Average threshold (Ct) values for each target were determined by Sequence Detection System software v2.2 (Applied Biosystems). Each run was completed with a melting curve analysis to confirm the specificity of amplification and the absence of primer dimer [11].
Transfection of small interfering RNA
The nucleotide structures of FOXS1 small interfering RNAs (siRNAs) were designed through the use of the siDirect program (RNAi, Tokyo, Japan), and all siRNAs were prepared commercially (Sigma–Aldrich). The nucleotide sequences of bovine FOXS1 (NM_001099716.1) were used to design the siRNA. EECs grown in 12-well plates were transfected with a nontargeting control siRNA (Invitrogen), FOXS1 #1 (5’-ACUCAAAGAAGAACAUUCCUG-3’, 5’-GGAAUGUUCUUCUUUGAGUGA-3’), or FOXS1 #2 (5’-AUGAUGUAGCGGUAGAUGCCG-3’, 5’-GCAUCUACCGCUACAUCAUGG-3’) siRNA (100 nM each) using Lipofectamine RNAiMAX reagent (3 μL, Invitrogen) according to the manufacturer’s instructions [22]. After the transfection, medium was removed, and the cells were cultured in fresh medium for 24 h. The EECs were treated with IFNT2 or IFNTc1. The concentrations for each siRNA were predetermined.
Statistical analysis
Data are expressed as the mean ± SEM. Significance was assessed using the Dunnet comparisons test. A P-value < 0.05 was considered statistically significant.
Results
Differential gene expression between IFNT2- and IFNTc1-stimulated endometrial epithelial cells
To investigate effects of IFNT2 and IFNTc1 on gene expression in EECs, RNA-seq analyses were executed, detecting 348 differentially expressed genes (DEGs) among non- (Ctrl), IFNT2- and IFNTc1-treatment groups (S2 Table). The venn diagram shows the number of genes with 1.5-fold changes among these groups, and the right table lists increased or decreased genes in IFNT2 vs. IFNTc1 group, which overlap with Ctrl vs. IFNT2 or Ctrl vs. IFNTc1 group (Fig 1A). Although RNA-seq analysis found that 12 gene expressions were increased or decreased, qPCR did not detect changes in those gene expressions (Fig 1B). A pair plot comparison of IFNT2 and IFNTc1 treatments showed that there were very few DEGs, which were confirmed with high degree of correlation coefficient, 0.99 (Fig 1C). These results indicated that IFNT2-induced DEGs were similar to those of IFNTc1 treatment in EECs.
Fig 1. Differential gene expression in bovine endometrial epithelial cells treated with IFNT2 or IFNTc1.

(A) Venn diagram shows the number of gene with 1.5-fold changes among Control (Ctrl), IFNT2, and IFNTc1 treatment groups, and right table lists increased or decreased genes in IFNT2 vs. IFNTc1 group, which overlap with Ctrl vs. IFNT2 or Ctrl vs. IFNTc1 group. (B) EECs were incubated without (Ctrl) or with IFNT2 or IFNTc1 (2 x 10⁵ cells/5000 IU/well) for 24 h. RNA was extracted from the EECs and subjected to real-time PCR analysis on mRNA expression with overlapping IFNT2 vs. IFNTc1 group with other groups. GAPDH mRNA was used as an internal control for RNA integrity. Value represent the mean ± SEM from three independent experiments in each treatment. (C) these diagrams show pair plots comparison among Ctrl, IFNT2, and IFNTc1, and density plots in each groups. Figures show correlation coefficient among Ctrl, IFNT2, and IFNTc1.
Increased DEGs from RNA-seq were then analyzed using the GO term (Enrichr; http://amp.pharm.mssm.edu/Enrichr/) and pathway analyses (WikiPathways; http://www.wikipathways.org/index.php/WikiPathways). These analyses detected 106 GO groups (S3 Table) and 4 pathways: 1) type II interferon signaling, 2) proteasome degradation, 3) type III interferon signaling, and 4) DNA damage response (Table 1). To further examine whether IFNTs regulated those 4 enriched pathways, all transcripts associated with these pathways were subjected to qPCR analysis. Transcripts except for ICAM1 and DDB2 were up-regulated by IFNT2 and IFNTc1, in agreement with those detected by the RNA-seq analysis (Fig 2).
Table 1. Genes related to IFNTs-induced enriched pathways in EECs.
| Pathway | P-value | Gene name | |
|---|---|---|---|
| 1 | Type II interferon signaling (IFNG) | 6.48E-07 | STAT1, STAT2 IFI6 EIF2AK2 TAP1, IRF8, ISG15, IRF9, PSMB9, ICAM1 |
| 2 | Proteasome Degradation | 6.44E-03 | UBA7, PSMA2 PSME1, PSME2, PSMB10, PSMB8, PSMB9 |
| 3 | Type III interferon signaling | 3.03E-02 | STAT1, STAT2, IRF9 |
| 4 | DNA Damage Response | 3.25E-02 | GADD45B, SFN, BID, ATRIP, PML, DDB2 |
Fig 2. Identification of gene expression induced by IFNTs in EECs.

EECs were incubated without (Ctrl) or with IFNT2 or IFNTc1 (2 x 10⁵ cells/5000 IU/well) for 24 h. RNA was extracted from the EECs and subjected to real-time PCR analysis to determine gene expression related to type II interferon, proteasome degradation, type III interferon, and DNA damage response signaling in Ctrl, IFNT2-, or IFNTc1-treated EECs (n = 3 each group). GAPDH mRNA was used as an internal control for RNA integrity. aP < 0.01, bP<0.05 vs. Ctrl. Value represent the mean ± SEM from three independent experiments in each treatment.
Determination of IFNTs downstream transcription factors
It is reported that IFNT binds its receptor, upon which transcription factors STAT1/2 and IRFs regulate the expression of interferon stimulated genes (ISGs) [15]. However, molecular mechanisms associated with IFNT-induced signaling pathway has not been well characterized. To identify transcription factors induced by IFNT stimulation in EECs, increased DEGs were subjected to GO term analysis. From the RNA-seq data, 17 transcription factors were identified as up-regulated DEGs (Table 2), among which 15 genes, FOXS1, STAT1, IRF9, ZNFX1, NFE2L3, IRF7, EGR1, GTF2B, STAT2, CSRNP1, DDIT3, HMGA1, ATF3, IRF8, and IRF3 were up-regulated in IFNT2- or IFNTc1-treated EECs (Fig 3). In both RNA-seq and qPCR analyses, FOXS1 exhibited the highest expression among these transcription factors.
Table 2. Transcriptional factors up-regulated by IFNTs in EECs.
| Accession No. | Gene | Fold change (IFNT2 /Ctrl) | Fold change (IFNTc1 /Ctrl) | |
|---|---|---|---|---|
| 1 | NM_001099716 | FOXS1 | 97.40 | 113.81 |
| 2 | NM_001077900 | STAT1 | 4.81 | 5.69 |
| 3 | NM_001024506 | IRF9 | 4.35 | 4.89 |
| 4 | NM_001205716 | ZNFX1 | 3.99 | 4.42 |
| 5 | NM_001077899 | NFE2L3 | 2.96 | 3.20 |
| 6 | NM_001105040 | IRF7 | 2.87 | 3.03 |
| 7 | NM_001045875 | EGR1 | 2.63 | 2.70 |
| 8 | NM_001046142 | GTF2B | 2.48 | 2.82 |
| 9 | NM_001205689 | STAT2 | 2.47 | 1.93 |
| 10 | NM_001098035 | CSRNP1 | 2.06 | 2.19 |
| 11 | NM_001078163 | DDIT3 | 1.94 | 2.11 |
| 12 | NM_001076523 | HMGA1 | 1.80 | 2.03 |
| 13 | NM_001046193 | ATF3 | 1.66 | 1.80 |
| 14 | NM_001083769 | IRF8 | 1.64 | 1.62 |
| 15 | NM_001075742 | TBP | 1.50 | 1.70 |
| 16 | NM_001029845 | IRF3 | 1.40 | 1.53 |
| 17 | NM_001040566 | RNF141 | 1.16 | 1.65 |
Fig 3. Determination of IFNTs’ downstream transcription factors.

EECs were incubated without (Ctrl) or with IFNT2 or IFNTc1 (2 x 10⁵ cells/5000 IU/well) for 24 h. RNA was extracted from the EECs and subjected to real-time PCR analysis to determine the expression of transcription factors in Ctrl, IFNT2-, or IFNTc1-treated EECs (n = 3 each group). GAPDH mRNA was used as an internal control for RNA integrity. aP < 0.01, bP<0.05 vs. Ctrl. Value represent the mean ± SEM from three independent experiments in each treatment.
Effects of FOXS1 knockdown on the expression of IFNTs downstream factors
To ascertain whether FOXS1 regulated the gene expression induced by IFNT2 or IFNTc1, we performed knockdown of FOXS1 by two siRNAs (#1 and #2), which specifically recognized FOXS1 mRNA sequences in different regions (Fig 4A). Two FOXS1 siRNAs down-regulated 9 genes, EIF2AK2, IRF3, HMGA1, IRF9, PSMA2, CSRNP1, PSME2, THRA, and ATF3, and up-regulated 9 genes, PSMB8, IRF8, PML, PSMB9, STAT1, ICAM1, STAT2, PSMB10, and SFN in IFNT2-treated EECs (Fig 4B). Similar to IFNT2 treatment, Two FOXS1 siRNAs regulated 18 gene expressions in IFNTc1-treated EECs (Fig 4C).
Fig 4. Effects of FOXS1 knockdown on the expression of IFNTs downstream factors.

(A-C) EECs were transfected with non-targeting control (Ctrl: 200 nM) or FOXS1 siRNA (#1 or #2: 200 nM) for 48h, and then incubated with IFNT2 (B) or IFNTc1 (C) (2 x 10⁵ cells/5000 IU/well) for 24 h. RNA was extracted from the EECs and subjected to real-time PCR analysis (n = 3 each group). GAPDH mRNA was used as an internal control for RNA integrity. Values represent the mean ± SEM from three independent experiments in each treatment.
Discussion
In this study, we first demonstrated the global gene expression of primary bovine EECs treated with IFNT2 or IFNTc1, and identified a novel FOXS1 signaling pathway, resulting in IFNT response. Although several studies have shown variants of IFNT transcripts [9, 12, 13], their regulation and effects on EECs have not been characterized. In this study, IFNT2 and IFNTc1 induced transcripts associated with 4 enriched pathways. In addition, IFNT2 and IFNTc1 up-regulated several transcription factors, among which FOXS1 was found as the highest expressed gene. Furthermore, the knockdown of FOXS1 down-regulated 9 genes including IRF3 and IRF9, and up-regulated 9 genes including STAT1, STAT2, and IRF8. These findings suggested that upon IFNT stimulation, FOXS1 could have mediated up- or down-regulation of IFNT-stimulated transcription factors such as STAT1, STAT2 and IRFs, followed by activation of type II interferon, proteasome degradation, type III interferon, and DNA damage response signaling pathways.
FOXS1 is Forkhead type transcription factor expressed in Sertoli cells and peri-endothelial cells of the developing mouse fetal testis [26]. Male and female Foxs1 knockout mice are fertile, but the mutant males accumulate blood in the fetal testis [26]. Foxs1 is also expressed in gonadal-like cells in Gata6 conditional knockout mice [27]. In addition to gonadal-like cells, Foxs1 is expressed in neural crest derivatives [28–30]. However, molecular mechanisms on how FOXS1 regulates those phenotypic changes have not been characterized. In this study, FOXS1 was up-regulated by IFNT2 and IFNTc1, and its knockdown regulated general IFNT-induced transcription factors such as STAT1 and STAT2 in bovine EECs. In addition, IFNA treatment similarly increased FOXS1, STAT1 and STAT2 expression (S1 Fig); however, type I IFNs such as IFNA and IFNB do not exist in the bovine and ovine uterine lumen during peri-implantation period. [12, 31]. In human dermal fibroblast cells, FOXS1, up-regulated by STAT4, induces the differentiation into myofibroblast [32]. In addition, we confirmed the presence of STAT1- or STAT2-binding elements on FOXS1 promoter region (S2 Fig). These findings suggested that activation of STAT1 or STAT2 could induce FOXS1 expression and FOXS1 then down-regulate STAT1 and STAT2 expression: possible negative feedback loop between FOXS1 and STAT1/2 in the bovine endometrial epithelium (Fig 5).
Fig 5. Diagram illustrating the potential role of IFNT through FOXS1 in EECs.
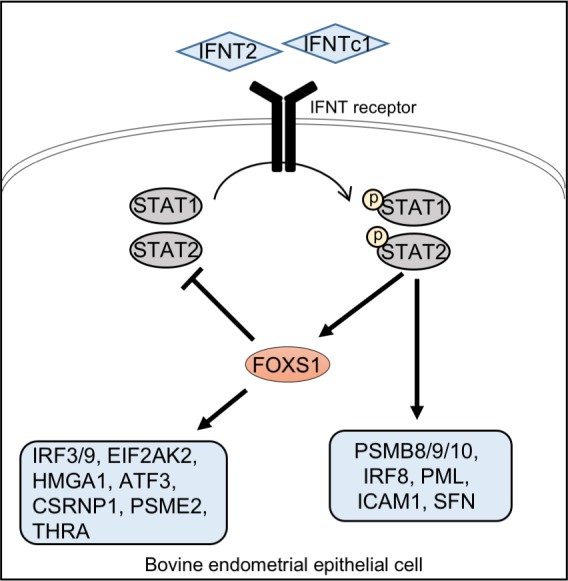
IFNT2 and IFNTc1 bind to their receptor and then activate STAT1 or STAT2. Activated STATs up-regulate FOXS1 expression, which down-regulates STATs expression, resulting in a negative feedback loop between STATs and FOXS1.
In the pro-inflammatory response to control the immune system, proteasomes are replaced with immunoproteasomes, which are induced by interferon-gamma (IFNG) and increase the production of peptides for presentation of MHC class I molecules [33]. The proteasome consists of three units, 20S proteasome, 19S regulator, and proteasome activator 28 (PA28), among which PA28 is composed of PSME1 and PSME2 [33]. 20S proteasome has 20 subunits, among which 3 subunits are replaced with PSMB8, PSMB9, and PSME10 by IFNG stimulation, resulting in immunoproteasome formation. In our results, IFNT2 and IFNTc1 up-regulated not only PSME1, PSME2, PSMB8, PSMB9, and PSMB10, but also class I antigen presentation-related genes such as BOLA-A, B2M, TAP1/2, and several ubiquitin ligases (S2 Table). These results were consistent with our and other previous studies which demonstrated changes in protein and gene expression during peri-implantation periods [11, 20, 34]. In addition, FOXS1 knockdown increased the expression of PSMB8, PSMB9, and PSMB10. These findings suggested that IFNT2 and IFNTc1 induced immunoproteasome formation and class I antigen presentation in endometrial epithelial cells, which could condition the EECs for interaction with semi-allogenic conceptuses.
Our previous study demonstrated that MX1, ISG12, ISG15, ISG17, IRF1, and IRF2 were similarly up-regulated by IFNT2 or IFNTc1 treatment, but MX2 was only up-regulated by IFNTc1 [23]. This study showed that IFNTc1 tended to increase the expression of MX2 compared with that of IFNT2. However, correlation coefficient of gene expression between IFNT2 and IFNTc1 was 0.99, indicating no or minimal difference in gene expression between IFNT2 and IFNTc1. The amino acid sequences of IFNT2 and IFNTc1 differ slightly, of which IFNTc1 has one casein kinase 2 phosphorylation domain whereas IFNT2 does not (S3 Fig). These results suggest that IFNT2 and IFNTc1 still differ in nucleotide structures and possibly functions, but further experiments are required to prove definitive functional differences between IFNT2 and IFNTc1.
In conclusion, this study demonstrated the global gene expression of IFNT2- or IFNTc1-treated primary bovine endometrial epithelial cell. One of these genes was transcription factor FOXS1, up-regulated by IFNT2 and IFNTc1, and its knockdown up-regulated STAT1 and STAT2. Therefore, FOXS1 could play a role as a negative feedback regulator of IFNTs signaling in bovine endometrial epithelial cells.
Supporting information
EECs were incubated without (Ctrl) or with IFNA (2 x 10⁵ cells/5000 IU/well) for 24 h. RNA was extracted from the EECs and subjected to real-time PCR analysis. GAPDH mRNA was used as an internal control for RNA integrity. aP < 0.01 vs. Ctrl. Values represent the mean ± SEM from three independent experiments in each treatment.
(TIFF)
(DOCX)
(DOCX)
(XLSX)
(XLSX)
(XLSX)
Acknowledgments
The authors would like to thank Drs. Kiyoshi Okuda (Obihiro University of Agriculture and Veterinary Medicine) and Yukiko Uno (Nagasaki University) for their generous gift of bovine endometrial epithelial cells (EECs) and assistance in production and purification of recombinant IFNTs, respectively. The authors also wish to thank Mr. Robert Moriarty for his English editing.
Data Availability
All relevant data are within the paper and its Supporting Information files.
Funding Statement
This work was supported by Ministry of Agriculture, Forestry and Fisheries (25030AB), http://www.maff.go.jp/e/index.html (to KI); and Japan Society for the Promotion of Science (15K18767), https://www.jsps.go.jp (to KK). These funders had roles in study design, data collection and analysis, decision to publish, or preparation of the manuscript.
References
- 1.Roberts RM, Cross JC, Leaman DW. Interferons as hormones of pregnancy. Endocr Rev. 1992; 13:432–452. 10.1210/edrv-13-3-432 [DOI] [PubMed] [Google Scholar]
- 2.Imakawa K, Anthony RV, Kazemi M, Marotti KR, Polites HG, Roberts RM. Interferon-like sequence of ovine trophoblast protein secreted by embryonic trophectoderm. Nature. 1987; 330:377–379. 10.1038/330377a0 [DOI] [PubMed] [Google Scholar]
- 3.Antoniazzi AQ, Webb BT, Romero JJ, Ashley RL, Smirnova NP, Henkes LE, et al. Endocrine delivery of interferon tau protects the corpus luteum from prostaglandin F2 alpha-induced luteolysis in ewes. Biol Reprod. 2013; 88:144 10.1095/biolreprod.112.105684 [DOI] [PubMed] [Google Scholar]
- 4.Romero JJ, Antoniazzi AQ, Nett TM, Ashley RL, Webb BT, Smirnova NP, et al. Temporal Release, Paracrine and Endocrine Actions of Ovine Conceptus-Derived Interferon-Tau During Early Pregnancy. Biol Reprod. 2015; 93:146 10.1095/biolreprod.115.132860 [DOI] [PubMed] [Google Scholar]
- 5.Godkin JD, Bazer FW, Roberts RM. Ovine trophoblast protein 1, an early secreted blastocyst protein, binds specifically to uterine endometrium and affects protein synthesis. Endocrinology. 1984; 114:120–130. 10.1210/endo-114-1-120 [DOI] [PubMed] [Google Scholar]
- 6.Salamonsen LA, Stuchbery SJ, O’Grady CM, Godkin JD, Findlay JK. Interferon-a mimics effects of ovine trophoblast protein-1 on prostaglandin and protein secretion by ovine endometrial cells. J Endocrinology. 1988; 117:R1–R4. [DOI] [PubMed] [Google Scholar]
- 7.Spencer TE, Bazer FW. Ovine interferon-s suppresses transcription of the estrogen receptor and oxytocin receptor genes in the ovine endometrium. Endocrinology. 1996; 137:1144–1147. 10.1210/endo.137.3.8603586 [DOI] [PubMed] [Google Scholar]
- 8.Ideta A, Hayama K, Nakamura Y, Sakurai T, Tsuchiya K, Tanaka S, et al. Intrauterine administration of peripheral blood mononuclear cells enhances early development of the pre-implantation bovine embryo. Mol Reprod Dev. 2010; 77:954–962. 10.1002/mrd.21243 [DOI] [PubMed] [Google Scholar]
- 9.Sakurai T, Nakagawa S, Kim MS, Bai H, Bai R, Li J, et al. Transcriptional regulation of two conceptus interferon tau genes expressed in Japanese black cattle during peri-implantation period. PLoS One. 2013; 8:e80427 10.1371/journal.pone.0080427 [DOI] [PMC free article] [PubMed] [Google Scholar]
- 10.Bai R, Kusama K, Sakurai T, Bai H, Wang C, Zhang J, et al. Involvement of VCAM1 in the bovine conceptus adhesion to the uterine endometrium. Reproduction. 2015; 148:119–127. [DOI] [PubMed] [Google Scholar]
- 11.Kusama K, Bai R, Ideta A, Aoyagi Y, Okuda K, Imakawa K. Regulation of epithelial to mesenchymal transition in bovine conceptuses through the interaction between follistatin and activin A. Mol Cell Endocrinol. 2016; 434:81–92. 10.1016/j.mce.2016.06.017 [DOI] [PubMed] [Google Scholar]
- 12.Ealy AD, Larson SF, Liu L, Alexenko AP, Winkelman GL, Kubisch HM, et al. Polymorphic forms of expressed bovine interferon-tau genes: Relative transcripts abundance during early placental development promoter sequences of genes and biological activity of protein products. Endocrinology. 2001; 142:2906–2915. 10.1210/endo.142.7.8249 [DOI] [PubMed] [Google Scholar]
- 13.Walker AM, Kimura K, Roberts RM. Expression of bovine interferon-tau variants according to sex and age of conceptuses. Theriogenology. 2009; 71:44–53. [DOI] [PMC free article] [PubMed] [Google Scholar]
- 14.Nakagawa S, Bai H, Sakurai T, Nakaya Y, Konno T, Miyazawa T, et al. Dynamic evolution of endogenous retrovirus-derived genes expressed in bovine conceptuses during the period of placentation. Genome Biol Evol. 2013; 5:296–306. 10.1093/gbe/evt007 [DOI] [PMC free article] [PubMed] [Google Scholar]
- 15.Spencer TE, Sandra O, Wolf E. Genes involved in conceptus-endometrial interactions in ruminants: insights from reductionism and thoughts on holistic approaches. Reproduction. 2008; 135:165–179. 10.1530/REP-07-0327 [DOI] [PubMed] [Google Scholar]
- 16.Mansouri-Attia N, Aubert J, Reinaud P, Giraud-Delville C, Taghouti G, Galio L, et al. Gene expression profiles of bovine caruncular and intercaruncular endometrium at implantation. Physiol Genomics. 2009; 39:14–27. 10.1152/physiolgenomics.90404.2008 [DOI] [PubMed] [Google Scholar]
- 17.Forde N, Carter F, Fair T, Crowe MA, Evans AC, Spencer TE, et al. Progesterone-regulated changes in endometrial gene expression contribute to advanced conceptus development in cattle. Biol Reprod. 2009; 81:784–794. 10.1095/biolreprod.108.074336 [DOI] [PubMed] [Google Scholar]
- 18.Forde N, Beltman ME, Duffy GB, Duffy P, Mehta JP, O'Gaora P, et al. Changes in the endometrial transcriptome during the bovine estrous cycle: effect of low circulating progesterone and consequences for conceptus elongation. Biol Reprod. 2011; 84:266–278. 10.1095/biolreprod.110.085910 [DOI] [PubMed] [Google Scholar]
- 19.Forde N, Carter F, Spencer TE, Bazer FW, Sandra O, Mansouri-Attia N, et al. Conceptus-induced changes in the endometrial transcriptome: how soon does the cow know she is pregnant? Biol Reprod. 2011; 85:144–156. 10.1095/biolreprod.110.090019 [DOI] [PubMed] [Google Scholar]
- 20.Forde N, Duffy GB, McGettigan PA, Browne JA, Mehta JP, Kelly AK, et al. Evidence for an early endometrial response to pregnancy in cattle: both dependent upon and independent of interferon tau. Physiol Genomics. 2012; 44:799–810. 10.1152/physiolgenomics.00067.2012 [DOI] [PubMed] [Google Scholar]
- 21.Sakurai T, Bai H, Bai R, Sato D, Arai M, Okuda K, et al. Down-regulation of interferon tau gene transcription with a transcription factor, EOMES. Mol Reprod Dev. 2013; 80:371–383. 10.1002/mrd.22171 [DOI] [PubMed] [Google Scholar]
- 22.Kusama K, Bai R, Sakurai T, Bai H, Ideta A, Aoyagi Y, et al. A transcriptional cofactor YAP regulates IFNT expression via transcription factor TEAD in bovine conceptuses. Domest Anim Endocrinol. 2016; 57:21–30. 10.1016/j.domaniend.2016.05.002 [DOI] [PubMed] [Google Scholar]
- 23.Kim MS, Min KS, Imakawa K. Regulation of Interferon-stimulated Gene (ISG)12, ISG15, and MX1 and MX2 by Conceptus Interferons (IFNTs) in Bovine Uterine Epithelial Cells. Asian-Australas J Anim Sci. 2013; 26:795–803. 10.5713/ajas.2012.12529 [DOI] [PMC free article] [PubMed] [Google Scholar]
- 24.Tanikawa M, Lee HY, Watanabe K, Majewska M, Skarzynski DJ, Park SB, et al. Regulation of prostaglandin biosynthesis by interleukin-1 in cultured bovine endometrial cells. J Endocrinol. 2008; 199:425–434. 10.1677/JOE-08-0237 [DOI] [PubMed] [Google Scholar]
- 25.Rubinstein S, Familletti PC, Pestka S. Convenient assay for interferons. J Virol. 1981; 37:755–758. [DOI] [PMC free article] [PubMed] [Google Scholar]
- 26.Sato Y, Baba T, Zubair M, Miyabayashi K, Toyama Y, Maekawa M, et al. Importance of forkhead transcription factor Fkhl18 for development of testicular vasculature. Mol Reprod Dev. 2008; 75:1361–1371. 10.1002/mrd.20888 [DOI] [PubMed] [Google Scholar]
- 27.Pihlajoki M, Gretzinger E, Cochran R, Kyrönlahti A, Schrade A, Hiller T, et al. Conditional mutagenesis of Gata6 in SF1-positive cells causes gonadal-like differentiation in the adrenal cortex of mice. Endocrinology. 2013; 154:1754–1767. 10.1210/en.2012-1892 [DOI] [PMC free article] [PubMed] [Google Scholar]
- 28.Heglind M, Cederberg A, Aquino J, Lucas G, Ernfors P, Enerbäck S. Lack of the central nervous system- and neural crest-expressed forkhead gene Foxs1 affects motor function and body weight. Mol Cell Biol. 2005; 25:5616–5625. 10.1128/MCB.25.13.5616-5625.2005 [DOI] [PMC free article] [PubMed] [Google Scholar]
- 29.Montelius A, Marmigère F, Baudet C, Aquino JB, Enerbäck S, Ernfors P. Emergence of the sensory nervous system as defined by Foxs1 expression. Differentiation. 2007; 75:404–417. 10.1111/j.1432-0436.2006.00154.x [DOI] [PubMed] [Google Scholar]
- 30.Schillebeeckx M, Pihlajoki M, Gretzinger E, Yang W, Thol F, Hiller T, et al. Novel markers of gonadectomy-induced adrenocortical neoplasia in the mouse and ferret. Mol Cell Endocrinol. 2015; 399:122–130. 10.1016/j.mce.2014.09.029 [DOI] [PMC free article] [PubMed] [Google Scholar]
- 31.Nephew KP, Whaley AE, Christenson RK, Imakawa K. Differential expression of distinct mRNAs for ovine trophoblast protein-1 and related sheep type I interferons. Biol Reprod. 1993; 48:768–778. [DOI] [PubMed] [Google Scholar]
- 32.Noizet M, Lagoutte E, Gratigny M, Bouschbacher M, Lazareth I, Roest Crollius H, et al. Master regulators in primary skin fibroblast fate reprogramming in a human ex vivo model of chronic wounds. Wound Repair Regen. 2016; 24:247–262. 10.1111/wrr.12392 [DOI] [PubMed] [Google Scholar]
- 33.Groettrup M, Kirk CJ, Basler M. Proteasomes in immune cells: more than peptide producers? Nat Rev Immunol. 2010; 10:73–78. 10.1038/nri2687 [DOI] [PubMed] [Google Scholar]
- 34.Forde N, McGettigan PA, Mehta JP, O'Hara L, Mamo S, Bazer FW, et al. Proteomic analysis of uterine fluid during the pre-implantation period of pregnancy in cattle. Reproduction. 2014; 147:575–587. 10.1530/REP-13-0010 [DOI] [PubMed] [Google Scholar]
Associated Data
This section collects any data citations, data availability statements, or supplementary materials included in this article.
Supplementary Materials
EECs were incubated without (Ctrl) or with IFNA (2 x 10⁵ cells/5000 IU/well) for 24 h. RNA was extracted from the EECs and subjected to real-time PCR analysis. GAPDH mRNA was used as an internal control for RNA integrity. aP < 0.01 vs. Ctrl. Values represent the mean ± SEM from three independent experiments in each treatment.
(TIFF)
(DOCX)
(DOCX)
(XLSX)
(XLSX)
(XLSX)
Data Availability Statement
All relevant data are within the paper and its Supporting Information files.