

Abstract
We used latent class analysis (LCA) to identify heterogeneous subgroups with respect to behavioral obesity risk factors in a sample of 4th grade children (n = 997) residing in Southern California. Multiple dimensions assessing physical activity, eating and sedentary behavior, and weight perceptions were explored. A set of 11 latent class indicators were used in the analysis. The final model yielded a five-class solution: “High-sedentary, high-fat/high-sugar (HF/HS) snacks, not weight conscious,” “dieting without exercise, weight conscious,” “high-sedentary, HF/HS snacks, weight conscious,” “active, healthy eating,” and “low healthy, snack food, inactive, not weight conscious.” The results suggested distinct subtypes of children with respect to obesity-related risk behaviors. Ethnicity, gender, and a socioeconomic status proxy variable significantly predicted the above latent classes. Overweight or obese weight status was determined based on the Centers for Disease Control and Prevention BMI (kg/m2)-for-age-and-sex percentile (overweight, 85th percentile ≤BMI <95th percentile; obese, 95th percentile ≤BMI). The identified latent subgroup membership, in turn, was associated with the children’s weight categories. The results suggest that intervention programs could be refined or targeted based on children’s characteristics to promote effective pediatric obesity interventions.
INTRODUCTION
Nearly one in three children in the United States faces excess weight and related health problems (1). Childhood obesity is related to health, psychological, and behavioral problems (2). Furthermore, childhood obesity is the strongest predictor of adulthood obesity (2). In an effort to combat childhood obesity, many intervention programs for children and adolescents have been developed and implemented. These include pharmacological (3), dietary (4), and/or physical activity interventions (5). A recent meta-analysis suggested that obesity prevention programs that encourage combined lifestyle changes with targeted family involvement tend to be most effective (6). However, overall effect sizes of these interventions were generally small to moderate (6). Unfortunately, the long-term effectiveness of intervention programs remains unclear (7). Dobbins et al. (8) conducted a systematic review of 26 studies to evaluate the effectiveness of school-based physical activity intervention programs. They concluded that such intervention had positive effects on physical activity, television viewing, and blood cholesterol, but not on other health indicators such as blood pressure, BMI, and pulse rate. Similarly, another meta-analysis showed that school-based physical activity interventions did not improve BMI among children (9).
Typically school-based obesity prevention programs include all students in order to avoid stigmatization (10). Here, students assigned to intervention condition groups receive the same intervention material without regard to individual needs whereas children in the comparison group condition receive schools’ standard health curriculum. Thus, intervention condition children with no weight issues may receive the same intervention as those with excessive weight. Consequently, individual differences in obesity-related behaviors (e.g., sedentary behaviors, food intake, and physical activity) are often not taken into account in intervention research. These individual differences inherently exist in the population but may not be explicitly observed. Nevertheless, these diverse characteristics might have a significant impact on success of an intervention program as they could be crucially associated with children’s risk of obesity. Identifying such heterogeneity would help tailoring existing intervention programs according to personal levels of these behaviors and also improve targeting of at-risk groups.
It has been well-documented that risks for excess weight are differentially distributed across ethnic and socioeconomic groups. Hispanic and African-American children, in particular, are more likely to be overweight, compared to their nonHispanic white counterparts (11,12). Similarly, socioeconomically disadvantaged children are also at elevated risk of being overweight (12). In addition, gender differences among elementary school-aged children have been observed in overweight/obesity prevalence (13), moderate and vigorous physical activity levels (14–16) and time spent watching television or playing video games (15). Thus, examining the extent to which these demographic variables are associated with the distinct subgroups is important.
A person-centered analytic approach is an innovative statistical method that allows for such distinctions (17). In identifying distinct sub-populations, latent class analysis (LCA) uses categorical and cross-sectional observed indicators to examine varying constellations of response patterns. In contrast to the traditional, variable-centered approach, LCA yields unobserved (latent) classes of people in an attempt to arrive at the smallest number of latent classes (17). LCA is similar to cluster analysis because it categorizes people into separate groups. However, LCA is based on measurement theory (i.e., true and error scores) and can quantify the extent to which indicators are not perfectly related to class membership (i.e., measurement error) (18). The goal of LCA is to ascertain the most parsimonious and interpretable set of classes. The resulting categorical latent variable (i.e., latent class variable) represents the groups of homogeneous individuals within the class to which they belong. These groups of individuals are heterogeneous across different classes. LCA models estimate the probabilities of identified classes and probabilities of responses for each indicator, conditional on class membership. Further, probabilities for each class are also estimated for each individual (i.e., posterior probabilities) (17).
Recently, LCA has been used to examine latent subgroups regarding weight loss strategies used among women (18), parenting characteristics associated with children’s BMI (19), and maternal pregnancy weight status associated with Attention Deficit Hyperactivity Disorder symptoms in their offspring (20). These study results have demonstrated that LCA is an effective and valid approach in categorizing individuals with similar characteristics.
The goal of the current study was to identify distinct subtypes of children with respect to their eating, physical activity patterns, and weight perceptions. We hypothesized that (i) distinctive classes of behavioral patterns would be identified, (ii) demographic covariates (Hispanic/African-American ethnicity, socioeconomic status proxy, and gender) would significantly predict the classes as identified, and (iii) the classes would be significantly associated with children’s weight status, measured according to BMI. The third hypothesis was tested for the purpose of checking the validity of the identified latent classes.
METHODS
Data
This study is part of a larger trial for prevention of childhood obesity, pathways to health (Pathways). Pathways is a school-based, randomized trial for an obesity prevention program to promote healthy eating and physical activity in a cohort of 4th grade students followed through the 6th grade residing in Southern California. Detailed descriptions of the project are available elsewhere (21,22). Pathways includes a total sample of 1,587 students, of which 1,005 are tracked over time with full parental consents (hereafter referred to as “panel sample”). The remaining sample (hereafter referred to as “anonymous sample”) consists of students from the same class and/or schools tracked as a grade cohort over time (N = 582). Height and weight of the anonymous sample were not measured because active parental consents were not obtained. Because cross-sectional indicators are used in LCA, the sample was restricted to those with data at baseline (before participants began the intervention program). The study was approved by the University of Southern California Institutional Review Board.
Sample and measures
For the present study, data from the panel were used (N = 1,005). Our sample consisted of the 4th grade children measured at baseline (mean age = 9.26 years, s.d. = 0.48). Eight participants failed to provide ethnicity and/or free lunch information. Thus, the final sample size for this study was 997. Our sample included slightly more boys (51.86%) than girls. The sample was ethnically diverse: 29.79% Hispanic, 2.81% African American, 28.08% nonHispanic Whites, 8.12% Asian, 14.94% mixed/bi-racial, and 16.25% other. Approximately 25% of the sample received free/reduced lunch.
The measures included 16 physical activity, eating behaviors and attitudes items selected from a 153-item self-report survey. Height and weight anthropomorphic data were collected using a standardized protocol. These measures were converted to BMI (kg/m2). The mean BMI at baseline was 19.12 (s.d. = 3.82). The Center for Disease Control (CDC) categorization of BMI percentile-for-age-and-sex was used (underweight, BMI <5th percentile; healthy weight, 5th percentile ≤BMI <85th percentile; overweight, 85th percentile ≤BMI <95th percentile; obese, BMI ≥95th percentile).
Latent class indicators
The latent class indicators were selected to represent theoretically/clinically relevant, multiple dimensions of obesity risks. Binary latent class indicators were created to best reflect existing recommendations and/or suggestions by the CDC or other experts (e.g., 15). These observed variables, used as the latent class indicators, represented the following five dimensions: (i) physical activity, (ii) sedentary behavior, (iii) unhealthy eating behavior, (iv) healthy eating behavior, and (v) weight perception and related action. These items are shown in Table 2.
Table 2.
Proportion of total sample (N = 997) and probabilities of meeting criteria for physical activity, sedentary behavior, food intake, conditional on latent class membership
| Total sample (N = 997) | Class 1 (15.9%; n = 159) high-sedentary, HF/HS snacks, weight conscious | Class 2 (24.9%; n = 248) dieting without exercise, weight conscious | Class 3 (13.3%; n = 133) high-sedentary, HF/HS snacks, not weight conscious | Class 4 (13.7%; n = 137) active, healthy eating | Class 5 (32.1%; n = 320) low healthy and snack food, inactive, not weight conscious | |
|---|---|---|---|---|---|---|
| Physical activity | ||||||
| Hard activities (daily, 30+ min) | 0.28 | 0.22 | 0.23 | 0.24 | 0.54 | 0.27 |
| Team sports (1+) | 0.70 | 0.69 | 0.67 | 0.64 | 0.81 | 0.70 |
| Sedentary behavior | ||||||
| Screen time (2+ h/day) | 0.55 | 0.86 | 0.38 | 0.88 | 0.33 | 0.48 |
| High-fat and/or high-sugar (HF/HS) snacking | ||||||
| Salty high-fat snack food (≥daily) | 0.38 | 0.71 | 0.17 | 0.83 | 0.23 | 0.23 |
| High-sugar snack food (≥daily) | 0.31 | 0.66 | 0.06 | 0.84 | 0.13 | 0.15 |
| Soda (≥4–6 times/week) | 0.15 | 0.35 | 0.03 | 0.52 | 0.03 | 0.01 |
| Healthy eating | ||||||
| Any fruits (≥daily consumption) | 0.29 | 0.29 | 0.17 | 0.22 | 0.91 | 0.15 |
| Any vegetable (≥daily consumption) | 0.28 | 0.25 | 0.15 | 0.29 | 0.85 | 0.13 |
| Weight perception and related action | ||||||
| Think overweight | 0.21 | 0.41 | 0.45 | 0.06 | 0.18 | 0.00 |
| Trying to lose weight | 0.46 | 1.00 | 0.93 | 0.04 | 0.47 | 0.01 |
| Exercise to lose weight | 0.60 | 0.78 | 0.85 | 0.29 | 0.75 | 0.36 |
Physical activity
Two individual items assessing children’s levels of physical activity were used: (i) frequency and (ii) duration of hard physical activities (i.e., activities that cause hard breathing and perspiration) were combined to identify children meeting the criteria for daily hard activities lasting >30 min (23). In addition, one item assessing team sport participation was used. The children who reported participating in one or more team sports were distinguished from those who participated in none.
Two individual items assessing the levels of sedentary behaviors were combined. The American Academy of Pediatrics recommends no >2 h of television viewing and/or videogame playing (15,16). Thus, those who engaged in >2 h of screen time per day (i.e., watching television and/or playing video game) were coded as “high-sedentary”.
High-fat and/or high-sugar snacking
We define “high-fat and/or high-sugar (HF/HS) snacking” as reported HF/HS snack consumption at least once per day and/or soda consumption more than four to six times a week (24). Specific servings or portions were not available in this data set. Instead, two items were combined to assess consumption of salty, HF snacks (e.g., corn chips, French fries, crackers) at least once per day. Similarly, additional two items were combined to assess daily consumption of HS snacks (e.g., doughnuts, candy, cookies) at least once per day. Drinking soda more than four to six times a week (15.3%) was also considered HS snacking.
Healthy eating behavior
The CDC recommends daily four to five servings of vegetable and fruits for an average, active 4th grade child (25). Neither portions nor daily frequency of consumption were measured in the current data set. It has been previously found that daily fruit and vegetable intakes assessed by brief frequency questionnaires (e.g., Brief Risk Factor Surveillance System) yielded similar estimates of daily servings measured by more extensive dietary assessments (26,27). In the present study, children were asked to indicate how often per week they consumed (i) green salad, (ii) any other vegetable, and (iii) any fruit. The first two items were combined to assess daily vegetable consumption. The third item was used to measure daily fruit consumption. Therefore, children who reported daily consumption of vegetables and who reported daily consumption of fruits were identified as exhibiting healthy eating behavior.
Weight perception and related behaviors
Three individual items were used to measure the children’s weight perception and attitudes about eating and exercise (28); these items were dichotomously coded. Specifically, children who thought they were overweight were assigned a code of “1” whereas others who thought they were underweight or normal weight were coded as “0”. Additionally, children who reported they were “trying to lose weight” were coded as “1” vs. to stay the same or gain weight as “0”. Also, children who indicated that they “exercised to lose weight” were coded as “1”.
Statistical analysis
LCA is an optimal strategy for identifying unobserved (latent) sub-populations represented in a heterogeneous sample. The Mplus Version 5.0 software program (Mplus, Los Angeles, CA) was used (29). To identify a finite number of latent classes (i.e., hypothesis 1), a series of latent class models were conducted. Several model-fit indexes including Pearson χ2, likelihood ratio χ2, Akaike information criterion and Bayesian information criterion were evaluated. As the number of classes increased, Akaike information criterion and Bayesian information criterion decreased, indicating improved model fit. Lo-Mendell-Rubin likelihood ratio compares n vs. n−1 class models (i.e., reject the null hypothesis that n–1 class is better than n class model, P < 0.05) (30). The Lo-Mendell-Rubin likelihood ratio test clearly favored the five-class model as better fitting model than the six-class model (Table 1). Content and distinctiveness of each class were also carefully considered to arrive at the best fitting model. The major distinction between four-class and five-class models was that the group characterized as high-sedentary behavior and HF/HS snack consumption in the four-class model were further classified into “high-sedentary, HF/HS sugar snacks, weight conscious” and “high-sedentary, HF/HS snacks, not weight conscious.”
Table 1.
Model-fit indexes for latent class models
| Number of classes
|
|||||
|---|---|---|---|---|---|
| 2 | 3 | 4 | 5 | 6 | |
| Pearson χ2 | 3828.154 | 2657.148 | 2385.313 | 2310.833 | 2121.174 |
| LR χ2 | 1616.984 | 1254.783 | 1152.538 | 1073.183 | 1012.090 |
| χ2 df | 1998 | 1983 | 1972 | 1963 | 1951 |
| # Of parameters | 23 | 35 | 47 | 59 | 71 |
| Loglikelihood | −6392.386 | −6219.606 | −6156.493 | −6114.773 | −6082.575 |
| AIC | 12830.773 | 12509.213 | 12406.986 | 12347.546 | 12307.150 |
| BIC | 12943.766 | 12681.159 | 12637.885 | 12637.398 | 12655.955 |
| Lo-Mendell-Rubin testing the null hypothesis | 1 vs. 2 Classes | 2 vs. 3 Classes | 3 vs. 4 Classes | 4 vs. 5 Classes | 5 vs. 6 Classes |
| LMR probability | <0.001 | <0.001 | 0.032 | 0.003 | 0.096 |
AIC, Akaike information criterion; BIC, Bayesian information criterion; LMR, Lo-Mendell-Rubin; LR, likelihood ratio.
To test hypothesis 2, demographic covariates (African American/Hispanic vs. others, gender, reduced/free lunch) were used as predictors for class categories. Item-response probabilities for each class are represented in Table 2 and Figure 1. Thereafter, hypothesis 3 was tested descriptively by examining the association between latent classes and observed weight status.
Figure 1.
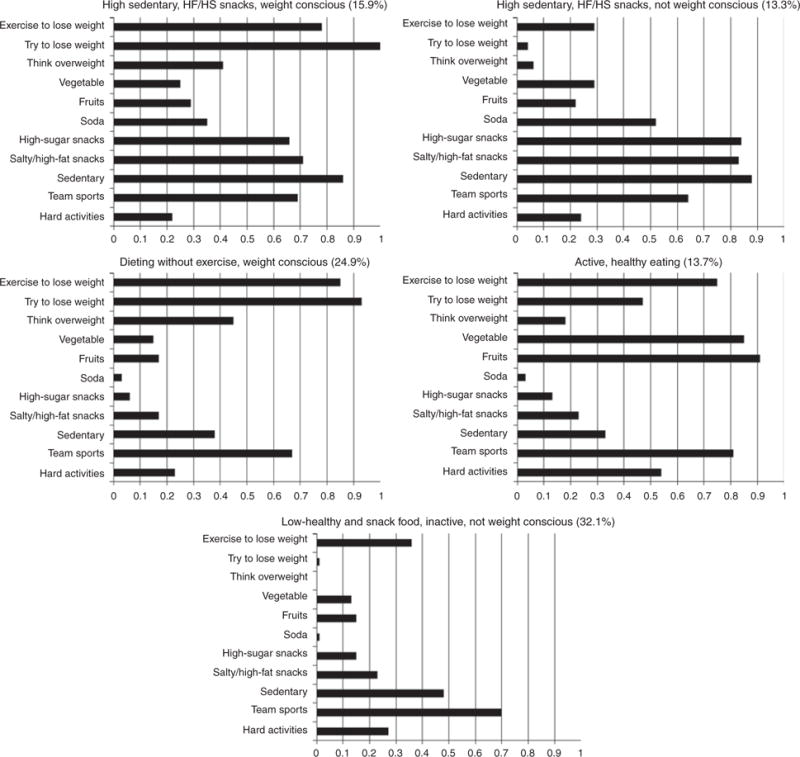
Probability of responding “yes” to obesity risk items conditional on class membership (n = 997).
RESULTS
Five latent classes
The final solution yielded a five-class model. The response pattern characterized by high probabilities of engaging in two or more screen hours per day, HF/HS snack food intake, and notably high probability of “trying to lose weight” is identified as latent class 1 “high-sedentary, HF/HS snacks, weight conscious.” As can be seen in Table 2, 15.9% of the children were expected to belong to latent class 1. The response pattern characterized by low probability of engaging in hard activities, high probabilities for negative weight perception and exercise to lose weight was identified as latent class 2 “dieting without exercise, weight conscious.” About 25% of the children were expected to belong to latent class 2. Similar to latent class 1, response pattern identified as class 3 showed relatively high probabilities of HF/HS snack consumption and low healthy food. Despite similar HF/HS snacks consumption and inactivity patterns, the response pattern identified as class 3 (13.3%) was differentiated by low probabilities of being weight conscious, hence “high-sedentary, HF/HS snacks, not weight conscious.” The children reporting high probability of being active and showing high probabilities of daily fruits and vegetable consumption and low unhealthy food intake were expected to belong to latent class 4 “active, healthy eating” (13.7%). Lastly, the response pattern characterized by low probability of being active, low probability of healthy or HF/HS snacks intake, moderately sedentary, low probability of weight consciousness was identified as latent class 5 and labeled “low healthy and snack food, inactive, not weight conscious.” latent class 5 was the most prevalent category (32.1%).
Covariates predicting latent class membership
The majority of the children (32.1%) were most likely to be members of class 5, “low healthy and snack food, inactive, not weight conscious.” Relative to this “normative” latent category, Hispanic/African-American children were significantly more likely to be classified as “high-sedentary, HF/HS snacks, weight conscious (class 1)” (odds ratio (OR) = 3.04, P < 0.001) or “High-sedentary, HF/HS snacks, not weight conscious (class 3)” (OR = 2.10, P = 0.012); they were marginally more likely to be classified as “dieting without exercise, weight conscious (class 2)” (OR = 1.76, P = 0.053; Table 3). Similarly, those receiving free/reduced lunch were more likely to be classified as class 1 (OR = 2.07, P = 0.024) or class 3 (OR = 2.18, P =0.010). Further, relative to class 5, girls were significantly less likely than boys to be categorized as class 3 (OR = 0.43, P = 0.032).
Table 3.
Logit estimates for predictors on latent class membership (N = 997)
| Covariate | Class 1 (15.9%; n = 159) |
Class 2 (24.9%; n = 248) |
Class 3 (13.3%; n = 133) |
Class 4 (13.7%; n = 137) |
Class 5 (32.1%; n = 320) |
|---|---|---|---|---|---|
| Intercept | −1.02 | −0.46 | −0.73 | −0.89 | (0.00) |
| Hispanic/African American | 1.11*** | 0.56* | 0.74** | 0.37 | (0.00) |
| Female | −0.45 | 0.27 | −0.85** | 0.24 | (0.00) |
| Free lunch | 0.73** | 0.03 | 0.78** | −0.61 | (0.00) |
| Intercept | −0.13 | 0.43 | 0.17 | (0.00) | 0.89 |
| Hispanic/African American | 0.74* | 0.19 | 0.37 | (0.00) | −0.37 |
| Female | −0.68* | 0.03 | −1.09*** | (0.00) | −0.24 |
| Free lunch | 1.33*** | 0.63 | 1.39*** | (0.00) | 0.61 |
P < 0.10;
P < 0.05;
P < 0.01.
Relative to “active, healthy eating (class 4)”, Hispanic/African American children were marginally more likely to be classified as class 1 (OR = 2.10, P = 0.060). Girls were significantly less likely than boys to belong to class 3 (OR = 0.34, P = 0.005). Relative to class 4, those receiving free/reduced lunch were significantly more likely to be categorized as class 1 or class 3 (OR = 3.79, P = 0.002; OR = 4.00, P = 0.001, respectively).
Association of the latent classes with weight status
Based on the sex-and-age adjusted BMI cutoff percentile, 168 children (17.0%) were overweight and 238 children (24.1%) were obese in our sample (n = 986). BMI for 19 children could not be calculated due to one or more points of missing data.
A significant association between latent classes and weight status was revealed (χ2 = 279.852, P < 0.001). It is important to determine whether the latent classes are associated with actual weight status of children. For example, obesity intervention programs targeting class 1 would be beneficial if and only if members of class 1 are actually overweight.
In fact, weight status was disproportionately distributed across the five latent classes. Specifically, obesity (BMI ≥95th percentile) was much more frequently observed in class 1 and class 2. As expected, more than two thirds of children in class 1 (68.5%) were overweight or obese. However, even more children in class 2 (72.0%) were overweight or obese, despite reporting dieting to control weight (see Figure 2). Healthy weight (5th < BMI <85th percentile) was equally prevalent in class 3 (79.5%) and class 5 (82.6%). Substantially smaller proportions of children classified in classes 3, 4, and 5 were identified as overweight or obese (17.4, 38.2, 14.2%, respectively).
Figure 2.
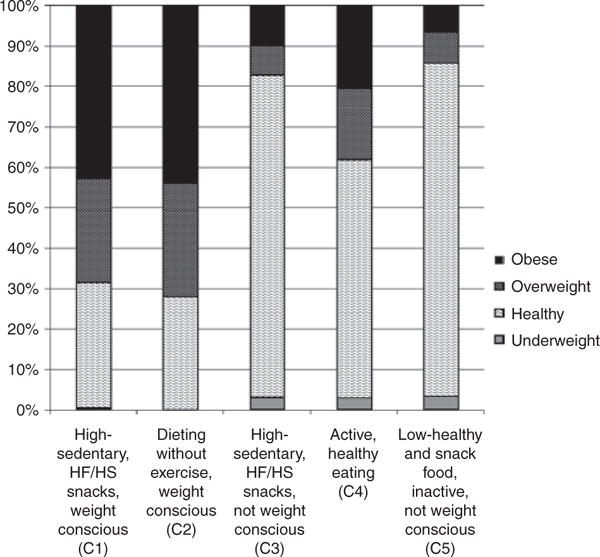
Weight status distribution of the five latent classes.
DISCUSSION
Five distinct subtypes of children were identified using multiple dimensions of obesity risks, providing support for our first hypothesis. Furthermore, important demographic characteristics significantly predicted these latent classes. The latent subtypes, in turn, were significantly associated with the weight categories defined by BMI. Thus, children who reported greater HF/HS snack food consumption, lower physical activity, and overweight perception were in fact likely to be overweight or obese, with the exception of class 3 “high-sedentary, HF/HS snacks, not weight conscious”. Initially, there were concerns about considering children’s weight perceptions as they are susceptible to biases. To the contrary, weight perceptions of our sample were found to be more accurate than expected. For instance, a majority of the children expected to belong to class 1 or class 2 showed a range of problematic BMIs. In contrast, the distribution of BMI of the children expected to belong to class 3 did indeed contain a wide range of healthy weight.
Class 3, in particular, deserves further discussion. This class may represent a category of obesity risk behavior/response patterns that have not yet resulted in excessive weight, nonetheless, still place children at elevated risk of obesity in near future. In other words, primary prevention might be most opportune and effective with children with such behavioral/response patterns. It remains to be seen whether the children expected to belong to this latent class would be most likely to benefit from the intervention focusing on healthy eating and promoting physical activities. These results support the use of LCA. Thus, the person-centered analytic approach has once again been shown to be an effective and valid method to organize patterns of responses.
Our findings call for refinement of obesity intervention programs to account for heterogeneous characteristics of the children. As shown in our study, such distinctions can be achieved by a person-centered empirical approach such as LCA. In addition to universal intervention, a more targeted approach may be necessary. Also, a sequential approach might be an alternative in which children initially engage in a universal prevention program for healthy eating and physical activity, followed by self-prescribed applications through homework and extracurricular activities (31). For example, children in class 4 (“active, healthy eating”) might be assigned homework to raise self-awareness about how they can continue to maintain healthy eating and activity patterns if they are in situations where opportunities for both are few. This sequential approach may have an advantage over recruitment or assignment of children into client-specific interventions involving excessive weight, which may inadvertently result in stigmatization among peers. Thus, the use of tactful recruitment methods and appropriate study designs may be crucial to delivering obesity prevention programs that are likely to engage the largest range of children possible.
Future research needs to further evaluate the usefulness of tailoring intervention objectives based on response patterns as classified in this study, both in the short-term and over the long-term. Several shifts in class membership could occur over time not associated with intervention, which would indicate a need for a change in intervention strategy. For example, children in the “active, healthy eating” class in fourth grade might decrease their physical activity once they reach puberty; the decreasing pattern might be particularly pronounced for girls (32). Intervention applications for this group might then be focused on how to maintain the value or positive meaning of physical activity rather than finding continued opportunities for activity (33).
In addition to informing intervention programs, the findings also have implications for clinical practice, particularly for tailoring screening and health recommendation protocols in pediatric and family practice. Results suggest, for example, that a recommendation for a parent or child to be regularly conscious of the child’s weight may be contraindicated (classes 1 and 2). Rather, a practitioner might recommend regular healthy eating in moderation, in combination with exercise (classes 4 and 5). The results also suggest that an emphasis on food restriction and weight monitoring, without adequate attention to physical activity, may be insufficient, to reduce weight gain (class 2).
Limitations and strengths
The sample may be representative of children residing in Southern California. However, the extent of generalizability of the findings is unknown. Moreover, results obtained by LCA tend to be highly data-driven. Therefore, results of the current study will need to be replicated with other independent samples with similar characteristics. The data relied on children’s self-report for food intake and physical activity. Additional objective measures to assess caloric intake and energy expenditure of these children were not part of this field-based study. In addition, the institutional review board protocol for this study did not include approval for assessment of Tanner stages (34) at this early age. Thus, we were unable to determine whether the latent classes are robust when pubertal stage is taken into account. Tanner stages will be assessed at following data collection waves as Pathways cohort become older.
Nonetheless, a population-based sampling strategy was employed in Pathways, targeting 28 schools in two large public school districts. Our sample represents normal age distributions for BMI, eating, physical activity, and diverse ethnic groups. To our knowledge, this is one of the first attempts in obesity research to estimate latent subtypes of eating behaviors and physical activity in children. Evaluating the impact of an intervention program is complicated because the extent to which participants differ in levels of individual risk factors is unknown. Such variations are not manifest but can have significant impact on success of a program. Incorporating these distinct subtypes of pediatric obesity-related factors may improve the design and implementation of the existing obesity intervention programs.
Acknowledgments
This work was supported by the National Institute of Health grant R01HD052107-0182 (PI: M.P.) and T32CA09492 (PI: M.P.).
Footnotes
DISCLOSURE
The authors declared no conflict of interest.
References
- 1.Lobstein T, Jackson-Leach R. Child overweight and obesity in the USA: Prevalence rates according to IOTF definitions. Int J Pediatr Obes. 2007;2:62–64. doi: 10.1080/17477160601103948. [DOI] [PubMed] [Google Scholar]
- 2.Deckelbaum RJ, Williams CL. Childhood obesity: The health issue. Obes Res. 2001;9(Suppl 4):239S–243S. doi: 10.1038/oby.2001.125. [DOI] [PubMed] [Google Scholar]
- 3.Berkowitz RI, Fujioka K, Daniels SR, et al. Effects of sibutramine treatment in obese adolescents: A randomized trial. Ann Intern Med. 2006;145:81–90. doi: 10.7326/0003-4819-145-2-200607180-00005. [DOI] [PubMed] [Google Scholar]
- 4.Sondike SB, Copperman N, Jacobson MS. Effects of a low-carbohydrate diet on weight loss and cardiovascular risk factor in overweight adolescents. J Pediatr. 2003;142:253–258. doi: 10.1067/mpd.2003.4. [DOI] [PubMed] [Google Scholar]
- 5.Epstein LH, Paluch RA, Gordy CC, Dorn J. Decreasing sedentary behaviors in treating pediatric obesity. Arch Pediatr Adolesc Med. 2000;154:220–226. doi: 10.1001/archpedi.154.3.220. [DOI] [PubMed] [Google Scholar]
- 6.Harris KC, Kuramoto LK, Schulzer M, Retallack JE. Effect of school-based physical activity interventions on body mass index in children: A meta-analysis. CMAJ. 2009;180:719–726. doi: 10.1503/cmaj.080966. [DOI] [PMC free article] [PubMed] [Google Scholar]
- 7.Flynn MA, McNeil DA, Maloff B, et al. Reducing obesity and related chronic disease risk in children and youth: A synthesis of evidence with ‘best practice’ recommendations. Obes Rev. 2006;7(Suppl 1):7–66. doi: 10.1111/j.1467-789X.2006.00242.x. [DOI] [PubMed] [Google Scholar]
- 8.Dobbins M, DeCorby K, Robeson P, Husson H, Tirilis D. School-based physical activity programs for promoting physical activity and fitness in children and adolescents aged 6–18. Cochrane Database Syst Rev. 2009;1:CD007651. doi: 10.1002/14651858.CD007651. [DOI] [PubMed] [Google Scholar]
- 9.McGovern L, Johnson JN, Paulo R, et al. Clinical review: Treatment of pediatric obesity: A systematic review and meta-analysis of randomized trials. J Clin Endocrinol Metab. 2008;93:4600–4605. doi: 10.1210/jc.2006-2409. [DOI] [PubMed] [Google Scholar]
- 10.Ebbeling CB, Pawlak DB, Ludwig DS. Childhood obesity: Public-health crisis, common sense cure. Lancet. 2002;360:473–482. doi: 10.1016/S0140-6736(02)09678-2. [DOI] [PubMed] [Google Scholar]
- 11.Hoelscher DM, Day RS, Lee ES, et al. Measuring the prevalence of overweight in Texas schoolchildren. Am J Public Health. 2004;94:1002–1008. doi: 10.2105/ajph.94.6.1002. [DOI] [PMC free article] [PubMed] [Google Scholar]
- 12.Ogden CL, Yanovski SZ, Carroll MD, Flegal KM. The epidemiology of obesity. Gastroenterology. 2007;132:2087–2102. doi: 10.1053/j.gastro.2007.03.052. [DOI] [PubMed] [Google Scholar]
- 13.Hedley AA, Ogden CL, Johnson CL, et al. Prevalence of overweight and obesity among US children, adolescents, and adults, 1999–2002. JAMA. 2004;291:2847–2850. doi: 10.1001/jama.291.23.2847. [DOI] [PubMed] [Google Scholar]
- 14.Riddoch CJ, Leary SD, Ness AR, et al. Prospective associations between objective measures of physical activity and fat mass in 12–14 year old children: The Avon Longitudinal Study of Parents and Children (ALSPAC) BMJ. 2009;339:b4544. doi: 10.1136/bmj.b4544. [DOI] [PMC free article] [PubMed] [Google Scholar]
- 15.Laurson KR, Eisenmann JC, Welk GJ, et al. Combined influence of physical activity and screen time recommendations on childhood overweight. J Pediatr. 2008;153:209–214. doi: 10.1016/j.jpeds.2008.02.042. [DOI] [PubMed] [Google Scholar]
- 16.Patrick K, Norman GJ, Calfas KJ, et al. Diet, physical activity, and sedentary behaviors as risk factors for overweight in adolescence. Arch Pediatr Adolesc Med. 2004;158:385–390. doi: 10.1001/archpedi.158.4.385. [DOI] [PubMed] [Google Scholar]
- 17.Múthen B, Múthen LK. Integrating person-centered and variable-centered analyses: Growth mixture modeling with latent trajectory classes. Alcohol Clin Exp Res. 2000;24:882–891. [PubMed] [Google Scholar]
- 18.Lanza ST, Savage JS, Birch LL. Identification and prediction of latent classes of weight-loss strategies among women. Obesity. 2010;18:833–840. doi: 10.1038/oby.2009.275. [DOI] [PMC free article] [PubMed] [Google Scholar]
- 19.Berge JM, Wall M, Bauer KW, Neumark-Sztainer D. Parenting characteristics in the home environment and adolescent overweight: A latent class analysis. Obesity. 2010;18:818–825. doi: 10.1038/oby.2009.324. [DOI] [PMC free article] [PubMed] [Google Scholar]
- 20.Rodriguez A, Miettunen J, Henriksen TB, et al. Maternal adiposity prior to pregnancy is associated with ADHD symptoms in offspring: Evidence from three prospective pregnancy cohorts. Int J Obes (Lond) 2008;32:550–557. doi: 10.1038/sj.ijo.0803741. [DOI] [PubMed] [Google Scholar]
- 21.Riggs NR, Chou C-P, Spruijt-Metz D, Pentz MA. Executive cognitive function, food intake, and physical activity in 4th grade students attending school-based after-school programs. Child Neuropsychol. 2010 In Press. [Google Scholar]
- 22.Riggs NR, Spruijt-Metz D, Sakuma KL, Chou CP, Pentz MA. Executive Cognitive Function and Food Intake in Children. J Nutr Educ Behav. 2010 doi: 10.1016/j.jneb.2009.11.003. In Press. [DOI] [PMC free article] [PubMed] [Google Scholar]
- 23.Center for Disease Control and Prevention. How much physical activity do children need? http://www.cdc.gov/physicalactivity/everyone/guidelines/children.html. Published 5 November, 2008. Accessed 12 January, 2010.
- 24.Francis LA, Lee Y, Birch LL. Parental weight status and girls’ television viewing, snacking, and body mass indexes. Obes Res. 2003;11:143–151. doi: 10.1038/oby.2003.23. [DOI] [PMC free article] [PubMed] [Google Scholar]
- 25.Center for Disease Control and Prevention. How many fruits & vegetables do you need? http://www.fruitsandveggiesmatter.gov/form.html. Accessed 12 January, 2010.
- 26.Serdula MK, Coates RJ, Byers T, et al. Fruit and vegetable intake among adults in 16 states: Results of a brief telephone survey. Am J Public Health. 1995;85:236–239. doi: 10.2105/ajph.85.2.236. [DOI] [PMC free article] [PubMed] [Google Scholar]
- 27.Serdula M, Coates R, Byers T, et al. Evaluation of a brief telephone questionnaire to estimate fruit and vegetable consumption in diverse study populations. Epidemiology. 1993;4:455–463. doi: 10.1097/00001648-199309000-00012. [DOI] [PubMed] [Google Scholar]
- 28.Center for Disease Control and Prevention. 2007 Youth Risk Behavior Survey: 2007 National YRBS Data Users Manual. DHHS; 2007. [Google Scholar]
- 29.Múthen B, Múthen LK. Mplus User’s Guide. Fifth. Múthen & Múthen; Los Angeles, CA: 1998–2008. [Google Scholar]
- 30.Lo Y, Mendell NR, Rubin DB. Testing the number of components in a normal mixture. Biometrika. 2001;88:767–778. [Google Scholar]
- 31.Pentz MA. Directions for future research in drug abuse prevention. Prev Med. 1994;23:646–652. doi: 10.1006/pmed.1994.1107. [DOI] [PubMed] [Google Scholar]
- 32.Pate PR, Long BJ, Heath G. Descriptive epidemiology of physical activity in adolescents. Pediatric Exer Sci. 1994;6:434–447. [Google Scholar]
- 33.Spruijt-Metz D, Nguyen-Michel ST, Goran MI, Chou CP, Huang TT. Reducing sedentary behavior in minority girls via a theory-based, tailored classroom media intervention. Int J Pediatr Obes. 2008;3:240–248. doi: 10.1080/17477160802113415. [DOI] [PMC free article] [PubMed] [Google Scholar]
- 34.Tanner JM. Growth at Adolescence. Blackwell Scientific Publishers; Oxford, UK: [Google Scholar]