

Abstract
Realistic in vitro models are critical in the drug development process. In this study, a novel in vitro platform is employed to assess drug penetration and metabolism. This platform, which utilizes a 3D printed fluidic device, allows for dynamic dosing of three dimensional cell cultures, also known as spheroids. The penetration of the chemotherapeutic irinotecan into HCT 116 colon cancer spheroids was examined with matrix-assisted laser desorption/ionization (MALDI) imaging mass spectrometry (IMS). The active metabolite of irinotecan, SN-38, was also detected. After twenty-four hours of treatment, SN-38 was concentrated to the outside of the spheroid, a region of actively dividing cells. The irinotecan prodrug localization contrasted with SN-38 and was concentrated to the necrotic core of the spheroids, a region containing mostly dead and dying cells. These results demonstrate that this unique in vitro platform is an effective means to assess drug penetration and metabolism in three dimensional cell cultures. This innovative system can have a transformative impact on the preclinical evaluation of drug candidates due to its cost effectiveness and high throughput.
1 Introduction
Cell-based in vitro platforms are vital for drug development.1 Three-dimensional cell culture (3D cell culture) has been established as a valuable in vitro model system.2–4 This system maintains some of the complexity of animal tissues including cell morphology, signaling and gene expression patterns.2,5,6 3D cell cultures are also grown on a shorter time scale than animal models, which allows for more flexibility and higher throughput. However, 3D cell cultures cannot mimic all aspects of in vivo models such as vasculature or widespread cell-cell interactions.2
Among 3D cell cultures, multicellular tumor spheroids (MCTS) are one of the most common models used for the study of drug penetration.7 Specifically, colon cancer spheroids have been employed for the investigation of the pharmacokinetics and pharmacodynamics of chemotherapeutics.8 These spheroids (Figure 1), when grown to 1 mm in diameter, display heterogeneous microregions similar to in vivo tumors.7,9,10 These microregions are caused by radially symmetric chemical gradients, including changes in nutrient, pH and oxygen concentration from the exterior to the center of the spheroids.7,9–11 The differing chemical microenvironments result in changes in the health of the cells in the spheroids. Cells in the outer layers have ready access to oxygen and nutrients and are proliferative, while cells in the inside layers have decreased access to nutrients and oxygen. These inner layers of cells become quiescent, while those in the center of the spheroid develop into a core of necrotic cells. 7,9–13
Figure 1. Multicellular Tumor Spheroid.

Microscope image (100x) of HCT 116 spheroid. Spheroids have three regions that are caused by gradients of oxygen, pH and nutrients. The regions include an inner necrotic core, a middle quiescent zone, and an outer proliferative zone.
Drug penetration into colon cancer spheroids has previously been shown by static dosing.13 In static dosing, the amount of drug delivered is constant over time. Static dosing models are useful for investigating various pharmacological properties, such as determining the minimum effective concentration of a pharmaceutical.10,13 However, static dosing models lack a flow component that is seen in vivo. This can lead to the limitation of cell growth due to a deficiency of nutrient and gas exchange and the build up of toxic metabolites.14–16 These factors can complicate the ability to distinguish between the effects of the drug and the effects of the static environment.
With in vivo drug administration, dosing occurs dynamically.17–20 With dynamic dosing, drug concentration changes as a function of time. This dynamic dosing is achieved in vivo by the body’s absorption, distribution, metabolism and elimination (ADME) mechanisms. In this study, a 3D printed fluidic device was used to dose spheroids dynamically with the chemotherapeutic irinotecan.
Approaches to map the spatial distribution of drugs in tissues have previously relied on microscopy or autoradiography.21,22 These approaches have shortcomings as analysis requires radioisotopes or other imaging probes. Matrix-Assisted Laser Desorption/Ionization Imaging Mass Spectrometry (MALDI-IMS) is a label-free alternative that allows for the identification and localization of proteins and other small molecules.23,24
In MALDI-IMS, thin tissue sections are sliced from frozen blocks of gelatin and mounted on conductive glass slides. A photoactive MALDI matrix is then applied to the slices and a laser is rastered across the sample in a grid pattern. With analyte ionization, the resulting mass spectra can be compiled to generate a spatially accurate map of analytes. A MALDI-IMS workflow for this project is shown in Figure 2.
Figure 2. Experimental Workflow.

Spheroids are first dynamically dosed in a 3D printed fluidic device. Next the spheroids are harvested and matrix is applied. Finally MALDI-IMS analysis is performed to generate a spatially accurate map of analytes.
MALDI-IMS has previously been used to map both proteins10,25 and chemotherapeutics13 in adenocarcinoma HCT 116 spheroids. Previous studies in our group have focused on mapping the distribution of the chemotherapeutic irinotecan and its metabolites.13 Irinotecan is a drug commonly given clinically to patients with colon cancer.26 In vivo, irinotecan is converted to its active metabolite, 7-ethyl-10-hydroxycamptothecin (SN-38), by carboxylesterases.27,28 SN-38 induces cell death by binding to topoisomerase I, which interferes with DNA syntheses and repair processes.29 Other metabolites from irinotecan have also been observed from oxidation or decarboxylation reactions.27,28,30,31
This project utilizes a 3D printed fluidic device previously shown to allow drug transport across a membrane.32,33 This device (Figure 3) consists of 6 channels with inlets allowing for sample introduction and outlets for waste. On top of each channel is a circular well that accommodates cell culture inserts with permeable membranes. This membrane rests on top of the flow channel and allows for the diffusion of small molecules from the channel into the cell culture insert. Each of the 6 inserts on the device can house up to 5 spheroids, allowing for the treatment of up to 30 spheroids during one dosing experiment.
Figure 3. 3D Printed Fluidic Device.

(Top) Device with circular openings with a membrane insert in the far left well. (Bottom) Side view of device showing inlets printed with threads to accommodate commercial fittings.
This study improves on our previous work by incorporating a dynamic flow component with a 3D printed fluidic device. This platform allows for nutrient exchange and the diffusion of toxic metabolites out of the spheroid environment. With the use of MALDI-IMS, prodrug penetration is determined along with the presence of the drug’s active metabolite. This dynamic dosing model gives a more realistic representation of the absorption, distribution metabolism and elimination of an in vivo system.
2 Materials and methods
2.1 Growth of Multicellular Spheroids
2.1.1 Cell Culture
The human colon carcinoma cell line HCT 116 was purchased from the American Type Culture Collection (ATCC, Manassas, VA, USA). The provider guaranteed authentication of the cell line by cytogenetic analysis. Cells were used within 3 months after resuscitation of frozen aliquots thawed from liquid nitrogen. Cells were cultured as a monolayer at 37 °C with 5% carbon dioxide in McCoy’s 5A cell culture medium (Life Technologies, Grand Island, NY, USA) supplemented with 10% fetal bovine serum (Thermo Scientific, Gaithersburg, MD, USA) and 2.5 mM L-glutamine (Invitrogen, San Diego, CA, USA).
2.1.2 Three-Dimensional Cell Culture
HCT 116 Multicellular Tumor Spheroids (MCTS) were formed following established protocols.10 Briefly, 6000 cells were seeded into the inner 60 wells of a 96 well plate coated with an agarose-medium solution. Half medium changes were performed every 48 hours following 3 days in culture. The spheroids were harvested for treatment at days 12–14, when the diameter of the spheroids reached ~1 mm.
2.2 Preparation of Irinotecan Drug Solution
Irinotecan hydrochloride was purchased from Sigma (St. Louis, MO, USA). A 200 μM solution of irinotecan was prepared by dissolving the drug in nanoPure water. The 200 μM solution was further diluted in McCoy’s 5A medium to a final concentration of 50 μM for initial irinotecan penetration studies and to a final concentration of 75 μM for irinotecan metabolism studies.
2.3 Preparation of Camptothecin Internal Standard Solution
Camptothecin was purchased from MP Biomedicals (Solon, OH, USA). A 0.5 mg/mL stock solution was prepared by dissolving camptothecin in dimethyl sulfoxide (DMSO, Sigma, St. Louis, MO, USA). A 550 nM working solution was prepared by diluting the stock solution in HPLC-grade acetonitrile.
2.4 In Vitro Dosing Platform
2.4.1 3D Printed Device Fabrication
The 3D fabrication process, as explained in previous literature32,33, is detailed here in short. The 3D printed devices were first designed in-house using the computer aided design (CAD) software, AutoDesk Inventor Professional Student Edition (AutoDesk, San Rafael, CA, USA). The .STL files were then submitted to the Department of Electrical and Computer Engineering at Michigan State University, which houses the Objet Connex 350 printer used to print the device used in this study. The base of the device is comprised of a rigid clear material, FullCure 810 VeroClear (Objet Geometries Ltd., Rehovot, Israel) and the O-ring, lining the inside of the well, is a black elastic material, Fullcure 980 TangoBlackPlus (Objet Geometries Ltd., Rehovot, Israel), which were printed simultaneously. While the compositions are proprietary, the FullCure 810 VeroClear material is comprised of isobornyl acrylate (15–30%), acrylic monomer (15–30%), urethane acrylate (10–30%), acrylic monomer (10–15%), epoxy acrylate (10–15%), acrylate oligomer (10–15%), and a photoinitiator (0.1–1–2%) and Fullcure 980 TangoBlackPlus contains urethane acrylate oligomer (30–60%), exo-1,7,7-trimethylbicyclo[2.2.1]hept-2-yl acrylate (1–20%), methacrylate oligomer (1–20%), resin-polyurethane (1–20%) and a photoinitiator (0.1–1%). After printing, the channels were cleared of the waxy support material and the surface of the device was sanded or polished prior to application of a clear lacquer (RUST-OLEUM, Vernon Hills, IL, USA) to improve optical clarity.
Designed after a 24-well plate, the device contains six, 2 mm × 2 mm channels, each containing an open well, lined with the back O-ring, in which a commercially available microwell can be inserted. The finished device was designed to be amenable to existing commercially available fittings (F-120, IDEX Health and Science, Oak Harbor, WA, USA) by printing the appropriate threads into the inlets and outlets.
2.4.2 Introduction of Drug Solution into Device
Hamilton Gastight syringes (5 mL; Hamilton Company, Reno, NV, USA) were filled with irinotecan drug solution. The syringes were connected to fused silica capillary tubing (i.d. 536 μm; o.d. 669.7 μm; Polymicro Technologies, Phoenix AZ, USA) via syringe fittings (IDEX Health and Science, Oak Harbor, WA, USA). The other end of the capillary tubing was connected to the 3D printed device with a tube sleeve (i.d. 686μm; o.d. 1.58 μm; IDEX Health and Science, Oak Harbor, WA, USA) inside of a 10–32 FingerTight fitting (IDEX Health and Science, Oak Harbor, WA, USA). The fittings were then integrated into 10–32 threads in the 3D printed device. The Gastight syringes filled with irinotecan were then pumped through the device at a rate of 15 μL/min via a multi-syringe infusion pump (KD Scientific, Holliston, MA, USA).
2.4.3 Preparation of Spheroids for Dosing
Spheroids were transferred via a wide mouth pipette (MOLECULAR BIO-PRODUCTS INC, San Diego, CA, USA) into 100 μL of McCoy’s 5A medium in cell culture membrane inserts that contain a permeable polycarbonate membrane (0.4 μm pore diameter; Corning Incorporated, Corning, NY, USA). These inserts fit into the circular opening on the 3D printed device. The porous membrane separates the spheroids from the flow channel and allows for the diffusion of small molecules. The top of the inserts was covered to prevent evaporation. All dosing experiments were performed at room temperature.
2.5 Spheroid Preparation for MALDI-IMS Analysis
2.5.1 Gelatin Embedding and Sectioning of Spheroids
Following treatment, medium was aspirated and spheroids were washed with phosphate buffered saline (Life Technologies, Grand Island, NY, USA). The spheroids were then transferred via wide mouth pipette to a gelatin-coated 24 well plate. The spheroids were then covered with a thin layer of warm gelatin. The gelatin embedded spheroids were then frozen at −80 °C. The frozen pellets were then sectioned into 12 μm thick slices in a cryostat at −30 °C. The slices were then thaw-mounted onto indium tin oxide (ITO) coated slides (Delta Technologies, Loveland, CO, USA). Slides were then stored in a desiccator prior to matrix application
2.5.2 Matrix Application
The MALDI matrix α-cyano-4-hydroxycinnamic acid (CHCA) (Sigma-Aldrich, St. Louis, MO, USA) was dissolved in 50:50 HPLC-grade acetonitrile (ACN)/water with 0.1% trifluoracetic acid (TFA) (EMD, Billerica, MA, USA). The final concentration of the CHCA solution was 10 mg/ml. An airbrush was used to apply the matrix to the tissue sections and the slides were then left in a desiccator until MALD-IMS analysis.
2.6 MALDI-IMS Analysis
MALDI-IMS spectra were acquired on an ultrafleXtreme MALDI-TOF-TOF mass spectrometer (Bruker Daltonics, Bremen, Germany). External calibration was performed using a custom peptide and protein mixture. The instrument was run in reflectron positive mode. The laser attenuate was set at 68% with a sampling frequency of 500 Hz. The laser rater was set to 35 μm along the x-axis and y-axis. Mass spectra were acquired in the mass range of 300–1000 m/z. Each mass spectrum was the result of 500 consecutive laser shots at each spot. The images were processed with flexImaging 4.1 software (Bruker Daltonics, Bremen, Germany) to generate an ion map of the spheroid and semiquantitative color scale bar.
2.7 Quantification of Irinotecan
2.7.1 Sample Collection
Inserts were placed into the 3D printed device and filled with 100 μL of McCoy’s 5A medium. Dosing was performed as previously described (2.4.2). Samples (5μL) were taken from the inserts at 0, 3, 6, 9, 12, 21, 24, and 30 hours. The samples were diluted with HPLC-grade acetonitrile (100 μL, Sigma-Aldrich, St. Louis, USA) and centrifuged (500 g for 10 min). The supernatant was then diluted in a 1:1 ratio with nanoPure water.
2.7.2 LC-MRM Analysis
Samples (11 μL) were injected into a Shimadzu ultra performance liquid chromatography (UPLC) instrument, whereupon a reverse phase chromatography column (Supelco Ascentis Express C18 column, length: 3 cm; i.d.: 2.1 mm; particles: 2.7 μL; Supelco, Bellefonte, PA, USA) was utilized to separate irinotecan (1.10 min) and camptothecin (1.22 min). The solvent gradient (A: 1% formic acid in water, B: acetonitrile, C: methanol) was 95% A, 0% B for 0.25 min, followed by 2% A, 0% B at 1.00 min. After holding 2% A, 0% B till 1.25 min, the gradient was ramped to 30% A, 15% B at 1.75 min, held for 1.90 min, prior to finishing at 95% A, 0% B at 2.00 min. The sample was then analyzed using multiple reaction monitoring (MRM)-MS (Waters Quattro Micro triple quadrupole mass spectrometer), with the monitored MRM transitions being 587.24 > 349.23 m/z for irinotecan and 349.23 > 305.18 m/z for camptothecin. The cone voltage and collisional energy were 46 V and 34 eV for irinotecan and 40 V and 22 eV for camptothecin, respectively. The collisional gas was 1.96 × 10⁻³ Torr.
3 Results and Discussion
3.1 LC-MRM-MS Analysis of Irinotecan Diffusion
The concentration of irinotecan above the insert membrane was validated using MRM-MS. The PK profile was obtained by flowing a 50 μM solution of irinotecan through the channels of the device with the integrated inserts containing media. Upon sampling from the insert at allotted times, e.g., 0, 3, 6, 9, 12, 21, 24, 30 hours, the PK profile was obtained (Figure 4), yielding an increasing concentration of irinotecan in the insert until the concentration reached equilibrium with the channel (~50 μM) at approximately 9 hours. The concentration saturation was maintained throughout the remainder of the PK profile. In future studies, we plan to generate PK curves that more accurately mimic in vivo profiles. For example, oral dosing applications can be obtained by replacing the drug flowing through the device channels after the target concentration in the insert is reached with buffer, thereby reversing the concentration gradient. The half life of the elimination can further be manipulated to more accurately mimic in vivo elimination by manipulating the aforementioned concentration gradient.33
Figure 4. Pharmacokinetic Profile for Irinotecan.
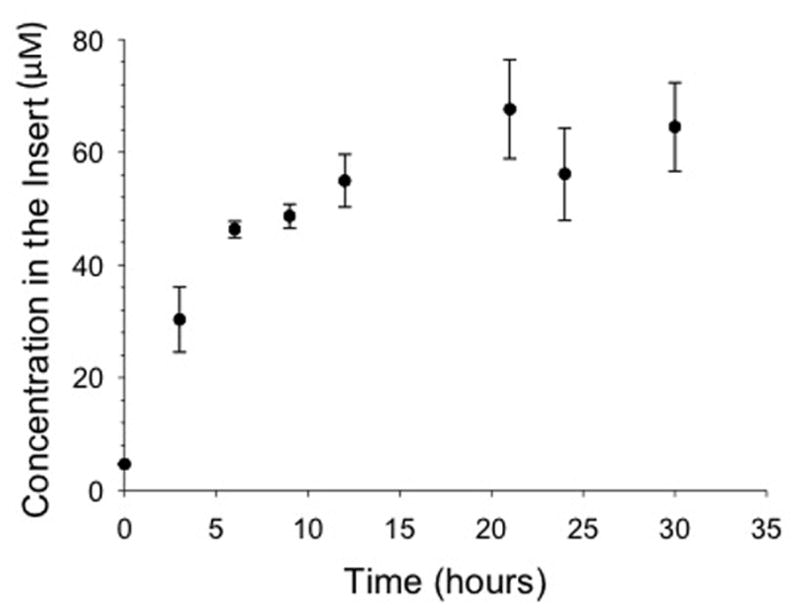
Irinotecan was quantified in the inserts throughout the duration of the experiment using MRM MS. For the profile, 50 μM of irinotecan was flowed at 15 μL/min through the device channel. The concentrated solution diffused across the membrane into the insert. The solution in the insert increased in irinotecan concentration until the concentration gradient equilibrated between the channel and the insert at approximately 9 hours. (n = 4; error: standard deviation)
3.2 MALDI-Imaging Mass Spectrometry of Irinotecan Treated Spheroids
Colon adenocarcinoma HCT 116 multicellular spheroids (MCTSs) were used in this study. These 3D structures were chosen for their ability to closely mimic in vivo tumors. The spheroids were dynamically treated for 24 hours. After treatment, the spheroids were prepared for MALDI imaging. The prodrug, irinotecan, along with its active metabolite, SN-38, were imaged (Figure 5). Following 24 hours of treatment, the prodrug is concentrated in the center of the tumor spheroid. These results align with the previous static dosing experiments performed in our lab with irinotecan.13 As shown in the inlay control spectra, no peaks in the irinotecan mass range were detected in control spheroids. The most intense peak present in the control sample of m/z 569 can be attributed to the CHCA matrix.
Figure 5. MALDI-IMS Analysis of Dynamically Dosed HCT 116 Spheroids.

(A) Imaging of irinotecan prodrug (m/z 587). Mass Spectrum of treated spheroids with inlay representing untreated spheroids. Image was normalized to total ion current. From the intensity map it can be seen that irinotecan localizes to the center of the spheroid after 24 hours of dosing. (B) Metabolic reaction of irinotecan into its active metabolite, SN-38. (C) Imaging of irinotecan (left) and SN-38 (center). Merged image (right) shows that the active metabolite (SN-38) is localized to the periphery of the spheroid while the prodrug (Irinotecan) localizes to the core.
3.3 MALDI-Imaging Mass Spectrometry of Active Metabolite (SN-38) in Spheroids
The distribution of the active metabolite SN-38 contrasts with the localization of the prodrug. The active metabolite is predominantly concentrated to the outer region of the spheroid. Since the outer rim of the spheroid contains mostly active cells, this distribution results in the majority of the prodrug being metabolized to the active metabolite in the outer region.
4 Concluding remarks
In this study, we have illustrated a novel system for in vitro drug dosing. This system, which allows for dynamic dosing, is more clinically relevant than traditional static models. In this study, clinical relevance is enhanced by the use of a 3D printed device that allows for a flow component. The flow component, separated from the tumor spheroids with a permeable membrane, gives a dynamic system. Drugs can diffuse from the channel into the insert. Also waste that accumulates in the insert can diffuse into the channel and out of contact with the sample. This diffusion-based drug dosing system more closely mimics drugs disseminating from the blood supply to an in vivo tumor.
MALDI imaging mass spectrometry verified that the chemotherapeutic irinotecan penetrates into tumor spheroids treated in this device. The penetration of the irinotecan prodrug into the tumor spheroid is necessary for the metabolism of the drug into its active metabolite, SN-38. The localization of SN-38 was mapped using MALDI-IMS. SN-38 concentrated to the periphery of the spheroid. This localization correlates with the region of the spheroid containing active cells, indicating that the cells in the outer region of the spheroid are capable of metabolizing irinotecan into its active metabolite. In contrast, the accumulation of the irinotecan prodrug into the center of the spheroid correlates with the location of mostly dead and dying cellular populations.
This platform has the ability to closely mimic in vivo dosing and can help to increase the speed of bringing novel therapeutics to market. As shown in this study, the three-dimensional cell culture system mimics many aspects of an in vivo tumor including the metabolism of chemotherapeutics. In the future, we plan to examine other clinically relevant or novel chemotherapeutics.
Significance of Study.
When new drugs are developed, their pharmacological activity must be evaluated. Prior to analyzing the absorption, distribution, metabolism and elimination of compounds in an organism, in vitro approaches are often used as a first line approach for analysis. Three-dimensional multicellular spheroids are a proven model system for in vitro pharmaceutical research. With our approach, we mimic in vivo dosing with the use of a 3D printed fluidic device. This device allows for dynamic dosing, generating pharmacokinetic curves that more closely mimic what is seen in vivo. Matrix assisted laser desorption/ionization imaging mass spectrometry (MALDI-IMS) has previously been shown to be a valuable tool to examine the localization of proteins and small molecules in three-dimensional cell cultures. In this study, MALDI-IMS is used to map the localization of a chemotherapeutic prodrug as well as the localization of this chemotherapeutic’s active metabolite. With this novel in vitro platform, drug candidates can be identified quicker in the drug development process by mapping the localization of the drug and its metabolites in three-dimensional cell cultures. The described platform also does not involve ethical issues associated with human or animal testing, is cost effective, and high throughput.
Acknowledgments
We thank Jonathan Sweedler, Troy Comi and Elena Romanova for MALDI access. This work was funded by the National Institutes of Health (R01GM110406) and the Harper Cancer Institute “Research Like a Champion” Award for GJL. The Walther Cancer Foundation provided salary support for ABH. The authors would like to thank Brian Wright and the Department of Electrical and Computer Engineering at Michigan State University for their assistance in printing the devices. The authors would also acknowledge the Michigan State University RTSF Mass Spectrometry Core.
References
- 1.Ginai M, et al. The use of bioreactors as in vitro models in pharmaceutical research. Drug Discov Today. 2013;18:922–35. doi: 10.1016/j.drudis.2013.05.016. [DOI] [PubMed] [Google Scholar]
- 2.Yamada KM, Cukierman E. Modeling Tissue Morphogenesis and Cancer in 3D. Cell. 2007;130:601–610. doi: 10.1016/j.cell.2007.08.006. [DOI] [PubMed] [Google Scholar]
- 3.Debnath J, Brugge JS. Modelling glandular epithelial cancers in three-dimensional cultures. Nat Rev Cancer. 2005;5:675–688. doi: 10.1038/nrc1695. [DOI] [PubMed] [Google Scholar]
- 4.Maltman DJ, Przyborski Sa. Developments in three-dimensional cell culture technology aimed at improving the accuracy of in vitro analyses. Biochem Soc Trans. 2010;38:1072–1075. doi: 10.1042/BST0381072. [DOI] [PubMed] [Google Scholar]
- 5.Chitcholtan K, Asselin E, Parent S, Sykes PH, Evans JJ. Differences in growth properties of endometrial cancer in three dimensional (3D) culture and 2D cell monolayer. Exp Cell Res. 2013;319:75–87. doi: 10.1016/j.yexcr.2012.09.012. [DOI] [PubMed] [Google Scholar]
- 6.Töyli M, Rosberg-Kulha L, Capra J, Vuoristo J, Eskelinen S. Different responses in transformation of MDCK cells in 2D and 3D culture by v-Src as revealed by microarray techniques, RT-PCR and functional assays. Lab Invest. 2010;90:915–928. doi: 10.1038/labinvest.2010.63. [DOI] [PubMed] [Google Scholar]
- 7.Vinci M, et al. Advances in establishment and analysis of three-dimensional tumor spheroid-based functional assays for target validation and drug evaluation. BMC Biol. 2012;10:29. doi: 10.1186/1741-7007-10-29. [DOI] [PMC free article] [PubMed] [Google Scholar]
- 8.Al-Abd AM, Lee JH, Kim SY, Kun N, Kuh HJ. Novel application of multicellular layers culture for in situ evaluation of cytotoxicity and penetration of paclitaxel. Cancer Sci. 2008;99:423–431. doi: 10.1111/j.1349-7006.2007.00700.x. [DOI] [PMC free article] [PubMed] [Google Scholar]
- 9.Sutherland RM. Microregions: The Spheroid Model. Science (80-) 1988;240:177–240. doi: 10.1126/science.2451290. [DOI] [PubMed] [Google Scholar]
- 10.Li H, Hummon AB. Imaging mass spectrometry of three-dimensional cell culture systems. Anal Chem. 2011;83:8794–8801. doi: 10.1021/ac202356g. [DOI] [PubMed] [Google Scholar]
- 11.Anada T, Fukuda J, Sai Y, Suzuki O. An oxygen-permeable spheroid culture system for the prevention of central hypoxia and necrosis of spheroids. Biomaterials. 2012;33:8430–8441. doi: 10.1016/j.biomaterials.2012.08.040. [DOI] [PubMed] [Google Scholar]
- 12.Keithley RB, et al. Single cell metabolic profiling of tumor mimics. Anal Chem. 2013;85:8910–8918. doi: 10.1021/ac402262e. [DOI] [PMC free article] [PubMed] [Google Scholar]
- 13.Liu X, Weaver EM, Hummon AB. Evaluation of therapeutics in three-dimensional cell culture systems by MALDI imaging mass spectrometry. Anal Chem. 2013;85:6295–6302. doi: 10.1021/ac400519c. [DOI] [PMC free article] [PubMed] [Google Scholar]
- 14.White RL. What in vitro models of infection can and cannot do. Pharmacotherapy. 2001;21:292S–301S. doi: 10.1592/phco.21.18.292s.33906. [DOI] [PubMed] [Google Scholar]
- 15.Gloede J, Scheerans C, Derendorf H, Kloft C. In vitro pharmacodynamic models to determine the effect of antibacterial drugs. J Antimicrob Chemother. 2009;65:186–201. doi: 10.1093/jac/dkp434. [DOI] [PubMed] [Google Scholar]
- 16.Müller M, Dela Peña A, Derendorf H. Issues in Pharmacokinetics and Pharmacodynamics of Anti-Infective Agents: Distribution in Tissue. Antimicrob Agents Chemother. 2004;48:1441–1453. doi: 10.1128/AAC.48.5.1441-1453.2004. [DOI] [PMC free article] [PubMed] [Google Scholar]
- 17.Shargel L, Wu-Pong S, Yu ABC. Applied Biopharmaceutics and Pharmacokinetics. McGraw-Hill; 2012. [Google Scholar]
- 18.Hedaya MA. Basic Pharmacokinetics. Taylor & Francis/CRC Press; 2012. [Google Scholar]
- 19.Curry SH, Whelpton R. Drug Disposition and Pharmacokinetics: from Principles to Applications. Wiley-Blackwell; 2011. [Google Scholar]
- 20.Bauer LA. Applied Clinical Pharmacokinetics. McGraw-Hill; 2014. [Google Scholar]
- 21.Godugu C, et al. AlgiMatrix™ Based 3D Cell Culture System as an In-Vitro Tumor Model for Anticancer Studies. PLoS One. 2013;8:e53708. doi: 10.1371/journal.pone.0053708. [DOI] [PMC free article] [PubMed] [Google Scholar]
- 22.Ma HL, et al. Multicellular tumor spheroids as an in vivo-like tumor model for three-dimensional imaging of chemotherapeutic and nano material cellular penetration. Mol Imaging. 2012;11:487–498. [PubMed] [Google Scholar]
- 23.MacAleese L, Stauber J, Heeren RMa. Perspectives for imaging mass spectrometry in the proteomics landscape. Proteomics. 2009;9:819–834. doi: 10.1002/pmic.200800363. [DOI] [PubMed] [Google Scholar]
- 24.Seeley EH, Caprioli RM. Molecular imaging of proteins in tissues by mass spectrometry. Proc Natl Acad Sci U S A. 2008;105:18126–18131. doi: 10.1073/pnas.0801374105. [DOI] [PMC free article] [PubMed] [Google Scholar]
- 25.Weaver EM, Hummon AB, Keithley RB. Analytical Methods Chemometric analysis of MALDI mass culture systems †. Anal Methods. 2015;7:7208–7219. doi: 10.1039/C5AY00293A. [DOI] [PMC free article] [PubMed] [Google Scholar]
- 26.Cartwright TH. Treatment decisions after diagnosis of metastatic colorectal cancer. Clin Colorectal Cancer. 2012;11:155–166. doi: 10.1016/j.clcc.2011.11.001. [DOI] [PubMed] [Google Scholar]
- 27.Sai K, Kaniwa N, Ozawa S, Sawada JI. A new metabolite of irinotecan in which formation is mediated by human hepatic cytochrome P-450 3A4. Drug Metab Dispos. 2001;29:1505–13. [PubMed] [Google Scholar]
- 28.Slatter JG, et al. Pharmacokinetics, Metabolism, and Excretion of Irinotecan (Cpt-11) Following I. V. Infusion of [14 C] Cpt-11 in Cancer Patients Abstract. 2000;28 [PubMed] [Google Scholar]
- 29.Kumar N, Sangeetha D, Reddy SP. UPLC and LC-MS Studies on Degradation Behavior of Irinotecan Hydrochloride and Development of a Validated Stability-Indicating Ultra-Performance Liquid Chromatographic Method for Determination of Irinotecan Hydrochloride and its Impurities in Pharmaceutic. J Chromatogr Sci. 2012;50:1–10. doi: 10.1093/chromsci/bms075. [DOI] [PubMed] [Google Scholar]
- 30.Lokiec F, du Sorbier BM, Sanderink GJ. Irinotecan (CPT-11) metabolites in human bile and urine. Clin Cancer Res. 1996;2:1943–9. [PubMed] [Google Scholar]
- 31.Baylatry MT, et al. Simple liquid chromatography method for the quantification of irinotecan and SN38 in sheep plasma: application to in vivo pharmacokinetics after pulmonary artery chemoembolization using drug eluting beads. J Chromatogr B Analyt Technol Biomed Life Sci. 2010;878:738–42. doi: 10.1016/j.jchromb.2010.01.017. [DOI] [PubMed] [Google Scholar]
- 32.Anderson KB, Lockwood SY, Martin RS, Spence DM. A 3D printed fluidic device that enables integrated features. Anal Chem. 2013;85:5622–5626. doi: 10.1021/ac4009594. [DOI] [PubMed] [Google Scholar]
- 33.Lockwood SY, Meisel JE, Monsma FJ, Spence DM. A Di ff usion-Based and Dynamic 3D-Printed Device That Enables Parallel in Vitro Pharmacokinetic Profiling of Molecules. 2016 doi: 10.1021/acs.analchem.5b04270. [DOI] [PMC free article] [PubMed] [Google Scholar]