Abstract
Importance
Persons with human immunodeficiency virus (HIV) treated with antiretroviral therapy (ART) have improved longevity but are at elevated risk for myocardial infarction (MI) due to common MI risk factors and HIV-specific factors. Despite these elevated MI rates, optimal methods to predict MI risks for HIV-infected persons remain unclear.
Objective
To determine the extent to which existing and de novo estimation tools predict MI in a multi-center HIV cohort with rigorous MI adjudication.
Design
We evaluated the performance of standard-of-care and two new data-derived MI risk estimation models in the Centers for AIDS Research Network of Integrated Clinical Systems (CNICS) multi-center prospective clinical cohort. The new risk estimation models were validated in a cohort separate from the derivation cohort.
Setting
Clinical sites across the U.S. where HIV-infected adults receive medical care in inpatient and outpatient settings.
Participants
HIV-infected adults receiving care anytime since 1995 at 5 CNICS sites where MIs were adjudicated (N=19829).
Exposures
Common cardiovascular risk factors, HIV viral load, CD4 count, and medication use were used to calculate predicted event rates.
Main Outcome and Measures
Observed MI rates over the course of follow-up, scaled to 10 years using an observed prime approach to account for dropout and loss to follow-up prior to 10 years.
Results
MI rates were higher among blacks, older participants, and participants who were not virally suppressed. The 2013 Pooled Cohort Equations (PCEs), which predict composite rates of MI and stroke, adequately discriminated MI risk (Harrell’s C Statistic = 0.75). Two data-derived models incorporating HIV-specific covariates exhibited weak calibration in a validation sample and did not discriminate risk any better (Harrell’s C Statistic = 0.72 and 0.73) than the PCEs. The PCEs were moderately calibrated in CNICS but predicted consistently lower than observed prime rates of MI. The PCEs
Conclusions and relevance
The PCEs discriminated MI risk and were moderately calibrated in this multi-center HIV cohort. Adding HIV-specific factors did not improve model performance. As HIV-infected cohorts capture and assess outcomes of MI and stroke, the performance of risk estimation tools should be revisited.
INTRODUCTION
Longevity among persons with human immunodeficiency virus (HIV) has increased dramatically due to effective antiretroviral therapy (ART).1–4 There are over 1.2 million and 35 million adults living with HIV in the U.S. and worldwide, respectively. These numbers are projected to continue to grow and the aging HIV-infected (HIV+) population is increasingly at risk for non-communicable disease-related morbidity and mortality.5–7 HIV+ persons have nearly twice the risk for myocardial infarction (MI) and greater risks for heart failure and sudden death compared with uninfected persons.8–19
The current paradigm for preventing atherosclerotic cardiovascular disease (ASCVD), which consists of nonfatal MI, coronary heart disease (CHD) death, and stroke, is based on the principle that intensity of prevention efforts should match patients’ absolute risks. This requires accurate prediction of ASCVD risks. Although some studies have evaluated ASCVD risk estimation models in HIV+ patients, these studies have generally been small and assessed endpoints suboptimally.20–22 One exception is the large, predominantly white cohort used to derive the D:A:D risk score; this score incorporates specific antiretroviral agents but does not incorporate race.23
The American College of Cardiology (ACC) and American Heart Association (AHA) 2013 Guideline on the Assessment of Cardiovascular Risk developed the Pooled Cohort Equations (PCEs) for 10-year ASCVD risk prediction to assist with decision-making for ASCVD prevention.24,25 These equations were derived from more diverse population-based cohorts than prior ASCVD risk prediction tools.26 The PCEs have not been evaluated in a large, multi-center HIV cohort. Thus, the objectives of this study were to: (1) evaluate the performance of the PCEs; (2) create data-derived, HIV-specific MI risk estimation models in a diverse, multi-center HIV cohort with rigorous MI adjudication; and (3) externally validate these models in a separate sample.
METHODS
Study Population
We used the Centers for AIDS Research (CFAR) Network of Integrated Clinical Systems (CNICS) cohort for all analyses.27 CNICS is a multi-center clinical cohort comprised of HIV+ adults 18 years of age or older receiving HIV care at one of eight CFAR clinics in the U.S.; initial enrollment was 1995 or later depending on the site, enrollment and follow-up are continuous (most recent adjudicated MIs: July 2015), and rigorous central adjudication for MI within CNICS has been described in detail.27
Statistical Analyses: 2013 ACC/AHA Pooled Cohort Equations Performance in CNICS
For analyses evaluating PCE model performance, we included all CNICS participants from the 5 sites participating in MI adjudication at the time of analysis who were free from MI at baseline and had complete baseline data for ASCVD risk calculator variables (age, sex, race, total cholesterol, HDL cholesterol, smoking status, diabetes, systolic blood pressure, and antihypertensive treatment), HIV viral load, and CD4 T cell count. We calculated predicted ASCVD risk by inserting individual-level baseline data into the PCEs. In order to account for variable follow up time, we used a similar approach to prior analyses evaluating the PCEs in cohort studies which accounts for differences between the event prediction interval and the available length of follow-up.26 Using this approach, we created an “observed prime” (observed’) 10-year MI rate by multiplying the observed 10-year MI rate by the Kaplan-Meier 10-year failure estimate. Study follow-up started 6 months after initial CNICS study visit or the initial date of MI surveillance. The outcome of interest was time to MI; study participants were censored at 10 years, if they experienced death, or if they were lost to follow up. We performed sensitivity analyses of the PCEs in which we excluded all participants under 40 years old at baseline (because the PCEs were originally intended for ASCVD risk assessment in 40 to 79 year olds) and all participants with diagnoses of cocaine use given the association of cocaine with MI independent of CVD risk factors.28
We evaluated the discrimination of the PCEs using Harrell’s C statistic; <0.70, 0.70 to 0.80, and >0.80 were considered inadequate, acceptable, and excellent levels of discrimination.29 Model calibration was evaluated by the Greenwood-Nam-D’Agostino (GND) approach, which analyzes calibration of models on four levels using a hierarchy of increasing strictness (corresponding to mean, weak, moderate, or strong calibration).30,31 The first level (mean calibration) measures whether the overall average predicted risk equals the observed event rate. The second level (weak calibration) evaluates the slope and intercept of the models; the closer to 1 the slope and closer to 0 the intercept, the better the calibration. The third level evaluates whether observed and predicted event rates are equal for groups of patients within the same general predicted risk strata; if so, the model is considered to be moderately calibrated. The fourth level (strong calibration) requires predicted and observed event rates to correspond for every covariate pattern and is not possible when continuous predictors are used.30,31 We used the GND method to evaluate model calibration for the overall cohort and separately by race-sex groups.
Derivation, Validation, and Performance of De Novo HIV-Specific MI Risk Estimator
After analyzing the PCEs, we created two new risk scores using data-derived coefficients. We included all variables from the ASCVD risk score, statin use, and HIV-specific variables (HIV viral load, CD4 count, any ART therapy, and protease inhibitor use) as possible covariates. Single imputation was used for baseline variables with <50% missingness. We removed one site, University of Alabama-Birmingham (UAB), from model derivation analyses in order to use it as a validation sample; we chose UAB as the validation sample because of its demographic similarities to the U.S. HIV+ population, as described in the Supplement.32 Data from the other four CNICS sites were randomly split into a training sample (to fit the models) and a holdout sample (to evaluate the models). The first risk score (HIVMI-1) used lasso and ridge regression, whereas the second (HIVMI-2) used an average of Cox models to select variables and determine coefficients. Scores were evaluated in the validation cohort by Harrell’s C Statistic and the aforementioned calibration hierarchy.31
We considered simpler methods than creating new data-derived risk scores. One supplementary analyses added 10 years to each participant’s baseline PCE risk estimates in order to theoretically account for earlier MI occurrence in HIV, whereas the other multiplied observed prime MI rates by a uniform data-derived multiplier.
Although a strength of CNICS is its differentiation between type I MIs, which are due to plaque rupture and thrombosis, and type II MIs, which result from supply-demand mismatch, we did not differentiate between MI types for this analysis because existing cardiovascular risk prediction models (including the PCEs) do not differentiate between MI types33 and because we had insufficient type I events to derive stable model estimates.
RESULTS
Demographic and Clinical Characteristics
Characteristics of participants with complete baseline covariate measurements (N=11288; 247 persons with MI over a mean follow-up of 4.1 years) are shown in Table 1. The cohort was relatively young at baseline and the majority (70%) were taking ART. Mean 10-year ASCVD risk estimates based on the PCEs were highest for black men and lowest for white women. Observed MI rates across demographic and clinical strata are shown in Supplementary Table 1. MI rates were higher among black men and women, participants ≥40 years old at baseline, and participants with greater HIV viral loads and lower CD4 counts. Racial differences in MI rates were largely driven by more type II MIs occurring among blacks; type I MI rates were identical for black and white men (3.1/1000 person-years). Participants with worse HIV viral control and immunologic suppression had elevated total and type I MI rates.
Table 1.
Baseline characteristics, stratified by race-sex groups
| Variable | Black Female (N=1277) | Black Male (N=3107) | White Female (N=761) | White Male (N=6143) | P Value |
|---|---|---|---|---|---|
| ASCVD risk estimated by PCEs (mean, SD) | 4.9 (8.2) | 6.4 (7.0) | 3.2 (4.9) | 4.3 (5.8) | <0.001 |
| Mean age (years) | 43.1 | 40.5 | 41.3 | 41.4 | <0.001 |
| Mean follow-up (years) | 3.9 | 3.8 | 4.3 | 4.4 | <0.001 |
| Diabetes: % | 12.1 | 8.2 | 7.2 | 5.2 | <0.001 |
| Ever Smoker: % | 25.8 | 32.1 | 31.9 | 28.6 | <0.001 |
| Systolic BP: mean (mmHg) | 126 | 128 | 119 | 126 | <0.001 |
| Body-mass index (kg/m2) | 30.1 | 26.0 | 27.3 | 25.4 | <0.001 |
| Taking lipid-lowering therapy: % | 10.3 | 6.8 | 7.1 | 7.9 | 0.001 |
| Taking antihypertensive medications: % | 36.3 | 25.2 | 14.5 | 13.3 | <0.001 |
| Taking ART: % | 75.5 | 79.7 | 72.7 | 76.9 | <0.001 |
| Taking PI: % | 38.2 | 37.9 | 39.6 | 39.8 | 0.332 |
| Total cholesterol: mean (mg/dl) | 180 | 170 | 183 | 176 | <0.001 |
| Triglycerides: mean (mg/dl) | 135 | 145 | 172 | 188 | <0.001 |
| HDL cholesterol: mean (mg/dl) | 50 | 43 | 45 | 38 | <0.001 |
| LDL cholesterol: mean (mg/dl)* | 105 | 100 | 107 | 105 | <0.001 |
| CD4 count: mean (mg/dl) | 495 | 417 | 481 | 470 | <0.001 |
| HIV viral load undetectable: % | 64.1 | 65.5 | 65.1 | 68.9 | <0.001 |
| HIV viral load: mean | 22443 | 35064 | 41157 | 23196 | 0.002 |
6% of participants were missing LDL cholesterol
ART: antiretroviral therapy
PI: protease inhibitor
Performance of ACC/AHA Pooled Cohort Equations in CNICS
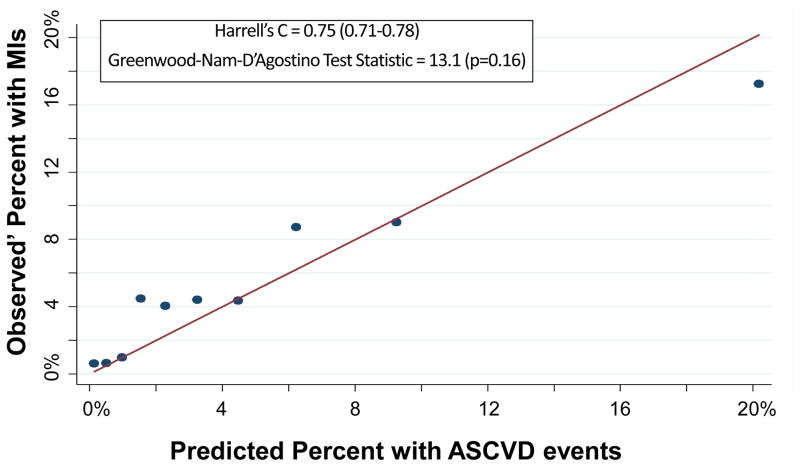
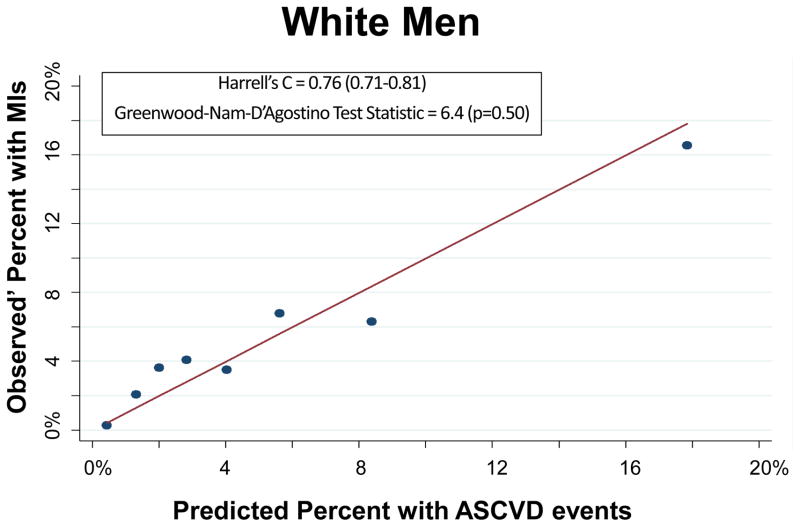
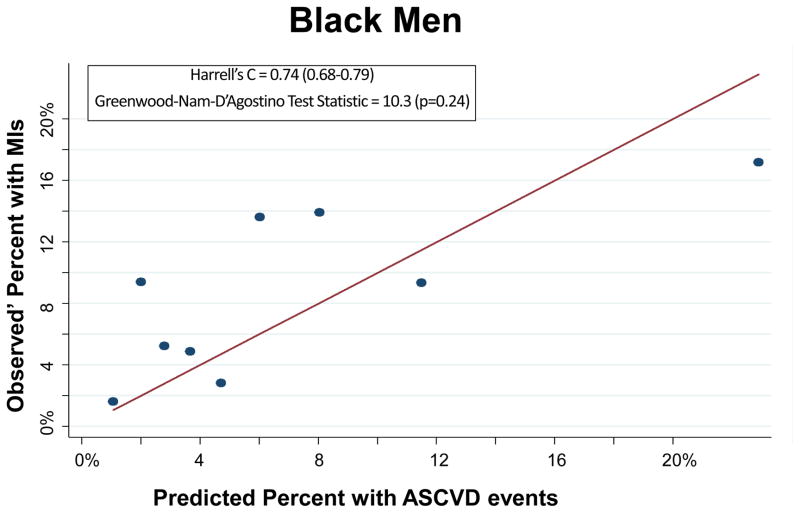
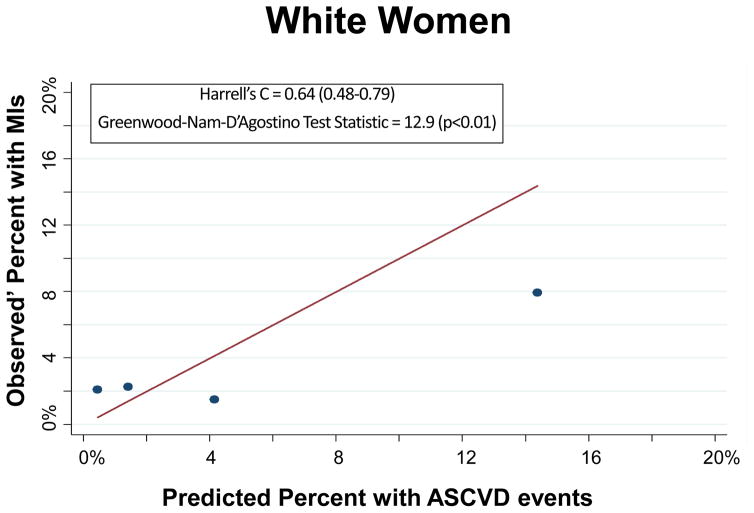
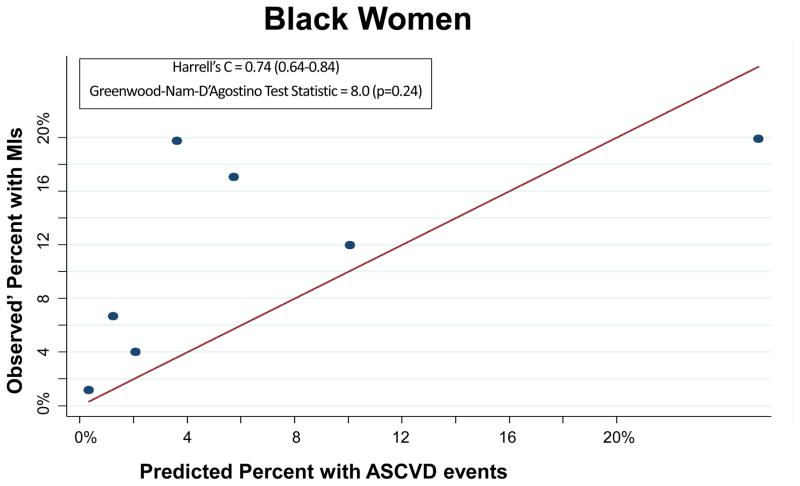
The PCEs discriminated ASCVD risk adequately overall (Harrell’s C Statistic = 0.75, 95% CI 0.71–0.78) and in most race-sex groups (Table 2). The PCEs were relatively well fit in the overall cohort [Table 2 and Figure 1; slope = 0.815; intercept = 0.0015; GND test statistic = 13.1 (p=0.16)] and particularly well fit for white men [Table 2 and Figure 2A; slope = 0.857; intercept = 0.009; GND test statistic = 6.4 (p=0.50)], meeting criteria for moderate calibration per the GND framework. However, the PCEs were not as well fit for black men, black women, or white women (Table 2 and Figures 2B–2D). Observed’ MI rates consistently exceeded predicted rates across the low-to-moderate risk spectrum (<10% predicted 10-year ASCVD risk); this under-prediction was particularly marked among black men (Figure 2B) and black women (Figure 2D). In a sensitivity analysis excluding the 987 participants with diagnoses of cocaine use, the performance of the PCEs was unchanged. In separate supplementary analyses in which we added 10 years to all study participants’ baseline PCE inputs and multiplied observed prime MI rates by a uniform multiplier, discrimination was similar and calibration was worse than for the PCEs.
Table 2.
Performance of Pooled Cohort Equations in CNICS
| Discrimination (Harrell’s C Statistic) | GND Test Statistic: Calibration Across Deciles (p value)* | Observed Events | Expected Events | Mean Calibration (Overall Observed vs. Expected) | Intercept(p value) | Slope(p value) | |
|---|---|---|---|---|---|---|---|
| Whole Cohort (N=19829) | |||||||
|
| |||||||
| Overall | 0.75 (0.71–0.78) | 13.1 (0.16) | 614 | 550 | 1.8 (<0.001) | 0.015 (0.03) | 0.815 (0.03) |
| White Men | 0.76 (0.71–0.81) | 6.4 (0.50) | 282 | 266 | 0.3 (<0.001) | 0.009 (0.18) | 0.857 (0.11) |
| Black Men | 0.74 (0.68–0.79) | 10.3 (0.24) | 245 | 200 | 1.5 (<0.001) | 0.046 (0.05) | 0.589 (0.08) |
| White Women | 0.64 (0.48–0.79) | 12.9 (<0.01) | 19 | 25 | 0.9 (<0.001) | 0.012 (0.30) | 0.442 (0.04) |
| Black Women | 0.74 (0.64–0.84) | 8.0 (0.24) | 104 | 63 | 2.6 (<0.001) | 0.077 (0.07) | 0.553 (0.21) |
|
| |||||||
| Baseline Age ≥40 | |||||||
|
| |||||||
| Overall | 0.70 (0.66–0.74) | 15.8 (0.07) | 490 | 465 | 0.3 (<0.001) | 0.028 (0.047) | 0.698 (0.04) |
| White Men | 0.69 (0.64–0.75) | 7.6 (0.58) | 252 | 231 | 0.5 (<0.001) | 0.025 (0.02) | 0.677 (0.01) |
| Black Men | 0.69 (0.63–0.76) | 11.7 (0.16) | 151 | 165 | 0.3 (<0.001) | 0.053 (0.15) | 0.521 (0.11) |
| White Women | 0.65 (0.48–0.82) | 10.9 (<0.001) | 9 | 14 | 2.3 (<0.001) | 0.018 (N/A) | 0.071 (N/A) |
| Black Women | 0.74 (0.66–0.83) | 7.1 (0.31) | 94 | 55 | 2.3 (<0.001) | 0.137 (0.09) | 0.267 (0.20) |
GND Test for Calibration Across Deciles requires at least 2 events in each group, thus the following risk deciles were collapsed together for the whole cohort: the 3 lowest risk deciles for white men; the 2 lowest risk deciles for black men; the 1–3, 4–6, and 7–9 lowest risk decile for white women (plus a 4th group, the highest risk decile); and the 4 lowest risk deciles for black women. For the analyses of participants 40 years or older at baseline, the following risk deciles were collapsed together: none for white men, the 2 lowest risk deciles for black men, the 5 lowest and 5 highest risk deciles for white women (thus two groups total), and the 1–3 and 4–5 lowest risk deciles for black women.
Figure 1.
Calibration Plot of Observed’ MIs across Deciles of Predicted 10-Year ASCVD Risk
Figure 2.
Calibration Plot of Observed’ MIs across Levels of Predicted 10-Year ASCVD Risk, by Race-Sex Groups
Each dot on these calibration plots represents a subgroup of the study population at similar predicted ASCVD risk. The plots display results for each of the following race-sex groups: White Men (2A), Black Men (2B), White Women (2C), and Black Women (2D). Predicted 10-year ASCVD risks (predicted by the Pooled Cohort Equations) are on the horizontal axis and observed’ MI risks are on the vertical axis. Dots above the line of unity represent mismatch with observed’ MI risks exceeding predicted ASCVD risks, whereas dots below the line represent mismatch with predicted ASCVD risks exceeding observed’ MIs.
Derivation and Performance of New HIV-Specific Risk Scores
In order to create and derive new HIV-specific risk scores, we expanded the cohort from the above analyses to include all study participants (Total N=19829; 15849 in the derivation sample which was split randomly into training and holdout samples, and 3980 in the validation sample). Of the 15849 study participants not in the validation sample, 353 experienced MIs during a mean follow-up of 4.8 years.
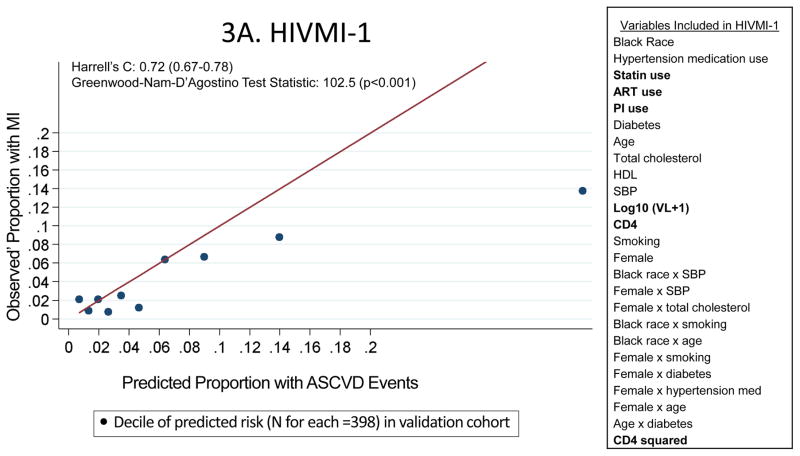
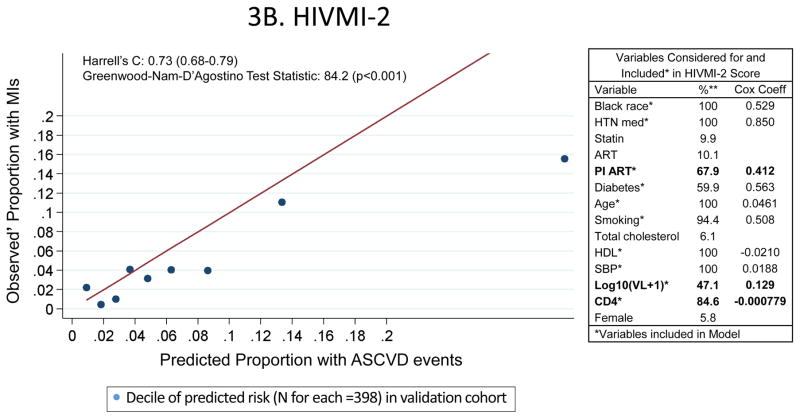
The HIVMI-1 score included several HIV-specific variables in addition to traditional ASCVD risk factors and discriminated adequately (Harrell’s C statistic = 0.72; 95% confidence interval 0.67–0.78) in the validation sample (Figure 3A). The HIVMI-2 score also incorporated several HIV-specific variables in addition to traditional ASCVD risk factors (Figure 3B) and discriminated adequately in the validation sample (Harrell’s C statistic = 0.73; 95% confidence interval 0.68–0.79). Both HIVMI-1 [slope = 0.397; intercept = 0.014; GND test statistic = 102.5 (p<0.001)] and HIVMI-2 [slope = 0.498; intercept = 0.010; GND test statistic = 84.2 (p<0.001)] exhibited substantially worse calibration than the PCEs. In a sensitivity analysis in the validation cohort including only participants with complete covariates, there was little change in the performance of HIVMI-1 and HIVMI-2.
Figure 3.
Characteristics and Performance of the De Novo Risk Scores in CNICS
These calibration plots depict the performance of the two de novo risk scores in the validation sample (the UAB site of CNICS; N=3980). Variables in bold were not in the PCEs but were included in the new models. Predicted 10-year ASCVD risks are on the horizontal axis and observed’ MI risks are on the vertical axis. Dots above the line of unity represent mismatch with observed’ MI risks exceeding predicted ASCVD risks, whereas dots below the line represent mismatch with predicted ASCVD risks exceeding observed’ MIs.
DISCUSSION
The ACC/AHA Pooled Cohort Equations (PCEs) exhibited acceptable discrimination and moderate calibration when used to predict MIs for HIV+ individuals from a multi-site U.S. HIV cohort with adjudicated MIs. Neither of two data-derived models incorporating HIV-specific variables improved MI risk prediction in this population.
The HIVMI-1 and HIVMI-2 scores did not improve over the PCEs in CNICS for several potential reasons. Traditional ASCVD risk factors are essential for risk estimation in general and remain important in the setting of HIV; thus, the bar for new risk prediction tools incorporating new factors to predict ASCVD events is relatively high. Furthermore, although we know HIV-related factors (e.g., HIV viral load and CD4 T cell count) are associated with ASCVD, we know relatively little about how strongly these factors or other HIV-associated biomarkers are associated with ASCVD. Future risk estimation models incorporating novel HIV-specific factors and potentially biomarkers that reflect HIV-related ASCVD risks would be of interest. This may provide a future use for biorepository samples from HIV cohorts.
Although the PCEs were moderately calibrated when used for MI prediction in CNICS, there remained fairly consistent mismatch between the PCEs and observed’ MIs in CNICS, particularly for groups with risks at or near thresholds at which statins are often recommended in the general population (5–10% 10-year predicted ASCVD risk). Participants for whom the PCEs predicted <10% 10-year ASCVD risk had consistently higher-than-predicted MI rates, whereas participants with ≥10% predicted risk generally had MI rates that were lower than predicted.
There are several potential reasons for the consistent over-prediction of MI risk in the highest risk groups. Patients with poorly controlled HIV may have high predicted MI risk and substantial competing risks for non-cardiovascular causes of death. Thus, these participants may have contributed many person-years at high predicted risk but died from non-cardiovascular causes before theoretical MIs would have occurred, leading to over-prediction at higher levels of risk. Survival bias may also have contributed to this mismatch. Age is a strong contributor to MI risk, and older HIV-infected persons may have an elevated burden of traditional and HIV-related MI risk factors. While these factors would contribute to elevated predicted MI risk for older HIV-infected persons, these persons would also be likely to have survived longer with HIV and may therefore be particularly likely to have greater access to care, social support, or other unmeasured factors that could prevent incident MI. Finally, patients at higher MI risk were more likely to take statins, which decrease incident MI rates and thus may have modified observed’ MI rates downward disproportionately in these higher risk groups.
The PCEs were substantially better calibrated than the two new, HIV-specific models (HIVMI-1 and HIVMI-2) in CNICS. Thus, these new models as presently constructed should not replace the PCEs for ASCVD risk prediction in HIV. An additional difficulty with HIVMI-1 and HIVMI-2, as well as other HIV-specific risk prediction models (such as the D:A:D risk score)23, is the changing nature of ART; the proportion of HIV+ patients taking PIs has changed over time, which may lead to confounding in risk models incorporating different ART medications.
The consistent under-prediction of the PCEs over the low-to-moderate risk spectrum may have direct clinical implications. Current ACC/AHA guidelines recommend consideration of statin therapy for patients at ≥7.5% (and in some cases ≥5%) predicted 10-year ASCVD risk. Thus, model calibration is more clinically meaningful in the low- to moderate-risk spectrum – near decision thresholds for statin use – than in the highest risk groups, in which the benefits of statin therapy most clearly outweigh the risks. Given our finding that HIV+ patients at <10% predicted 10-year risk (by the PCEs) had consistently greater-than-expected event rates, it may be reasonable for clinicians treating HIV+ patients to use the PCEs as a baseline gauge of what their patients’ lowest predicted ASCVD risks are. For instance, if an HIV+ patient’s predicted 10-year ASCVD risk is 8%, our findings suggest that the “true” risk for this patient is at least 8% and perhaps greater. Thus in this case, this risk of at least 8% could guide clinician-patient consideration of CVD-preventive therapy, keeping in mind potential interactions of these therapies (particularly statins) with ART medications.34
A caveat to the clinical applicability of these risk estimates is the relatively high number of type II MIs among HIV+ persons in CNICS. Type II MIs occur in the setting of systemic disease rather than inciting atherothrombotic events and may not be as effectively prevented by atheroprotective therapies such as statins. It is likely that type II MIs are more common for HIV+ persons than uninfected persons because of their systemic disease (HIV) and susceptibility to states that trigger type II MIs, including but not limited to infection and sepsis. Furthermore, the CNICS MI screening protocol incorporated cardiac biomarkers, which likely identified a high number of type II MIs that may not have been identified otherwise. Interestingly, observed’ MI rates exceeded rates predicted by the PCEs most markedly for black men and black women and the proportion of MIs that were type II was far greater for black men and black women than their white counterparts; it is certainly possible that this excess in type II MIs among blacks drove much of this apparent under-prediction of MI risk. However, distinguishing between types of MIs was beyond the scope of this study because previous risk estimation tools have not differentiated between MI types and because we did not have sufficient type I MIs alone to create stable models. Future analyses should compare risk prediction models incorporating all MIs versus only type I MIs.
This study’s findings should be interpreted in the context of its limitations. We were unable to assess stroke because adjudicated stroke data were not yet available in CNICS (or many other large HIV cohorts). We accepted this limitation for several reasons. Statins result in greater absolute risk reductions for MI than stroke in men, who comprise the substantial majority of the HIV+ population in the United States; thus, while stroke risk is incorporated into global ASCVD risk estimates in the PCEs, the primary purpose of statin therapy for men is generally to prevent MIs.35 It is worth noting that strokes comprise a substantially greater proportion of overall ASCVD for women – particularly black women. Thus, the MI rates we observed for women in CNICS may be substantially lower than their overall ASCVD rates. Additionally, CNICS incorporated biomarkers into its MI screening protocol and thus likely captured more MIs than less sensitive adjudication protocols in cohorts from which the PCEs were derived. On balance, it is possible that this relative over-assessment of MIs and definite under-assessment of strokes resulted in ASCVD rates that would have been similar had the methods from previous cohort studies (on which the PCEs were based) been used to adjudicate MI and stroke in CNICS.
Another limitation of this study was the relatively short mean follow-up, although many participants did have ≥10 years of follow-up. We sought to address the relatively low number of persons with follow-up to 10 years by using the observed’ approach. Other study limitations include only 5 of 8 CNICS sites analyzed (sites with adjudicated MI data available). These limitations were unavoidable and acceptable given the strengths of CNICS as a modern HIV clinical cohort with rigorous MI adjudication. Another complicating factor is the young age of the U.S. HIV+ population compared with cohorts used to develop the PCEs. ASCVD risks increase with age and separation between people with higher and lower lifetime ASCVD risks become more apparent; thus, discriminating between risk strata may be particularly difficult in younger populations. Finally, a minority (<10%) of patients included in our analyses were taking statins. Statin use was more common for those with greater ASCVD risk and may have therefore decreased observed’ MI rates for higher risk deciles more than for lower risk deciles.
Despite these limitations, this study suggests that the 2013 ACC/AHA Risk Estimator’s Pooled Cohort Equations (PCEs) perform better than data-derived models incorporating HIV-specific variables at predicting MI risks for HIV+ persons. As longer term follow-up data with more ASCVD events become available for HIV+ persons, studies should re-assess whether data-derived, HIV-specific risk estimation models can substantially improve ASCVD risk prediction over the PCEs in this unique population.
Acknowledgments
Matthew J Feinstein MD, Robin Nance MS, Joseph A Delaney PhD, Hongyan Ning MD MS, Donald M. Lloyd-Jones MD ScM, Heidi M. Crane MD MPH: Substantially contributed to the conception and design of the work, data analysis and interpretation, drafting and revising the work, final approval of the work. The authors agree to be accountable for all aspects of the work. These authors had full access to all the data in the study and take responsibility for the integrity of the data and the accuracy of the data analysis.
Daniel R. Drozd MD, Susan Heckbert MD PhD, Matthew J. Budoff MD, William C. Mathews MD MSPH, Mari M. Kitahata MD MPH, Michael Saag MD, Joseph J. Eron MD, Richard D. Moore MD, Chad J. Achenbach MD MPH: Substantially contributed to the acquisition of data for the work, critically revising the work, final approval of the work. The authors agree to be accountable for all aspects of the work.
We would like to acknowledge all CNICS study personnel and participants for their contributions to this work.
The authors report no potential conflicts of interest, including relevant financial interests, activities, relationships, and affiliations.
This work was supported by several grants from the National Institutes of Health (CNICS R24 AI067039, CNICS MI supplement R24S AI067039, NHLBI R01 HL126538, University of Washington Center for AIDS Research NIAID grant P30 AI027757, Third Coast Center for AIDS Research NIAID grant P30AI117943). The work was also supported by a grant from the American Heart Association (16FTF31200010).
References
- 1.Palella FJ, Jr, Baker RK, Moorman AC, et al. Mortality in the highly active antiretroviral therapy era: changing causes of death and disease in the HIV outpatient study. Journal of acquired immune deficiency syndromes. 2006 Sep;43(1):27–34. doi: 10.1097/01.qai.0000233310.90484.16. [DOI] [PubMed] [Google Scholar]
- 2.Rodger AJ, Lodwick R, Schechter M, et al. Mortality in well controlled HIV in the continuous antiretroviral therapy arms of the SMART and ESPRIT trials compared with the general population. Aids. 2013 Mar 27;27(6):973–979. doi: 10.1097/QAD.0b013e32835cae9c. [DOI] [PubMed] [Google Scholar]
- 3.Antiretroviral Therapy Cohort C. Life expectancy of individuals on combination antiretroviral therapy in high-income countries: a collaborative analysis of 14 cohort studies. Lancet. 2008 Jul 26;372(9635):293–299. doi: 10.1016/S0140-6736(08)61113-7. [DOI] [PMC free article] [PubMed] [Google Scholar]
- 4.Sullivan PS, Jones JS, Baral SD. The global north: HIV epidemiology in high-income countries. Current opinion in HIV and AIDS. 2014 Mar;9(2):199–205. doi: 10.1097/COH.0000000000000039. [DOI] [PubMed] [Google Scholar]
- 5.Hall HI, An Q, Tang T, et al. Prevalence of Diagnosed and Undiagnosed HIV Infection - United States, 2008–2012. MMWR. Morbidity and mortality weekly report. 2015 Jun 26;64(24):657–662. [PMC free article] [PubMed] [Google Scholar]
- 6.World Health Organization. Global Health Observatory Data. [Accessed July 13, 2015];HIV/AIDS: Global situation and trends. http://www.who.int/gho/hiv/en/
- 7.Hall HI, Green TA, Wolitski RJ, et al. Estimated future HIV prevalence, incidence, and potential infections averted in the United States: a multiple scenario analysis. Journal of acquired immune deficiency syndromes. 2010 Oct;55(2):271–276. doi: 10.1097/QAI.0b013e3181e8f90c. [DOI] [PubMed] [Google Scholar]
- 8.Go AS, Mozaffarian D, Roger VL, et al. Heart disease and stroke statistics--2014 update: a report from the American Heart Association. Circulation. 2014 Jan 21;129(3):e28–e292. doi: 10.1161/01.cir.0000441139.02102.80. [DOI] [PMC free article] [PubMed] [Google Scholar]
- 9.Freiberg MS, Chang CC, Kuller LH, et al. HIV infection and the risk of acute myocardial infarction. JAMA internal medicine. 2013 Apr 22;173(8):614–622. doi: 10.1001/jamainternmed.2013.3728. [DOI] [PMC free article] [PubMed] [Google Scholar]
- 10.Chow FC, Regan S, Feske S, Meigs JB, Grinspoon SK, Triant VA. Comparison of ischemic stroke incidence in HIV-infected and non-HIV-infected patients in a US health care system. Journal of acquired immune deficiency syndromes. 2012 Aug 1;60(4):351–358. doi: 10.1097/QAI.0b013e31825c7f24. [DOI] [PMC free article] [PubMed] [Google Scholar]
- 11.Hsue PY, Deeks SG, Hunt PW. Immunologic basis of cardiovascular disease in HIV-infected adults. The Journal of infectious diseases. 2012 Jun;205(Suppl 3):S375–382. doi: 10.1093/infdis/jis200. [DOI] [PMC free article] [PubMed] [Google Scholar]
- 12.Feinstein MJ, Bahiru E, Achenbach C, et al. Patterns of Cardiovascular Mortality for HIV-Infected Adults in the United States: 1999 to 2013. The American journal of cardiology. 2016 Jan 15;117(2):214–220. doi: 10.1016/j.amjcard.2015.10.030. [DOI] [PMC free article] [PubMed] [Google Scholar]
- 13.Butt AA, Chang CC, Kuller L, et al. Risk of heart failure with human immunodeficiency virus in the absence of prior diagnosis of coronary heart disease. Archives of internal medicine. 2011 Apr 25;171(8):737–743. doi: 10.1001/archinternmed.2011.151. [DOI] [PMC free article] [PubMed] [Google Scholar]
- 14.Tseng ZH, Secemsky EA, Dowdy D, et al. Sudden cardiac death in patients with human immunodeficiency virus infection. Journal of the American College of Cardiology. 2012 May 22;59(21):1891–1896. doi: 10.1016/j.jacc.2012.02.024. [DOI] [PMC free article] [PubMed] [Google Scholar]
- 15.Triant VA, Lee H, Hadigan C, Grinspoon SK. Increased acute myocardial infarction rates and cardiovascular risk factors among patients with human immunodeficiency virus disease. The Journal of clinical endocrinology and metabolism. 2007 Jul;92(7):2506–2512. doi: 10.1210/jc.2006-2190. [DOI] [PMC free article] [PubMed] [Google Scholar]
- 16.Currier JS, Lundgren JD, Carr A, et al. Epidemiological evidence for cardiovascular disease in HIV-infected patients and relationship to highly active antiretroviral therapy. Circulation. 2008 Jul 8;118(2):e29–35. doi: 10.1161/CIRCULATIONAHA.107.189624. [DOI] [PMC free article] [PubMed] [Google Scholar]
- 17.Triant VA, Regan S, Lee H, Sax PE, Meigs JB, Grinspoon SK. Association of immunologic and virologic factors with myocardial infarction rates in a US healthcare system. Journal of acquired immune deficiency syndromes. 2010 Dec 15;55(5):615–619. doi: 10.1097/QAI.0b013e3181f4b752. [DOI] [PMC free article] [PubMed] [Google Scholar]
- 18.Moyers BS, Secemsky EA, Vittinghoff E, et al. Effect of left ventricular dysfunction and viral load on risk of sudden cardiac death in patients with human immunodeficiency virus. The American journal of cardiology. 2014 Apr 1;113(7):1260–1265. doi: 10.1016/j.amjcard.2013.12.036. [DOI] [PMC free article] [PubMed] [Google Scholar]
- 19.Shah MR, Cook N, Wong R, et al. Stimulating High Impact HIV-Related Cardiovascular Research: Recommendations From a Multidisciplinary NHLBI Working Group on HIV-Related Heart, Lung, and Blood Disease. Journal of the American College of Cardiology. 2015 Feb 24;65(7):738–744. doi: 10.1016/j.jacc.2014.12.014. [DOI] [PMC free article] [PubMed] [Google Scholar]
- 20.Aboud M, Elgalib A, Pomeroy L, et al. Cardiovascular risk evaluation and antiretroviral therapy effects in an HIV cohort: implications for clinical management: the CREATE 1 study. International journal of clinical practice. 2010 Aug;64(9):1252–1259. doi: 10.1111/j.1742-1241.2010.02424.x. [DOI] [PMC free article] [PubMed] [Google Scholar]
- 21.Edwards-Jackson N, Kerr S, Tieu H, et al. Cardiovascular risk assessment in persons with HIV infection in the developing world: comparing three risk equations in a cohort of HIV-infected Thais. HIV medicine. 2011 Sep;12(8):510–515. doi: 10.1111/j.1468-1293.2011.00916.x. [DOI] [PubMed] [Google Scholar]
- 22.Moreira Guimaraes MM, Bartolomeu Greco D, Ingles Garces AH, de Oliveira AR, Jr, Bastos Foscolo R, de Campos Machado LJ. Coronary heart disease risk assessment in HIV-infected patients: a comparison of Framingham, PROCAM and SCORE risk assessment functions. International journal of clinical practice. 2010 May;64(6):739–745. doi: 10.1111/j.1742-1241.2009.02248.x. [DOI] [PubMed] [Google Scholar]
- 23.Friis-Moller N, Ryom L, Smith C, et al. An updated prediction model of the global risk of cardiovascular disease in HIV-positive persons: The Data-collection on Adverse Effects of Anti-HIV Drugs (D:A:D) study. European journal of preventive cardiology. 2016 Jan;23(2):214–223. doi: 10.1177/2047487315579291. [DOI] [PubMed] [Google Scholar]
- 24.Goff DC, Jr, Lloyd-Jones DM, Bennett G, et al. 2013 ACC/AHA guideline on the assessment of cardiovascular risk: a report of the American College of Cardiology/American Heart Association Task Force on Practice Guidelines. Journal of the American College of Cardiology. 2014 Jul 1;63(25 Pt B):2935–2959. doi: 10.1016/j.jacc.2013.11.005. [DOI] [PMC free article] [PubMed] [Google Scholar]
- 25.Stone NJ, Robinson JG, Lichtenstein AH, et al. 2013 ACC/AHA guideline on the treatment of blood cholesterol to reduce atherosclerotic cardiovascular risk in adults: a report of the American College of Cardiology/American Heart Association Task Force on Practice Guidelines. Journal of the American College of Cardiology. 2014 Jul 1;63(25 Pt B):2889–2934. doi: 10.1016/j.jacc.2013.11.002. [DOI] [PubMed] [Google Scholar]
- 26.Muntner P, Colantonio LD, Cushman M, et al. Validation of the atherosclerotic cardiovascular disease Pooled Cohort risk equations. JAMA : the journal of the American Medical Association. 2014 Apr 9;311(14):1406–1415. doi: 10.1001/jama.2014.2630. [DOI] [PMC free article] [PubMed] [Google Scholar]
- 27.Crane HM, Heckbert SR, Drozd DR, et al. Lessons learned from the design and implementation of myocardial infarction adjudication tailored for HIV clinical cohorts. American journal of epidemiology. 2014 Apr 15;179(8):996–1005. doi: 10.1093/aje/kwu010. [DOI] [PMC free article] [PubMed] [Google Scholar]
- 28.Lloyd-Jones DM. Cardiovascular risk prediction: basic concepts, current status, and future directions. Circulation. 2010 Apr 20;121(15):1768–1777. doi: 10.1161/CIRCULATIONAHA.109.849166. [DOI] [PubMed] [Google Scholar]
- 29.Qureshi AI, Suri MF, Guterman LR, Hopkins LN. Cocaine use and the likelihood of nonfatal myocardial infarction and stroke: data from the Third National Health and Nutrition Examination Survey. Circulation. 2001 Jan 30;103(4):502–506. doi: 10.1161/01.cir.103.4.502. [DOI] [PubMed] [Google Scholar]
- 30.Demler OV, Paynter NP, Cook NR. Tests of calibration and goodness-of-fit in the survival setting. Statistics in medicine. 2015 Feb 11;34:1659–1680. doi: 10.1002/sim.6428. [DOI] [PMC free article] [PubMed] [Google Scholar]
- 31.Van Calster B, Nieboer D, Vergouwe Y, et al. A calibration hierarchy for risk models was defined: from utopia to empirical data. Journal of clinical epidemiology. 2016 Jan 6;74:167–176. doi: 10.1016/j.jclinepi.2015.12.005. [DOI] [PubMed] [Google Scholar]
- 32.Centers for Disease Control and Prevention. [Accessed May 4 2016];HIV in the United States: At A Glance. 2015 Sep 29; http://www.cdc.gov/hiv/statistics/overview/ataglance.html.
- 33.Thygesen K, Alpert JS, Jaffe AS, et al. Third Universal Definition of Myocardial Infarction. Circulation. 2012 Aug 24;126:2020–2035. doi: 10.1161/CIR.0b013e31826e1058. [DOI] [PubMed] [Google Scholar]
- 34.Feinstein MJ, Achenbach CJ, Stone NJ, Lloyd-Jones DM. A Systematic Review of the Usefulness of Statin Therapy in HIV-Infected Patients. The American journal of cardiology. 2015 Jun 15;115(12):1760–1766. doi: 10.1016/j.amjcard.2015.03.025. [DOI] [PubMed] [Google Scholar]
- 35.Amarenco P, Tonkin AM. Statins for stroke prevention: disappointment and hope. Circulation. 2004 Jun 15;109(23 Suppl 1):III44–49. doi: 10.1161/01.CIR.0000131518.25959.8F. [DOI] [PubMed] [Google Scholar]


