ABSTRACT
mTOR coordinates growth signals with metabolic pathways and protein synthesis and is hyperactivated in many human cancers. mTOR exists in two complexes: mTORC1, which stimulates protein, lipid, and ribosome biosynthesis, and mTORC2, which regulates cytoskeleton functions. While mTOR is known to be involved in the DNA damage response, little is actually known regarding the functions of mTORC1 compared to mTORC2 in this regard or the respective impacts on transcriptional versus translational regulation. We show that mTORC1 and mTORC2 are both required to enact DNA damage repair and cell survival, resulting in increased cancer cell survival during DNA damage. Together mTORC1 and -2 enact coordinated transcription and translation of protective cell cycle and DNA replication, recombination, and repair genes. This coordinated transcriptional-translational response to DNA damage was not impaired by rapalog inhibition of mTORC1 or independent inhibition of mTORC1 or mTORC2 but was blocked by inhibition of mTORC1/2. Only mTORC1/2 inhibition reversed cancer cell resistance to DNA damage and replicative stress and increased tumor cell killing and tumor control by DNA damage therapies in animal models. When combined with DNA damage, inhibition of mTORC1/2 blocked transcriptional induction more strongly than translation of DNA replication, survival, and DNA damage response mRNAs.
KEYWORDS: breast cancer, DNA damage, mTOR, protein synthesis, translational control, DNA damage response, protein synthesis, transcriptional control
INTRODUCTION
The mammalian target of rapamycin (mTOR) is a downstream kinase of the phosphatidylinositol 3-kinase (PI3K)/AKT signaling pathway that integrates signals from growth factors and nutrients to regulate key metabolic and macromolecular processes and is dysregulated in many human cancers (1–3). mTOR exists in two complexes, mTOR complex 1 (mTORC1) and mTORC2, which mediate different functions defined by their molecular composition. In response to nutrient levels, growth factors, and other mitogenic signals, mTORC1 regulates protein synthesis, lipid synthesis, and ribosome biogenesis (1, 3). mTORC1 includes the proteins mTOR, Raptor, and GβL, among others (4), and is responsible for the phosphorylation (inactivation) of the negative regulator of cap binding protein eukaryotic translation initiation factor 4E (eIF4E) known as 4E-BP1. 4E-BP1 binds and blocks the activity of the translation initiation factor eIF4E by competing for interaction with translation initiation factor eIF4G, a molecular scaffold upon which the 40S ribosome and translation factors assemble (5). mTORC2 includes the proteins mTOR, Rictor, and GβL, among others. mTORC2 regulates cytoskeleton organization in response to growth signals and is an upstream activating kinase for the AGC kinases AKT, SGK1, and protein kinase C (PKC), which can promote cell survival and proliferation through activation of AKT (6). In fission yeast, TORC2 is required for recovery from DNA replicative arrest (7) and maintenance of genome stability after S-phase-specific DNA damage (8). In budding yeast, TORC2 is required for maintenance of genome stability after double-stranded DNA (dsDNA) damage (9). In mammals, mTOR also regulates the DNA damage response (DDR) to genotoxic chemotherapeutic agents and ionizing radiation, in part by mTORC1 regulation of the p53/p21 pathway (10), in part by acting on cell cycle regulator CHK1 (11), and by mTORC1/2 regulation of FANCD2 expression, an essential DNA repair component of the Fanconi anemia complex (12–14). mTORC1 itself is inhibited by p53 in response to genotoxic DNA damage (15, 16). Adding further complexity, interaction of Rictor, a component of mTORC2, with the DDR protein BRCA1 inhibits mTORC2 phosphorylation of AKT (17). There is also evidence that both mTORC1 and mTORC2 function in protecting against genotoxic DNA damage in many types of cancer cells, as shown by selectively silencing Raptor or Rictor (11, 18–20), although the relative contributions of transcription and translation were not explored.
Allosteric mTOR inhibitors such as everolimus (RAD001) only impair mTORC1 activity and have a limited anticancer effect, even in combination with conventional genotoxic (DNA-damaging) chemotherapies (21). More recent ATP-competitive inhibitors of both mTORC1 and -2 more fully impair cancer cell proliferation and viability than allosteric mTORC1 inhibitors and show increased antitumor activity, alone or with genotoxic DNA damage therapies (1, 22, 23). mTOR therefore promotes cell survival from genotoxic DNA damage, but a mechanistic understanding remains poor. Furthermore, whether the different mTOR targets and pathways in the DDR involving the p53/p21 axis, cell cycle checkpoints, DNA repair protein interactions, and selective mRNA translation coordinate responses to DNA damage has not been explored. Here we have investigated the mTORC1- and mTORC2-dependent responses to DNA damage.
RESULTS
mTORC1/2 but not mTORC1 inhibition sensitizes cancer cells and human tumor xenografts to genotoxic DNA damage.
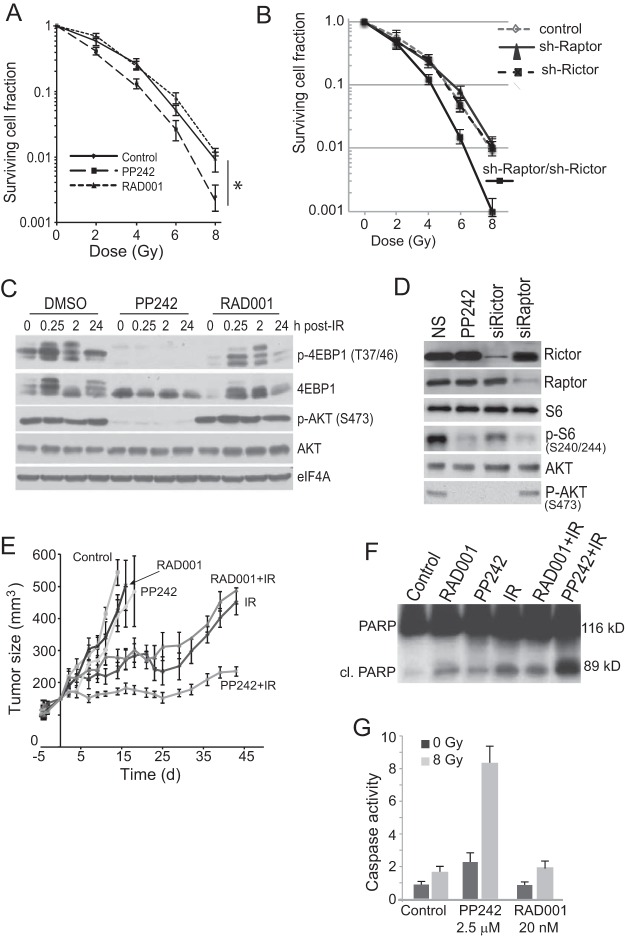
To determine the role of mTOR in protection against genotoxic DNA damage, we used ionizing radiation (IR) because it can be precisely controlled and SUM149 inflammatory breast cancer (IBC) cells because they are highly resistant to DNA damage-mediated killing (16, 24, 25). SUM149 cells are mutated in p53 and BRCA1 DNA damage sensors that inhibit mTORC1 and mTORC2, respectively, like many breast cancers (15–17). Clonogenic survival assays were carried out to determine the effect of mTORC1 or dual mTORC1/2 inhibition in response to genotoxic DNA damage by RAD001 (mTORC1) or PP242 (mTORC1/2). The levels of mTOR-inhibiting drugs used (2.5 μM PP242 and 20 nM RAD001) were chosen based on titration to the lowest effective level for inhibition of mTORC1 and/or mTORC2 activity in these cells, at levels that are consistent with selective mTORC1 or mTORC1/2 inhibition (22, 26). Much higher levels (5-fold) have been shown in vivo to also target the RET receptor, JAK kinases, and ATR (27). Inhibition of mTORC1/2 but not mTORC1 alone increased cell killing over a range of IR-mediated DNA damage by 5- to 8-fold (Fig. 1A). This was found to require inhibition of mTORC1 and -2. For instance, inhibition of mTORC1 by silencing Raptor, or of only mTORC2 by silencing Rictor, did not sensitize cells to genotoxic DNA damage over that of nonsilenced controls, whereas silencing of both strongly enhanced sensitivity to DNA damage by 6- to 10-fold (Fig. 1B). Inhibition of mTORC1 or mTORC1/2 activity by RAD001 and PP242, respectively, or silencing Raptor or Rictor, was shown by reduced phosphorylation of 4E-BP1 T37/46 or P-S6 S240/244 and AKT-S473 (Fig. 1C and D). Of note is the much stronger inhibition of mTORC1 activity by the ATP site PP242 inhibitor, as shown by 4E-BP1 phosphorylation.
FIG 1.
mTORC1/2 activity is required for resistance to genotoxic DNA damage. (A) Genotoxic cell death is enhanced by mTORC1/2 but not mTORC1 inhibition. SUM149 cells were plated for colony survival assays following treatment with PP242, RAD001, or DMSO vehicle for 2 h prior to IR up to 8 Gy. Colonies were stained 14 days after plating and scored from 3 independent studies; SEM is shown. *, P < 0.01 by t test. (B) SUM149 cells silenced using small interfering RNAs (siRNAs) against Raptor, Rictor, or both were subjected to increasing IR dose levels, as shown. The 3-(4,5-dimethyl-2-thiazolyl)-2,5-diphenyl-2H-tetrazolium bromide (MTT) assay was used for quantitation of cell death. Results are the averages from 3 independent studies with SEM. (C) SUM149 cells were treated as described above for 2 h prior to IR with 8 Gy and harvested at the indicated times, and equal amounts of protein were examined by immunoblot analysis. Representative results of 3 independent analyses are shown. (D) SUM149 cells transfected with siRNAs to silence Raptor or Rictor were mock treated or treated with IR at 8 Gy and then were harvested 24 h later. Equal protein amounts of lysates were used for immunoblot analyses. Representative immunoblots are shown. (E) Inhibition of mTORC1/2 but not mTORC1 impairs tumor growth when combined with IR-mediated genotoxic DNA damage. NCR nude mice were injected in the right lower flank with SUM149 cells, tumors were grown to 150 mm3, animals were treated with 100 mg/kg PP242, 2.5 mg/kg RAD001, or vehicle, and tumor sizes were recorded every 3 days. Tumors were irradiated for 3 consecutive days (days 3 to 5) with 8 Gy, initiating 2 days after the start of drug treatments. (F) Tumors were excised from animals at day 15, whole-cell lysates were prepared, and equal amounts of soluble proteins were resolved and immunoblotted for full-length and cleaved PARP. (G) SUM149 cells were treated with the indicated drugs for 2 h prior to irradiation with 8 Gy. Caspase-3/7 activity was measured at 48 h after treatment.
Tumor sensitivity was next assessed with SUM149 tumors grown subcutaneously in athymic mice, testing inhibition of mTORC1 (RAD001) or mTORC1/2 (PP242) and concurrent IR, with treatment initiated when tumors reached ∼150 mm3 in size. Inhibition of neither mTORC1 alone nor mTORC1/2 alone had a significant effect on tumor growth (Fig. 1E). However, when combined with IR-mediated DNA damage, inhibition of mTORC1/2 but not mTORC1 significantly impaired tumor growth. Cleavage of poly(ADP-ribose) polymerase (PARP) is a marker of caspase-3-mediated cell death. Equal amounts of tumor soluble protein lysates showed that whereas mTORC1 or mTORC1/2 inhibition increased PARP cleavage, as did IR, only mTORC1/2 inhibition with genotoxic DNA damage by IR did so strongly (Fig. 1F), consistent with more effective tumor control. This was confirmed by analysis of caspase-3/7 activation itself, with and without IR, in SUM149 cells (Fig. 1G). Collectively, these data show that inhibition of mTORC1/2 but not mTORC1 strongly sensitizes normally resistant IBC cells and tumors to genotoxic DNA damage.
mTORC1/2 but not mTORC1 coordinates transcription and translation of mRNAs associated with cell cycle progression, DNA metabolism, and the DDR.
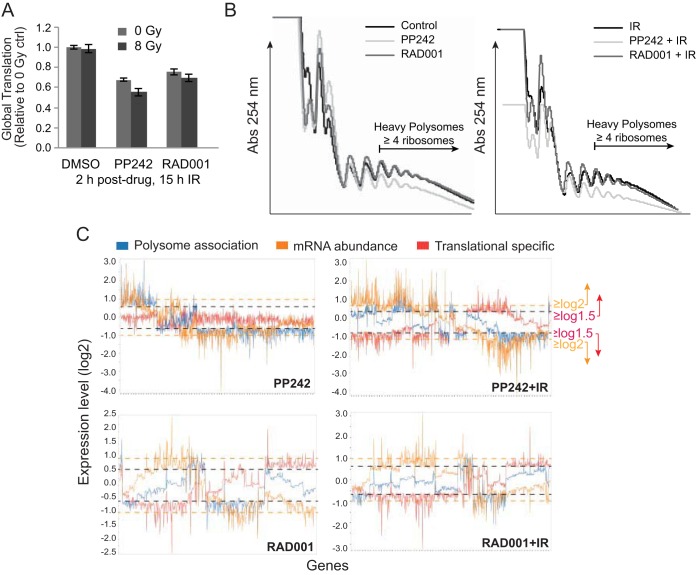
Next, we explored the extent to which mTORC1 or mTORC1/2 inhibition sensitizes tumor cells to DNA damage at the level of translation and/or transcription. Downregulation of overall protein synthesis was only slightly greater with inhibition of mTORC1/2 than with that of mTORC1 at these dose levels and was not further affected by IR (Fig. 2A).
FIG 2.
mTORC1/2 but not mTORC1 inhibition strongly alters both mRNA abundance and translation when combined with genotoxic DNA damage. (A) SUM149 cells were treated with PP242, RAD001, or DMSO 2 h prior to IR. Protein synthesis rates were determined by protein specific activity after [35S]methionine labeling and trichloroacetic acid (TCA) precipitation analysis from 3 independent studies, normalized to untreated, nonirradiated control values. SEMs are shown. (B) SUM 149 cells were treated as described above and fractionated by sucrose gradients. Representative polysomal fractionation profiles are shown. (C) RNA extracted from cytoplasmic extracts (total mRNA) and heavy polyribosome fractions (well translated) were used to determine mRNA total abundance and translation activity by hybridization to Affymetrix gene expression arrays. Results are averaged from 3 independent studies. Line graphs represent mRNAs significantly altered in abundance, heavy polysome association, or translation (heavy polysome/total mRNA); P < 0.05. Orange line, cutoff for significant change in mRNA abundance (−1.0 ≥ log2 expression level ≥ 1.0). Black line, cutoff for significant change in polysome association or translation efficiency (−0.6 ≥ log2 expression level ≥ 0.6).
We therefore carried out simultaneous genome-wide translatome and transcriptome analysis on cells inhibited in mTORC1/2 with PP242 or only mTORC1 with RAD001, with or without concurrent IR. Total mRNA levels were compared to mRNA levels in the well-translated (≥4-ribosome) fraction, obtained by sorting polyribosomes through sucrose gradients (Fig. 2B). Polysomal profiling showed only a small reduction in mRNA-ribosome content with mTORC1/2 inhibition, which was not significantly changed by IR-mediated DNA damage (Fig. 2C). The small reduction in heavy polysomes with mTORC1/2 inhibition is consistent with selective translation reduction of specific mRNAs. Three sets of conditions were analyzed to fully explore the genome-wide changes in mRNA abundance and translation: (i) expression levels for total mRNA (largely transcription activity); (ii) mRNA polysome association, regardless of whether changes were due to mRNA abundance or translational regulation; and (iii) ratio of heavy polysome mRNA to total mRNA, which measures stronger translation-specific changes (translation efficiency). Analyses used cutoffs of log2 1.0 (2-fold) for total mRNA and log2 0.6 (1.5-fold) for heavy polysome association. The latter cutoff value was lower because smaller changes in protein expression can have large physiological effects. Significance was set at a P value of <0.05 for all analyses.
Table 1 lists the number of mRNAs altered at mRNA and/or polysome levels within the parameters described above by mTORC1 or mTORC1/2 inhibition, with or without IR-mediated genotoxic DNA damage. For all treatments, the most significant mRNA changes were downregulation, as expected, whether in abundance, polysomal association, or translation efficiency, with a small number of mRNAs upregulated as well. The number of mRNAs that displayed translation-specific alteration in efficiency (no change in mRNA abundance) with mTOR inhibition, but without IR, was surprisingly small and similar in mTORC1 (RAD001)- and mTORC1/2 (PP242)-inhibited cells (Fig. 2C). When combined with IR-mediated DNA damage, the number of translation-specific events almost doubled for both groups (Table 1). However, the identities of the mRNAs altered in abundance and/or translation in mTORC1- or mTORC1/2-inhibited cells, with or without genotoxic DNA damage, were clearly distinct between the two groups (Fig. 2C; Tables 1 and 2). mTORC1/2 inhibition more substantially and differentially reduced the transcriptomic mRNA profile than mTORC1 inhibition, which in turn resulted in a significantly different and greater reprogramming of the translatome than that seen with mTORC1 inhibition.
TABLE 1.
Number of mRNAs differentially expressed or translated with treatments
| Differential expression | No. of RNAsa |
|||
|---|---|---|---|---|
| Downregulated |
Upregulated |
|||
| PP242 treatment | RAD001 treatment | PP242 treatment | RAD001 treatment | |
| Without IR | ||||
| Abundance | 171 | 55 | 50 | 34 |
| Polysome association | 707 | 163 | 221 | 46 |
| Translation-specific activity | 152 | 149 | 77 | 140 |
| With IR | ||||
| Abundance | 187 | 31 | 321 | 64 |
| Polysome association | 373 | 151 | 205 | 30 |
| Translation-specific activity | 285 | 328 | 162 | 154 |
Number of mRNAs differentially expressed in abundance, polysome association, or translation-specific activity with the indicated treatments (P < 0.05). mRNA abundance scoring parameters, −1.0 ≥ log2 expression level ≥ 1.0; translation-specific or polysome association scoring parameters, −0.6 ≥ log2 expression level ≥ 0.6.
TABLE 2.
DNA replication genes differentially expressed or translated with treatment
| Gene symbol | DNA replication function | Expression with treatmenta |
|||||||
|---|---|---|---|---|---|---|---|---|---|
| Polysome association |
mRNA abundance |
||||||||
| PP242 | PP242-IR | RAD001 | RAD001-IR | PP242 | PP242-IR | RAD001 | RAD001-IR | ||
| GINS2 | Pre-ICb/firing | −1.59 | −1.10 | −1.27 | −1.59 | −2.17 | −1.38 | ||
| MCM10 | Licensing and rest | −1.63 | −1.49 | −2.34 | −2.74 | ||||
| ORC1 | Licensing/pre-IC | −1.63 | −1.45 | −1.64 | −2.08 | ||||
| FANCM | Firing/pre-IC | −1.18 | −1.16 | −0.94 | −0.92 | −1.00 | |||
| POLE2 | DNA elongation | −1.14 | −1.06 | −1.45 | |||||
| POLD3 | Firing/pre-IC | −1.08 | −1.05 | −1.55 | |||||
| GINS1 | Pre-IC/firing | −1.08 | −0.85 | −1.08 | −1.82 | ||||
| GINS3 | Firing | −0.98 | −0.63 | ||||||
| RFC5 | Licensing/pre-IC | −0.97 | −0.83 | ||||||
| RFC2 | Firing | −0.87 | −1.12 | −1.49 | |||||
| POLQ | DNA elongation | −0.85 | −0.85 | ||||||
| ORC6 | Inhibits licensing during S phase | −0.77 | −0.79 | ||||||
| RFC4 | Firing | −0.75 | −0.64 | −0.70 | −1.16 | ||||
| POLG2 | DNA elongation | −0.73 | −0.68 | ||||||
| MCM2 | Licensing and rest | −1.20 | |||||||
| CDC45 | Licensing | −2.08 | |||||||
| RPA1 | Origin firing | −1.08 | −1.11 | ||||||
| GMNN | Inhibition of rereplication of DNA | −0.88 | −1.28 | −1.55 | |||||
| MCM5 | Licensing and rest | −2.07 | |||||||
| POLA2 | DNA elongation | −1.39 | −1.91 | ||||||
| MCM6 | Licensing and rest | −1.85 | −2.57 | ||||||
| MCM3 | Licensing and rest | −1.49 | −2.11 | ||||||
| CLSPN | Monitoring fork integrity | −1.30 | −2.54 | ||||||
| PCNA | Firing | −1.00 | −1.29 | ||||||
| RFC3 | Firing | −1.15 | |||||||
| MDC1 | Origin firing | −0.64 | |||||||
Expression of genes involved in DNA replication that are differentially expressed in either abundance (P < 0.05, −1.0 ≥ log2 expression level ≥ 1.0) or polysomal mRNA association (P < 0.05, −0.6 ≥ log2 expression level ≥ 0.6) after treatment with 2.5 μM PP242 or 20 nM RAD001 alone or in combination with 8 Gy IR. Expression values are on a log2 scale.
Pre-IC, preinitiation complex.
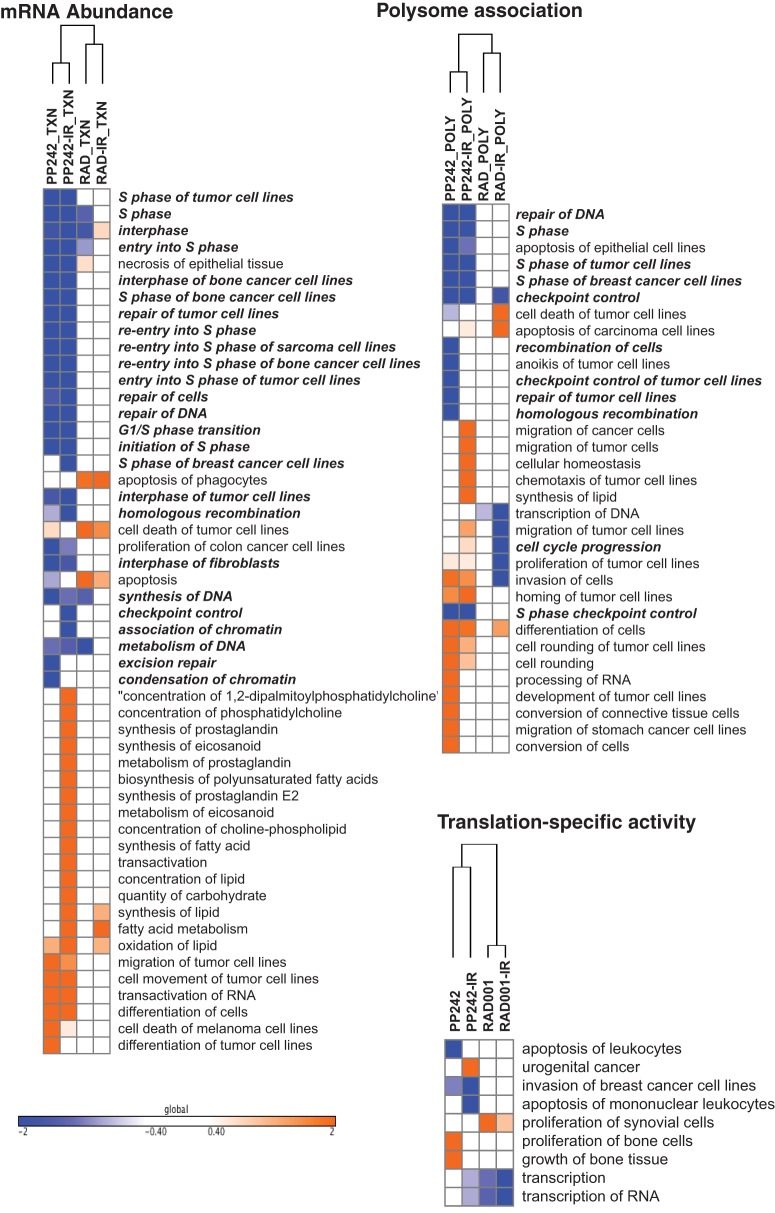
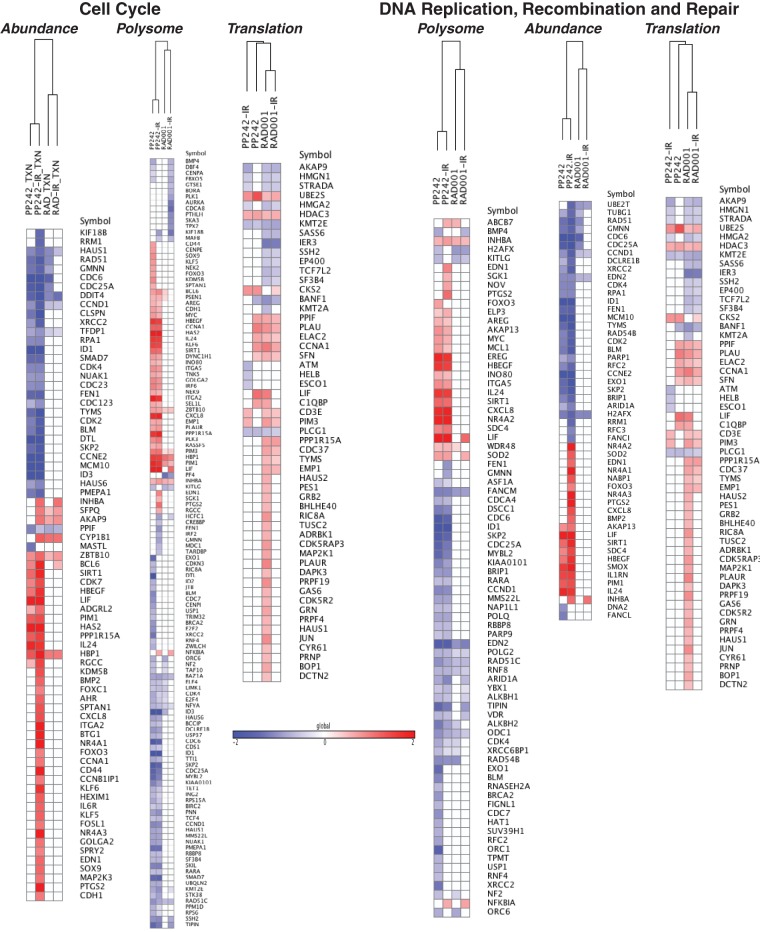
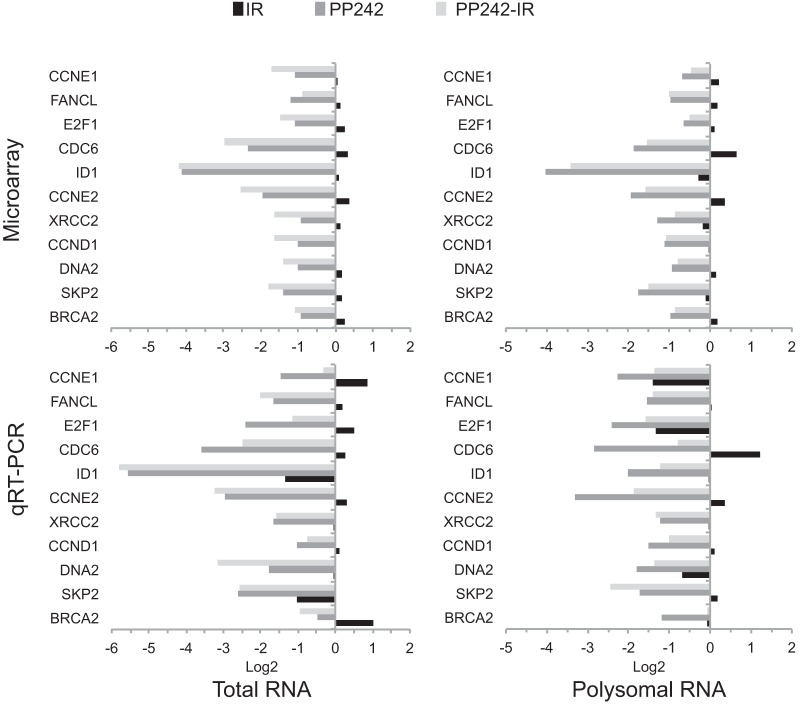
A list of all altered top-scoring mRNAs was subjected to gene ontology analysis for changes in total abundance, polysome association (regardless of translational regulation), and translation-specific changes (Fig. 3). Using Ingenuity pathway analysis (IPA), we categorized gene expression changes into experimentally authenticated biochemical and molecular networks, classifying them into biologically significant pathways (Fig. 4). Data output is represented as a z-score that quantifies the level of predicted activation or inhibition of a specific network based on the up- or downregulation of genes or mRNAs within its list. Using cutoff values of z ≥ +2.0 (activation) and z ≤ −2.0 (inhibition), lists of significantly affected biological process were developed for translational and transcriptional changes with each treatment. mRNAs that were transcriptionally altered by mTORC1/2 inhibition showed particular enrichment in downregulation of pathways involved in DNA damage response (DDR), followed by cell cycle checkpoint control and a small number of metabolism functions, all of which were also represented in polysome association (Fig. 3 and 4). These same pathways were enriched in both mRNA abundance and polysome association when mTORC1/2 inhibition was combined with genotoxic DNA damage, again with more effects driven by changes in mRNA abundance than by translation-specific changes. In contrast, inhibition of mTORC1, alone or in combination with genotoxic DNA damage, did not significantly enrich for regulation of these pathways at the mRNA abundance, polysome association, or translation-specific level. Instead, there was a small increase in proapoptotic gene expression, which correspondingly increased translation of these mRNAs in polysomes, and only a small reduction in the levels of mRNAs in DNA synthesis and cell cycle progression, but as shown below, there was no significant increase in cell death, in agreement with other reports (18–20). These results were validated by quantitative reverse transcription-PCR (qRT-PCR) for key mRNAs (Fig. 5) and by immunoblot analysis for certain corresponding proteins (see below). Inhibition of mTORC1/2 therefore results in both transcriptional and translational downregulation in DDR and cell cycle control pathways, resulting in a coordinated physiological response, whereas mTORC1 inhibition primarily results only in translational downregulation of a small number of cell cycle mRNAs and a small upregulation of proapoptotic mRNAs. We suspect that the reason there is no significant increase in cell death in mTORC1-inhibited cells is that the increase in proapoptotic gene expression is either too small or countered by inhibition of cell replication or induction of autophagy.
FIG 3.
Graphical representation of Ingenuity pathway analysis (IPA) for enrichment of subsets of mRNAs. mRNAs are identified as differentially expressed in abundance, heavy polysome association, or translational activity (heavy polysome/total mRNA). Columns show findings for different treatments, and rows indicate cellular functions of altered genes annotated for their most common functions. Functions are shown only if 2 ≤ z-score ≥ −2, defined as significant by IPA, under at least one of the conditions, and the strength of alteration is represented by the color scale. Pathways that are involved in DNA replication, repair, metabolism, or cell cycle regulation are predominant and indicated in bold.
FIG 4.
Graphical representation of mRNAs associated with cell cycle or DNA replication, recombination, and repair. mRNAs were identified to be differentially expressed in abundance (P < 0.05, −1.0 ≥ log2 expression level ≥ 1.0) or polysome association or translation-specific activity (P < 0.05, −0.6 ≥ log2 expression level ≥ 0.6) after treatment with 2.5 μM PP242 or 20 nM RAD001 alone or in combination with 8 Gy IR. The color scale represents log2 values for expression levels.
FIG 5.
qPCR analysis. The analysis validates selected differentially expressed mRNAs in SUM149 cells treated with PP242 with or without IR, or with IR alone (bottom panels). The top panels show the corresponding changes in expression identified in the microarray analysis.
mTORC1/2 but not mTORC1 inhibition specifically disrupts DDR pathways and induces replicative cell stress.
We therefore investigated the functional effects of inhibition of mTORC1/2 compared to mTORC1 on DDR pathways, including the kinetics of activation in response to DNA damage. A primary event in induction of the DDR is the rapid phosphorylation of H2AX (known as γH2AX) and its recruitment to sites of dsDNA damage as distinct foci (28). H2AX phosphorylation is mediated by kinase ATM, ATR, or DNA-PK, all members of the PI3K family (29, 30). Collectively, the PI3K family of kinases stimulates a variety of signaling pathways, all of which promote cell cycle checkpoint activation and induction of DNA repair mechanisms.
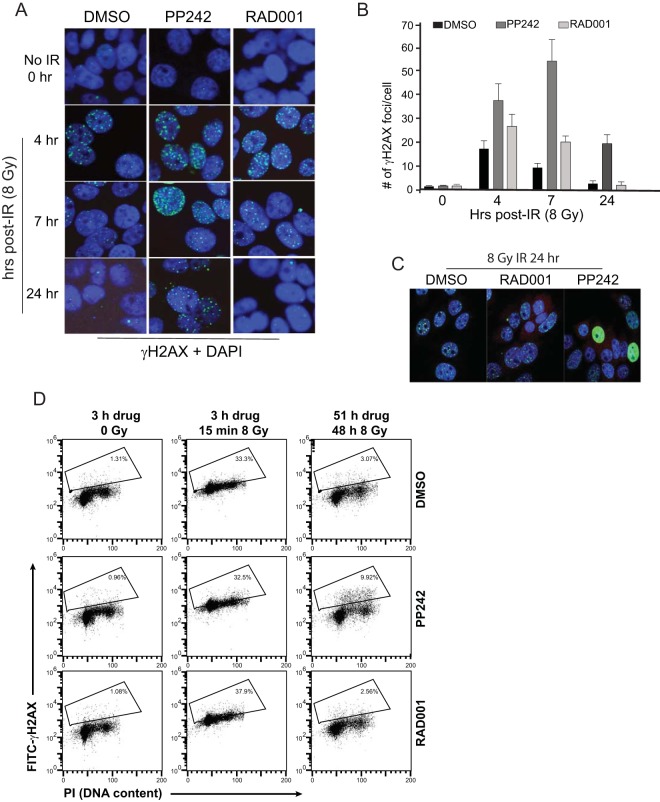
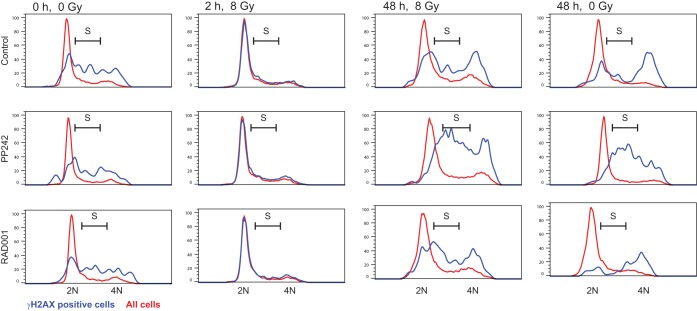
DNA damage by IR rapidly and strongly induced γH2AX foci, with resolution of dsDNA breaks typically occurring by 24 h, as indicated by disappearance of foci (Fig. 6A and B). In contrast, while IR plus mTORC1/2 inhibition initially resulted in a similar number of dsDNA breaks decorated by γH2AX as with IR alone, resolution of DNA damage was significantly delayed compared to that in untreated cells, with 4 to 5 times as many unresolved dsDNA breaks at 24 h, a time when DNA damage in untreated cells was largely resolved (Fig. 6B). We also noted the presence of a subpopulation of mTORC1/2-inhibited cells that exhibited a sustained pan-nuclear γH2AX staining pattern independent of genotoxic DNA damage (Fig. 6C). This was found to correspond to ∼10 to 15% of cells, as determined by flow cytometry after staining for γH2AX but not propidium iodide, a marker of extensive DNA damage (Fig. 6D). A sustained pan-nuclear pattern of DNA damage is indicative of cells undergoing replicative stress, such as after treatment with CHK1 inhibitors (31) or inhibitors of DNA replication (32). The pan-nuclear γH2AX-staining cells accumulated preferentially in S phase (Fig. 7), which is also indicative of replicative stress (31, 32). Thus, inhibition of mTORC1/2 activity, and not that of mTORC1 alone, induces replicative stress.
FIG 6.
Inhibition of mTORC1/2 delays resolution of DNA damage foci and induces pan-nuclear γH2AX staining. (A) Cells grown in multiwell slides were pretreated with 2.5 μM PP242, 20 mM RAD001, or DMSO 2 h prior to 8 Gy of IR, fixed, and stained at the times shown with anti-γH2AX antibody and FITC-conjugated secondary antibody. Nuclei were counterstained with DAPI. Representative results of 3 studies shown. (B) Quantification of number of γH2AX foci/cell. See Materials and Methods for quantitation details. The results show persistent unresolved dsDNA breaks in mTORC1/2-inhibited cells after IR. (C) Immunofluorescence of γH2AX in cells treated as described for panel A, showing pan-nuclear stain in only a fraction of PP242-treated cells. (D) A subset of mTORC1/2-inhibited cells demonstrate sustained γH2AX staining in S phase. Cells were pretreated for 3 h with 2.5 μM PP242, 20 nM RAD001, or DMSO, followed by flow cytometry for γH2AX and DNA content (cell cycle, propidium iodide [PI]). Percentages of cells positive for γH2AX stain are indicated.
FIG 7.
The majority of mTORC1/2-inhibited cells positive for pan-nuclear γH2AX in are in S phase. The DNA contents of all cells (red traces) or only γH2AX-positive SUM149 cells (blue traces) treated with 2.5 μM PP242, 20 nM RAD001, or DMSO for 2 h prior to 8 Gy of irradiation or mock treatment are shown. Cells were harvested at the indicated times for PI staining for flow cytometry and cell cycle distribution analysis. 2N and 4N DNA contents, as well as S phase, are indicated. The results are representative of three studies.
We characterized the activation (phosphorylation) state of key DDR pathway effectors that are involved in replicative stress. Prolonged (33-h) inhibition of mTORC1/2 but not mTORC1 strongly increased phosphorylation (activation) of DNA-PKcs (T2609), the catalytic subunit of nuclear DNA-PK (which includes Ku antigen), and CHK2 (T68), surrogates for activation of DNA-PK and ATM, respectively (33, 34) (Fig. 8A). When combined with IR-mediated DNA damage, the inhibition of mTORC1/2 but not mTORC1 strongly and continuously increased DNA-PKcs, CHK2, and ATM phosphorylation, indicative of unresolved DNA damage, as shown in Fig. 5. These data also demonstrate the specificity of PP242 in these studies, in that DNA-PKcs, ATR (CHK1 substrate), and ATM all retained activity in the presence of drug at these concentrations.
FIG 8.
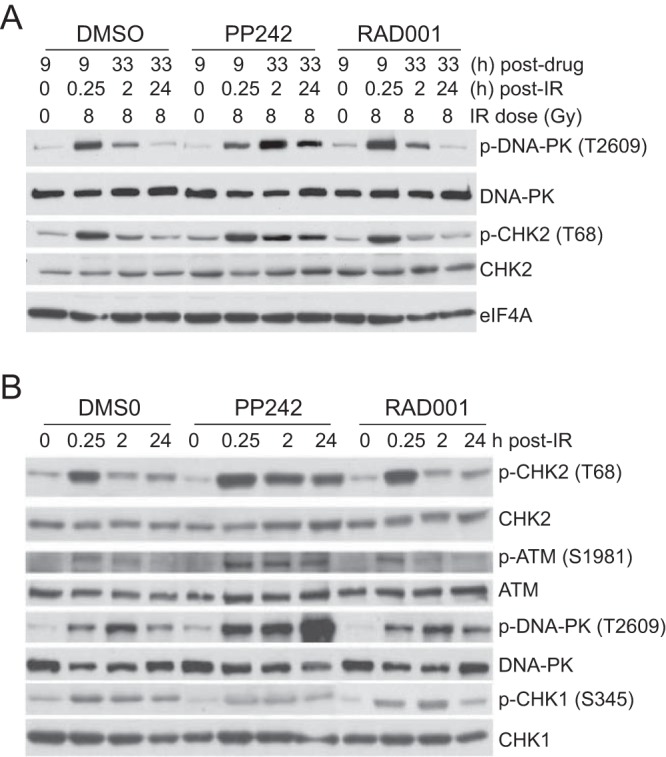
mTORC1/2 but not mTORC1 inhibition disrupts DDR pathways and induces replicative cell stress. (A) Immunoblot evidence for sustained DDR signaling with mTORC1/2 inhibition following genotoxic stress. SUM149 cells were treated with 2.5 μM PP242, 20 nM RAD001, or DMSO for 2 h prior to 8 Gy of IR and harvested, and equal protein amounts were used for immunoblot analysis. (B) SUM149 cells were treated with drugs as described above for 9 h prior to 8 Gy of IR and analyzed by immunoblotting.
To examine resolution of DNA damage, cells were treated with mTOR inhibitors and irradiated 2 h later, and the phosphorylation status of key DDR effectors was followed for 24 h. Inhibition of mTORC1/2 but not mTORC1 resulted in sustained phosphorylation of CHK2 and DNA-PK at 24 h (Fig. 8B). ATM and CHK2 form an axis that functions mainly during replicative stress and DNA damage and whose inhibition is linked to the pan-nuclear γH2AX distribution (31). Thus, our data indicate that while key kinases responsible for sensing dsDNA damage, ATM and DNA-PK, are properly activated in response to genotoxic stress, mTORC1/2 inhibition impairs the process of DNA repair through a failure to strongly express DDR mRNAs and efficiently translate them in an integrated response, impairing resolution of dsDNA breaks and increasing cell death.
The specific roles of mTORC1 and mTORC2 in dsDNA break repair were further explored by selectively silencing Raptor (mTORC1) or Rictor (mTORC2). Despite effective silencing of Raptor or Rictor and downregulation of mTORC1 or mTORC1/2 activity, as shown earlier by reduced phosphorylation of their target substrates (Fig. 1), neither alone activated DDR signaling or enhanced DDR signaling by genotoxic stress compared to PP242 treatment (Fig. 9A and B). This is evident in the failure to increase phosphorylation of DNA-PKcs, CHK2, or H2AX. However, combined silencing of Raptor and Rictor with IR did induce strong evidence of sustained dsDNA breaks and activation of DDR signaling, as shown by increased phosphorylation of P-CHK2 and H2AX (Fig. 9C). Therefore, both mTOR complexes are required for DNA repair following genotoxic DNA damage. Alkaline comet assays, which detect both single- and double-stranded DNA breaks, showed that mTORC1/2 (PP242) but not mTORC1 (RAD001) inhibition more strongly impairs the ability of cells to resolve DNA damage caused by IR (Fig. 9D). It should be noted that DNA tail length is an imperfect indicator of the extent of DNA damage in comet assays, in that mean tail length increases only while DNA breaks are first established, typically at lower levels of DNA damage, due to activation of repair functions (35). This likely accounts for the apparent lower tail break length in PP242/IR samples. It was evident that inhibition of mTORC1/2 in the absence of added genotoxic stress also increased the population of cells with DNA damage, but as shown above, in the absence of excessive DNA damage by IR this was largely reversible. This was further investigated by specifically inhibiting mTORC1 by silencing Raptor, inhibiting mTORC2 by silencing Rictor, or both and subjecting cells to a low level (10 μM) of etoposide, which causes both single- and double-strand DNA breaks. The number of DNA break foci was visualized in 100 to 200 cells by γH2AX immunofluorescence (Fig. 9E). Silencing Raptor actually slightly reduced the incidence of γH2AX foci, consistent with the effects of RAD001 in the comet assay (Fig, 9D). mTORC1 inhibition has been previously reported to have no effect or even reduce sensitivity to apoptosis in many types of cancer cells (18, 19), consistent with these data. There was a small (2-fold) increase in DNA break foci in cells silenced for Rictor compared to the nonsilencing control. However, only in cells silenced for both Raptor and Rictor was a strong increase in γH2AX-decorated DNA breaks observed, averaging 3 to 4 times that for Rictor alone. Our genomic analysis can account for the enhanced DNA damage effects of mTORC1/2 inhibition seen with genotoxic DNA damage by IR (Table 2). For example, there was strong representation of transcriptionally and translationally downregulated DNA polymerases and DNA repair factors evident with mTORC1/2 inhibition. These include DNA polymerases Pol-E2, Pol-Q, PolG2, and PolA2 and a number of licensing factors. None of these changes were evident with mTORC1 inhibition with DNA damage.
FIG 9.
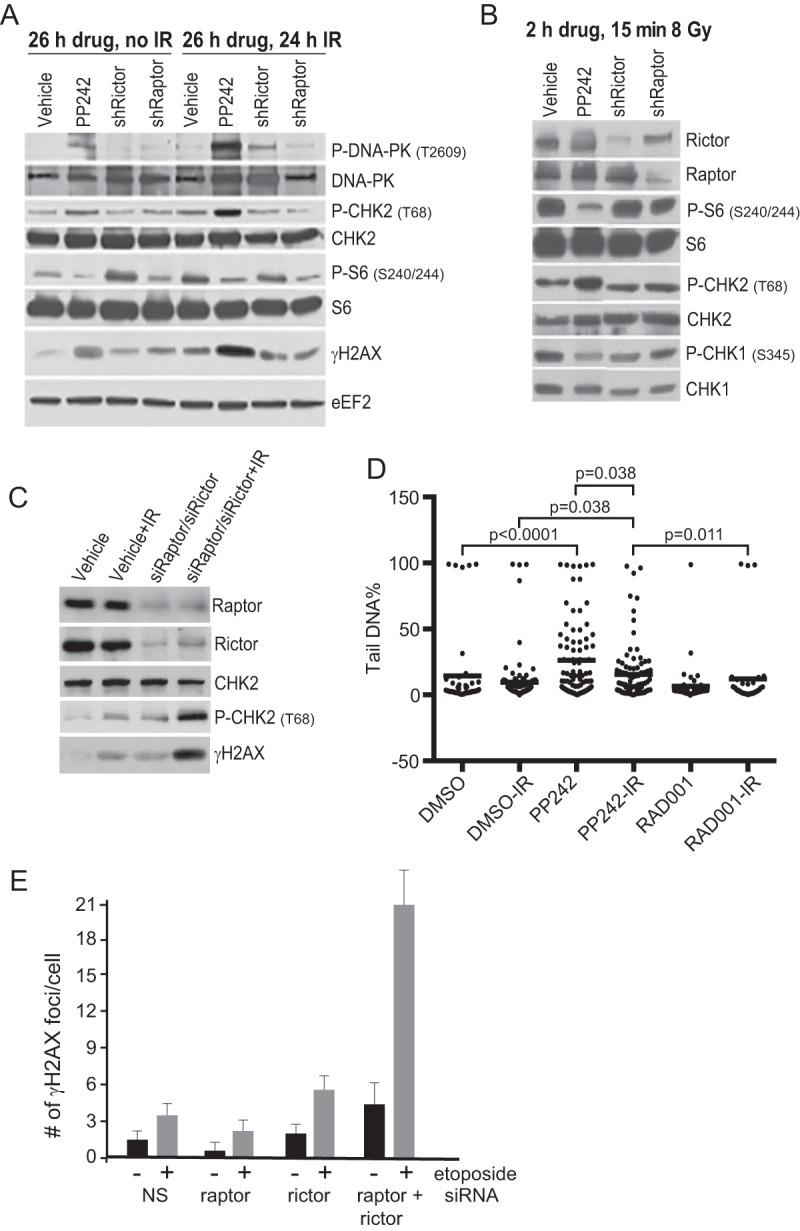
Inhibition of both mTORC1 and mTORC2 activities is required to sustain unresolved DDRs. (A) SUM149 cells expressing doxycycline-inducible short hairpin RNAs (shRNAs) to silence Raptor or Rictor were treated or silenced for 24 h and then treated with 8 Gy IR and harvested 24 h later. Equal protein amounts of lysates were used for immunoblot analysis as shown. (B) Cells were induced as described above for Raptor or Rictor silencing but treated with drug for 2 h and harvested 15 min following 8 Gy irradiation. Equal protein amounts of lysates were used for immunoblot analysis as shown. (C) SUM149 cells transfected with siRNAs for 24 h to silence Raptor and Rictor were mock treated or treated with IR at 8 Gy and then harvested 24 h later. Equal protein amounts of lysates were used for immunoblot analyses. Representative immunoblots are shown. (D) Extended dsDNA breaks in mTORC1/2-inhibited cells. Control SUM149 cells or cells were treated with drugs as described above with pretreatment for 2 h prior to 8 GY IR and then harvested for alkaline comet assays 24 h later. Comet tail DNA was quantified using the Open Comet ImageJ plug-in. Data analysis was performed from 3 independent replicates using GraphPad Prism and ANOVA. (E) Cells silenced for either Raptor or Rictor as described above were treated with 10 μM etoposide for 15 h, fixed, and stained with DAPI to illuminate nuclei and an antibody to γH2AX. Punctate γH2AX staining was scored at a magnification of ×63 per nucleus.
mTORC1/2 inhibition promotes dysregulation of cell cycle checkpoint controls in response to genotoxic stress.
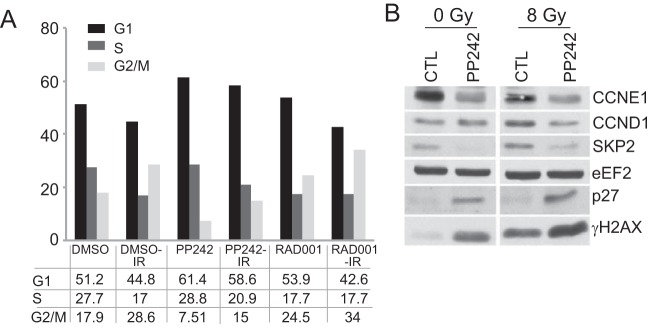
mTOR inhibition is associated with impaired cell cycle progression and checkpoint signaling (36, 37), which we show is exacerbated by DNA damage (Table 1). The cellular response to dsDNA breaks occurs principally through the protein kinase ATM, which signals to both CHK2 and p53 to block entry into S phase by activating the G1 checkpoint (38). SUM149 cells, like many highly malignant cancer cells, are mutated in p53 (39) and therefore do not activate the G1 checkpoint. Instead, they rely on G2/M checkpoint activation to repair DNA damage. Accordingly, following genotoxic DNA damage, the proportion of cells in G2/M increased 1.5-fold with a reciprocal reduction of cells in G1, as did that of cells treated with IR in combination with mTORC1 inhibition (Fig. 10A). In contrast, inhibition of mTORC1/2, with or without IR-mediated DNA damage, resulted in G2/M checkpoint bypass and accumulation of cells mainly in G1. G2/M bypass typically results from reduced expression of CCNE1 and SKP2, which stabilize p27 (38), which was seen here with IR and exacerbated by PP242 inhibition of mTORC1/2 (Fig. 10B). This typically reduces expression of cyclin-dependent kinase 2 (CDK2), as also observed here (Table 2), and impairs cyclin E/CDK2-mediated progression through the G1/S transition.
FIG 10.
mTORC1/2 inhibition promotes accumulation of cells in G1 and slows progression through S phase. (A) SUM149 cells were treated with 2.5 μM PP242, 20 nM RAD001, or DMSO for 2 h prior to IR at 8 Gy, harvested 48 h later, fixed, and stained with PI to assess DNA content. The cell cycle distribution was quantified using FlowJo software. (B) SUM149 cells were treated as described above for 2 h prior to IR at 8 Gy and harvested 24 h later, and equal protein amounts were used for immunoblot analysis. Representative results of 3 studies are shown.
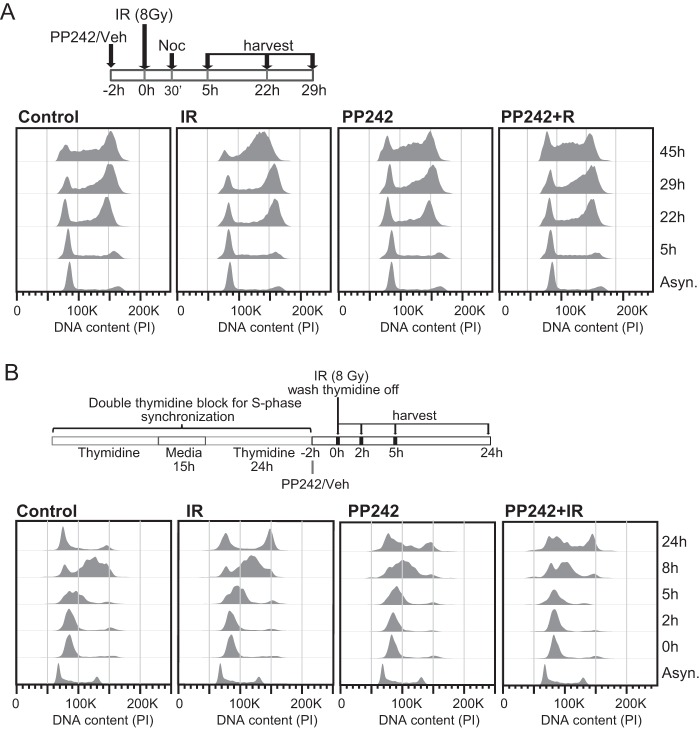
As mTORC1/2 inhibition increases the population of cells in G1, we tested whether with DNA damage mTORC1/2 inhibition also restores G1 checkpoint arrest. Cells were treated with PP242 plus IR, followed by nocodazole to arrest cells in G2 or M phase. Cell cycle profiles indicate that control and IR-treated cells progressed through the cell cycle with the vast majority of cells arrested at M phase by nocodazole treatment, with no induction of the G1 checkpoint (Fig. 11A). Inhibition of mTORC1/2, with or without added DNA damage, strongly increased the number of cells in G1, with some cells remaining in S but not reaching M-phase arrest from nocodazole treatment. Therefore, mTORC1/2 inhibition partially restores G1 checkpoint activation in response to DNA damage.
FIG 11.
mTORC1/2 inhibition partially restores G1 checkpoint arrest. (A) SUM149 cells were treated with PP242 or DMSO 2 h before 8 Gy of IR or mock treatment; 30 min later nocodazole was added, and cells were harvested at the indicated times and fixed for PI staining to assess DNA content. The diagram outlines the experimental design. (B) SUM149 cells were subjected to a double thymidine block. While still under thymidine treatment, cells were treated with PP242 or DMSO as described above for 2 h before IR at 8 Gy, followed by washout of the thymidine block. Cells were harvested and fixed for PI staining at the indicated time points. The diagram indicates the experimental design.
These results also demonstrated that mTORC1/2 inhibition delays progression through S phase in p53-mutated cells. We therefore tested these data by asking whether cells can exit and progress through S phase when mTORC1/2 is inhibited. Cells were arrested in early S phase with a double thymidine block, followed by release in the presence or absence of PP242 and IR (Fig. 11B). Control cells returned to normal cell cycle profiles within 24 h after release, whereas cells treated with IR progressed through the cell cycle with kinetics similar to that of control cells but with substantial accumulation in G2/M. As observed with nocodazole treatment, inhibition of mTORC1/2 caused a delay in progression through S phase and partially bypassed activation of G2/M arrest in response to IR. These results show that mTORC1/2 activity is required for both the regulated expression and translation of mRNAs that are required for activation of early and late G2 cell cycle checkpoints in response to genotoxic DNA damage, as well as for progression through S phase. While mTORC1/2 inhibition did not fully restore the G1 checkpoint in response to genotoxic DNA damage, it did promote accumulation of cells in G1, likely as a result of downregulation of the CCNE/CDK2 complex and stabilization of p27 through the downregulation of SKP2.
DISCUSSION
DDR pathways demonstrate remarkable plasticity, redundancy, and compensatory biochemical circuitry, which underlies cell survival mechanisms (40, 41). While the DDR is a critical target for genotoxic cancer therapies, induced by ionizing radiation or alkylating chemotherapy, it is the compensatory complexity of the DDR program that provides strong antitherapeutic resilience. A hallmark of the DDR in cancer cells is the upregulation of DNA repair factors among the multiple types of DNA repair mechanisms, whether in various base excision repair pathways, nonhomologous end-joining pathways, or others (40). Targeting these different DDR factors individually has at times been successful, as with PARP inhibition in the setting of BRCA-mutated breast and ovarian cancers, but sensitization involves the realignment of repair functions and increased dependency on a single DDR mechanism due to mutation-driven vulnerability. There has therefore been a focus on better understanding higher-level forms of regulation in DDR pathways whereby more effective actionable approaches can be explored.
A number of studies have found that mTOR is more strongly activated and essential for the survival of many human cancers (6, 42, 43). Moreover, inhibition of mTOR also increases the genotoxicity of chemotherapies and radiation therapies through a variety of mechanisms, which is not surprising since mTOR is required for cell growth, proliferation, and survival (6, 44). However, there has been only a poor understanding of how both mTOR complexes are involved in protecting against genotoxic DNA damage. It is now appreciated that mTOR acts on specific genes and functions to promote genomic integrity, such as transcription of FANCD2, a key component of the DDR machinery (12, 45). Gene ablation of mTOR, which blocks both mTORC complexes, enhances genotoxic sensitivity and greatly reduces FANC2 expression (12, 45). As shown in our study, mTORC1/2 activity is actually required for expression (both transcriptional and translational) of many DDR factors, in addition to survival factors. Thus, in addition to FANC2, many DNA repair polymerases and other DNA repair factors are increased in expression as a result of increased mTORC1 and -2 activity. Studies have previously shown that mTOR is also required for deoxynucleoside triphosphate (dNTP) production and DNA synthesis, in part through mTORC1 stimulation of cap-dependent mRNA translation of ribonucleotide reductase subunits (12, 46). Inhibition of mTORC1 enhances genotoxic sensitivity in part through this mechanism (12, 46). Previous studies in yeast and mammalian cells implicated mTORC2 activity in the maintenance of genome stability involving checkpoint kinases CHK1 and CHK2 (8, 9, 11). Our results support this, further demonstrating that inhibition of both mTORC1 and mTORC2 is required to prevent DNA repair following genotoxic DNA damage, consistent with persistent CHK2 phosphorylation and increased cancer cell killing. Thus, both mTOR complexes 1 and 2 are required to coordinate and integrate DDR pathways through the combined reprogramming of transcription and translation at a genome-wide level.
mTOR is therefore involved in the integrated and coordinated responses between DNA damage and cell cycle control, including the inhibition of cell cycling (47, 48), and the activity of the ATM/ATR-CHK1/CHK2-p53 axis (40, 41). Studies have shown specificity in mTOR complex function in this regard. For instance, mTORC2 but not mTORC1 was shown to regulate CHK1 following DNA damage (11), with increased mTORC2 activity associated with increased genotoxic resistance in glioblastoma cells (49). A key feature of both mTORC1 and mTORC2 activity in genotoxic DNA damage is the status of p53. While mTOR is involved in DDR signaling, its activity is ultimately downregulated in nontransformed cells by DNA damage through the action of p53, a DNA damage sensor, which stimulates activation of AMP-activated protein kinase (AMPK) by sestrins 1 and 2 (15, 16), and acts as an inhibitor of mTOR and protein synthesis (50). The AMPK-mTOR node is yet another regulatory point by which mTORC1/2 functions, as AMPK regulates a variety of transcription factors that are involved in cell stress, glucose metabolism, and mitochondrial biogenesis functions and consequently enhances genotoxicity to chemotherapeutics and radiation (50).
Our results suggest an explanation for the disappointing clinical results of mTORC1 inhibitors when combined with conventional DNA genotoxic chemotherapy, and they indicate a strategy for more effective utilization of ATP site mTOR inhibitors. The demonstration that that inhibition of mTORC1/2 collectively impairs both transcription and translation of a subset of well-established genes that are essential components of DDR and cell cycle function, including activation of ATR/CHK1 responses, induction of ATM and DNA-PK signaling, DNA repair, resolution of DNA damage, and cell cycle checkpoint control, indicates that inhibition of mTORC1/2 inhibitors will be expected to be most efficacious when combined with DNA-damaging genotoxic chemotherapy and radiation therapy.
MATERIALS AND METHODS
Cell culture.
SUM149 inflammatory breast cancer (IBC) cells were provided by Stephen Ethier (Karmanos Cancer Institute, Wayne State University, Detroit, MI) and grown in Ham's F-12 medium supplemented with 5% fetal bovine serum (FBS), 1 mg/ml 1-hydrocortisone, 5 μg/ml 1-gentamicin, 5 μg/ml insulin, and 10 μg/ml epidermal growth factor (EGF).
Clonogenic cell survival assays.
Cells were seeded in triplicate into 10-cm plates in a range of 102 to 105 cells/plate according to the test condition and different cell lines. For IR experiments, a single dose of gamma irradiation was applied once cells were attached (24 h). Cells were cultured for up to 14 days. Colonies were fixed in 70% methanol and stained with crystal violet. All colonies of 50 cells or greater were counted in quantitative assays. The survival fraction (SF) was estimated according to the following formula: SF = number of colonies formed under test condition/(number of cells seeded × plating efficiency of control group).
Caspase-3/7 assay.
Five thousand SUM149 cells/well were seeded in 96-well white assay plates in 100 μl of Ham's F-12 medium and treated with dimethyl sulfoxide (DMSO), PP242, or RAD001 for 48 h. Irradiated samples were treated with a single fraction of 8 Gy at 2 h after drug addition, and caspase-3/7 cleavage was measured after 48 h using the Promega Caspase-Glo 3/7 assay systems (G8091) according to the manufacturer's instructions. The luminescence of each sample was measured using the SpectraMax luminometer (Molecular Devices). Assays were performed in triplicate, and results are reported as mean ± standard error of the mean (SEM).
Flow cytometry for cell cycle analysis and quantification of γH2AX and phospho-H3 levels.
For cell cycle analysis, treated cells were collected by trypsinization, washed with phosphate-buffered saline (PBS), fixed with ice-cold 70% ethanol, and stored at 4°C until time of analysis. Fixed cells were washed with PBS plus 2% FBS and incubated in a solution containing 0.2 mg/ml RNase A and 20 μg/ml propidium iodide (PI). For γH2AX quantification, treated cells were collected by trypsinization, followed by processing and staining according to the manufacturer's instructions for the H2AX phosphorylation kit (Upstate), followed by incubation in propidium iodide as described above in order to determine DNA content. For phospho-H3 labeling, treated cells were processed and labeled according to the instructions for the FlowCellect bivariate cell cycle kit for G2/M analysis (Millipore). γH2AX-decorated breaks were quantified from 6 images for each condition selected at random and containing at least 50 cells. All foci with distinct punctate staining were scored at a magnification of ×63 by focusing in and out of the plane. Time zero represents cells prior to IR or etoposide treatment.
Cell cycle synchronization.
The nocodazole treatment protocol was adapted from a previous report (51). Cells were treated with PP242 or vehicle 2 h before irradiation with a single 8-Gy dose. At 30 min after irradiation, 50 ng/ml nocodazole was added to the culture, and cells were collected by trypsinization at the indicated time points and fixed in ice-cold 70% ethanol for cell cycle analysis using propidium iodide staining and fluorescence-activated cell sorting (FACS) analysis as described above. In order to synchronize cells in S phase, cells were subjected to a double thymidine treatment. Briefly, growing cells were incubated with 2 mM thymidine for 24 h, followed by washing and replacing with fresh medium for 18 h and incubation for an additional 24 h with thymidine before treating with PP242 or vehicle control. At 2 hours after drug addition, cells were irradiated, washed three times with Hanks balanced salt solution (HBSS), and harvested at the indicated time points for cell cycle analysis using propidium iodide staining and FACS analysis as described above.
Comet assays.
Cells treated with the indicated drug/irradiation protocols were subjected to alkaline comet assays as directed by the manufacturer (Trevigen Inc.). Briefly, treated cells were trypsinized, washed with Ca2+- and Mg2+-free PBS, counted, and mixed with low-melting-point agarose before being placed onto slides. Cells were lysed with the provided lysis solution, immersed in alkaline unwinding solution (300 mM NaOH, 1 mM EDTA), and then electroporated in alkaline buffer (300 mM NaOH, 1 mM EDTA) for 1 h. Electroporated samples were stained with 1× SYBR Gold (Life Technologies) and allowed to dry before photographing with an immunofluorescence microscope. At least 10 images per condition were taken and analyzed by using the Open Comet ImageJ plug-in. Data analysis was performed using GraphPad Prism.
Polysome fractionation and mRNA Isolation.
Polysome isolation was performed by separation of ribosome-bound mRNAs via sucrose gradient centrifugation as previously described (52). Beckman Ultra-Clear centrifuge tubes were loaded with 5.5 ml of 50% sucrose in low-salt buffer (LSB) (200 mM Tris-HCl [pH 7.4] in diethyl pyrocarbonate [DEPC] H2O, 100 mM NaCl, and 30 mM MgCl2) with 1:1,000 RNasin (Fermentas) and 100 μg/ml cycloheximide (CHX) in ethanol. Columns were layered with 5.5 ml of 15% sucrose-LSB with RNasin and CHX and incubated at 4°C horizontally overnight. Medium was removed from cell cultures and replaced with medium containing 100 μg/ml CHX, and cells were incubated at 37°C for 15 min to halt protein synthesis and trypsinized in trypsin-EDTA containing 100 μg/ml CHX. Cells were washed twice in PBS containing CHX, RNasin, and Roche Complete EDTA-free protease inhibitor tablet and lysed in LSB with CHX and RNasin. Lysates were incubated on ice for 3 min before addition of Triton detergent buffer (1.2% Triton N-100 and 0.2 M sucrose in LSB) and homogenization using a Dounce homogenizer. Samples were transferred to cold sterile Eppendorf centrifuge tubes and centrifuged at 13,000 rpm for 10 min at 4°C. Supernatants were transferred to centrifuge tubes containing 100 μl heparin solution (10 mg/ml heparin and 1.5 M NaCl in LSB) with RNasin and CHX and layered onto sucrose gradients. Gradients were ultracentrifuged at 36,000 rpm at 4°C for 2 h and fractionated on an ISCO fractionator. Samples were collected into tubes containing 20 μl RNase-free 0.5 M EDTA and kept on ice. Fractions were pooled based on their relative rates of translation, with fractions containing four or more ribosomes considered heavily translated and used for gene chip analysis. RNA from pooled fractions was purified using the RNeasy minikit (Qiagen). RNA quality was examined by Bioanalyzer (Agilent Technologies).
Animal tumor model.
All studies were approved by the NYU School of Medicine Institutional Animal Care and Use Committee (IACUC) and conducted in accordance with IACUC guidelines. Six- to 8-week-old female NCR nude mice (Taconic) were caged in groups of four or fewer and fed a diet of animal chow and water ad libitum. SUM149 tumor cells (2 × 10⁶ cells) were injected subcutaneously (s.c.) into the right posterior fourth mammary fat pad. When tumors grew to a mean volume of 150 mm3, the mice were randomized to treatment groups (8 mice per group). At time zero, treatment was begun with RAD001 (2.5 mg/kg) or PP242 (100 mg/kg) alone or in combination with IR as indicated. Drug was administered daily by oral gavage before commencing radiotherapy. Both RAD001 and PP242 were delivered by oral gavage once daily Monday to Friday for 4 weeks; control mice received the vehicle alone. Mice were treated with 3 once-daily fractions of 8 Gy delivered on days 3 to 5. Irradiation was performed using a Varian Linac 2300 linear accelerator at a dose rate of 4 Gy/min with animals restrained to allow exposure of the tumor while shielding of the rest of the body. To obtain a tumor growth curve, perpendicular diameter measurements of each tumor were done every 2 to 3 days with calipers, and volumes were calculated using the formula (π/6 × length × width2). Drug treatment was continued for 4 weeks, and tumors were followed individually until they measured greater than 600 mm3. Tumors that failed to regrow were followed for 90 days after treatment. The mean growth delay for each treatment group was calculated as the number of days for the mean of the treated tumors to grow to 800 mm3 minus the number of days for the mean of the control group to reach the same size. Each animal study was conducted in accordance with the principles and procedures outlined in the NIH Guide for the Care and Use of Animals under an IACUC-approved protocol.
Antibodies and immunoblot analysis.
Mouse monoclonal anti-eIF4A antibody was provided by W. Merrick (Case Western Reserve University, Cleveland, OH). Horseradish peroxidase (HRP)-conjugated secondary antibodies were from GE Healthcare. All other antibodies were from Cell Signaling Technology. An enhanced chemiluminescence (ECL) system (Amersham) was used for detection. Following treatments, cells were washed twice in ice-cold PBS and lysed in radioimmunoprecipitation assay (RIPA) buffer (150 mM NaCl, 50 mM Tris-HCl [pH 8.0], 1% NP-40, 0.5% sodium deoxycholate, 0.1% SDS, 1 mM EDTA, 1× Halt phosphatase inhibitor cocktail [Thermo Scientific], and Complete protease inhibitor cocktail [Roche]) at 4°C). RIPA lysates were clarified by centrifugation at 13,000 × g for 10 min and protein concentrations determined with the DC protein assay (Bio-Rad, Hercules, CA). To determine the total levels and phosphorylation status of specific proteins, equal amounts of protein were resolved by SDS-PAGE and analyzed by protein immunoblotting with specific antibodies as indicated. The phosphorylation status of most proteins was determined by first immunoblotting the membrane with phospho-specific antibody and then stripping the membranes using Restore Western blot stripping buffer (Pierce), followed by reprobing the membranes with non-phospho-specific antibodies. Representative blots were selected from a minimum of three experimental replicates.
Microarrays and data analysis.
Purified mRNAs (50 ng) from total or polysome-associated fractions were processed using the GeneChip WT Plus reagent kit and hybridized to human transcriptome array 2.0 chips from Affymetrix according to the manufacturer's instructions. Affymetrix chips were processed by the NYU School of Medicine Genome Technology Core and analyzed through the NYU School of Medicine Bioinformatics Core. Gene-level probe set summaries of microarray data were obtained using the GCCN and SST transformation algorithm, RMA background correction, and quantile normalization provided in Expression Console software, version 1.4.1 (Affymetrix). Control probe sets and probe sets lacking mRNA accession tags were removed from further analysis. To quantify translational efficiency, the difference in log2 intensity between matched polysomal RNA and total RNA was determined. To examine differences in transcription and translation, total RNA and polysome RNA were quantile normalized separately. Statistical analysis was performed using the limma R package (53).
[35S]methionine incorporation assay.
Cells were incubated with 20 μCi of 35S-labeled amino acids/ml (Easytag Express protein labeling mix; Dupont/NEN) in methionine-free Dulbecco's modified Eagle's medium (DMEM) for 1 h, washed twice with ice-cold phosphate-buffered saline (PBS), and lysed by incubation in 0.5% NP-40 lysis buffer (0.5% NP-40, 50 mM HEPES [pH 7.0], 250 mM NaCl, 2 mM EDTA, 1× Halt phosphatase inhibitor cocktail [Thermo Scientific], and Complete protease inhibitor cocktail [Roche]) at 4°C for 10 min. Lysates were clarified by centrifugation for 10 min at 13,000 × g. Specific activity of methionine incorporation was determined by trichloroacetic acid precipitation onto GF/C filters and liquid scintillation counting (54).
Real-time qPCR.
cDNA was generated using the GoScript reverse transcriptase kit (Promega) as suggested by the manufacturer and used as a template for quantitative PCR (qPCR). PCRs were carried out using the SYBR green JumpStart Taq ReadyMix (Sigma) and the indicated primers using the Applied Biosystems 7500 Fast real-time PCR system. mRNA changes were quantified using the ΔΔCT method with GAPDH (glyceraldehyde-3-phosphate dehydrogenase) and EEF2 mRNAs as internal controls (55). Primer sequences used for the reactions are available upon request.
Immunofluorescence.
Cells grown in multiwell Teflon-coated glass slides (Polysciences Inc., Washington PA) were washed twice with PBS, followed by fixation with 4% paraformaldehyde in PBS. Cells were then permeabilized by incubation in 0.25% Triton-X in PBS and blocked in 3% BSA, followed by incubation by indicated primary antibodies overnight at 4°C, washing 3 times in PBS, and incubation for 1 h with fluorescein isothiocyanate (FITC)- or Texas Red-conjugated secondary antibodies (Jackson ImmunoResearch). Cells were mounted using Vectashield mounting medium with DAPI (4′,6′-diamidino-2-phenylindole) (Vector Laboratories). Image acquisition was performed by confocal microscopy using a Zeiss Axiophot microscope.
Statistical analysis.
Unpaired t tests or two-way analysis of variance (ANOVA) tests were used when applicable to determine significance. Data were analyzed using Prism 6.0f. Minimum significant values were considered to be a P value of <0.05 or as noted.
Accession number(s).
The main GEO accession number for the microarray is GSE92598.
ACKNOWLEDGMENTS
We thank B. Dinardo and L. Droms for technical support.
This work was supported by NIH grants R01CA178509 and R24OD018339 (R.J.S.) and R21CA156081 (D.S.) and by Breast Cancer Research Foundation grant 16-A0-00-003618 BCRF, Avon Foundation for Women grant 02-2014-075, and the Inflammatory Breast Cancer Research Foundation (R.J.S.). Flow cytometry and whole-genome mRNA/translation analyses were carried out by NYU core facilities supported in part by NIH CCSG grant P30 CA016087.
D.S. designed the study, collected and analyzed data, and prepared the manuscript. A.E. collected and analyzed data. R.A., E.C., and V.V. collected data, and J.W. analyzed data. R.J.S. designed the study, analyzed data, and prepared the manuscript.
We declare no competing interests.
REFERENCES
- 1.Dancey J. 2010. mTOR signaling and drug development in cancer. Nat Rev Clin Oncol 7:209–219. doi: 10.1038/nrclinonc.2010.21. [DOI] [PubMed] [Google Scholar]
- 2.Sengupta S, Peterson TR, Sabatini DM. 2010. Regulation of the mTOR complex 1 pathway by nutrients, growth factors, and stress. Mol Cell 40:310–322. doi: 10.1016/j.molcel.2010.09.026. [DOI] [PMC free article] [PubMed] [Google Scholar]
- 3.Laplante M, Sabatini DM. 2012. mTOR signaling in growth control and disease. Cell 149:274–293. doi: 10.1016/j.cell.2012.03.017. [DOI] [PMC free article] [PubMed] [Google Scholar]
- 4.Sabatini DM. 2006. mTOR and cancer: insights into a complex relationship. Nat Rev Cancer 6:729–734. doi: 10.1038/nrc1974. [DOI] [PubMed] [Google Scholar]
- 5.Sonenberg N, Hinnebusch AG. 2009. Regulation of translation initiation in eukaryotes: mechanisms and biological targets. Cell 136:731–745. doi: 10.1016/j.cell.2009.01.042. [DOI] [PMC free article] [PubMed] [Google Scholar]
- 6.Zoncu R, Efeyan A, Sabatini DM. 2011. mTOR: from growth signal integration to cancer, diabetes and ageing. Nat Rev Mol Cell Biol 12:21–35. doi: 10.1038/nrm3025. [DOI] [PMC free article] [PubMed] [Google Scholar]
- 7.Schonbrun M, Laor D, Lopez-Maury L, Bahler J, Kupiec M, Weisman R. 2009. TOR complex 2 controls gene silencing, telomere length maintenance, and survival under DNA-damaging conditions. Mol Cell Biol 29:4584–4594. doi: 10.1128/MCB.01879-08. [DOI] [PMC free article] [PubMed] [Google Scholar]
- 8.Schonbrun M, Kolesnikov M, Kupiec M, Weisman R. 2013. TORC2 is required to maintain genome stability during S phase in fission yeast. J Biol Chem 288:19649–19660. doi: 10.1074/jbc.M113.464974. [DOI] [PMC free article] [PubMed] [Google Scholar]
- 9.Shimada K, Filipuzzi I, Stahl M, Helliwell SB, Studer C, Hoepfner D, Seeber A, Loewith R, Movva NR, Gasser SM. 2013. TORC2 signaling pathway guarantees genome stability in the face of DNA strand breaks. Mol Cell 51:829–839. doi: 10.1016/j.molcel.2013.08.019. [DOI] [PubMed] [Google Scholar]
- 10.Beuvink I, Boulay A, Fumagalli S, Zilbermann F, Ruetz S, O'Reilly T, Natt F, Hall J, Lane HA, Thomas G. 2005. The mTOR inhibitor RAD001 sensitizes tumor cells to DNA-damaged induced apoptosis through inhibition of p21 translation. Cell 120:747–759. doi: 10.1016/j.cell.2004.12.040. [DOI] [PubMed] [Google Scholar]
- 11.Selvarajah J, Elia A, Carroll VA, Moumen A. 2015. DNA damage-induced S and G2/M cell cycle arrest requires mTORC2-dependent regulation of Chk1. Oncotarget 6:427–440. [DOI] [PMC free article] [PubMed] [Google Scholar]
- 12.Shen C, Oswald D, Phelps D, Cam H, Pelloski CE, Pang Q, Houghton PJ. 2013. Regulation of FANCD2 by the mTOR pathway contributes to the resistance of cancer cells to DNA double-strand breaks. Cancer Res 73:3393–3401. doi: 10.1158/0008-5472.CAN-12-4282. [DOI] [PMC free article] [PubMed] [Google Scholar]
- 13.Guo F, Li J, Du W, Zhang S, O'Connor M, Thomas G, Kozma S, Zingarelli B, Pang Q, Zheng Y. 2013. mTOR regulates DNA damage response through NF-kappaB-mediated FANCD2 pathway in hematopoietic cells. Leukemia 27:2040–2046. doi: 10.1038/leu.2013.93. [DOI] [PMC free article] [PubMed] [Google Scholar]
- 14.Cam M, Bid HK, Xiao L, Zambetti GP, Houghton PJ, Cam H. 2014. p53/TAp63 and AKT regulate mammalian target of rapamycin complex 1 (mTORC1) signaling through two independent parallel pathways in the presence of DNA damage. J Biol Chem 289:4083–4094. doi: 10.1074/jbc.M113.530303. [DOI] [PMC free article] [PubMed] [Google Scholar]
- 15.Budanov AV, Karin M. 2008. p53 target genes sestrin1 and sestrin2 connect genotoxic stress and mTOR signaling. Cell 134:451–460. doi: 10.1016/j.cell.2008.06.028. [DOI] [PMC free article] [PubMed] [Google Scholar]
- 16.Braunstein S, Badura ML, Xi Q, Formenti SC, Schneider RJ. 2009. Regulation of protein synthesis by ionizing radiation. Mol Cell Biol 29:5645–5656. doi: 10.1128/MCB.00711-09. [DOI] [PMC free article] [PubMed] [Google Scholar]
- 17.Woods NT, Mesquita RD, Sweet M, Carvalho MA, Li X, Liu Y, Nguyen H, Thomas CE, Iversen ES Jr, Marsillac S, Karchin R, Koomen J, Monteiro AN. 2012. Charting the landscape of tandem BRCT domain-mediated protein interactions. Sci Signal 5:rs6. [DOI] [PMC free article] [PubMed] [Google Scholar]
- 18.Im-aram A, Farrand L, Bae SM, Song G, Song YS, Han JY, Tsang BK. 2013. The mTORC2 component rictor contributes to cisplatin resistance in human ovarian cancer cells. PLoS One 8:e75455. doi: 10.1371/journal.pone.0075455. [DOI] [PMC free article] [PubMed] [Google Scholar]
- 19.Li H, Lin J, Wang X, Yao G, Wang L, Zheng H, Yang C, Jia C, Liu A, Bai X. 2012. Targeting of mTORC2 prevents cell migration and promotes apoptosis in breast cancer. Breast Cancer Res Treat 134:1057–1066. doi: 10.1007/s10549-012-2036-2. [DOI] [PubMed] [Google Scholar]
- 20.Li L, Sun Y, Liu J, Wu X, Chen L, Ma L, Wu P. 2015. Histone deacetylase inhibitor sodium butyrate suppresses DNA double strand break repair induced by etoposide more effectively in MCF-7 cells than in HEK293 cells. BMC Biochem 16:2. doi: 10.1186/s12858-014-0030-5. [DOI] [PMC free article] [PubMed] [Google Scholar]
- 21.Benjamin D, Colombi M, Moroni C, Hall MN. 2011. Rapamycin passes the torch: a new generation of mTOR inhibitors. Nat Rev Drug Discov 10:868–880. doi: 10.1038/nrd3531. [DOI] [PubMed] [Google Scholar]
- 22.Feldman ME, Apsel B, Uotila A, Loewith R, Knight ZA, Ruggero D, Shokat KM. 2009. Active-site inhibitors of mTOR target rapamycin-resistant outputs of mTORC1 and mTORC2. PLoS Biol 7:e38. doi: 10.1371/journal.pbio.1000038. [DOI] [PMC free article] [PubMed] [Google Scholar]
- 23.Yu K, Toral-Barza L, Shi C, Zhang WG, Lucas J, Shor B, Kim J, Verheijen J, Curran K, Malwitz DJ, Cole DC, Ellingboe J, Ayral-Kaloustian S, Mansour TS, Gibbons JJ, Abraham RT, Nowak P, Zask A. 2009. Biochemical, cellular, and in vivo activity of novel ATP-competitive and selective inhibitors of the mammalian target of rapamycin. Cancer Res 69:6232–6240. doi: 10.1158/0008-5472.CAN-09-0299. [DOI] [PubMed] [Google Scholar]
- 24.Braunstein S, Formenti SC, Schneider RJ. 2008. Acquisition of stable inducible up-regulation of nuclear factor-kappaB by tumor necrosis factor exposure confers increased radiation resistance without increased transformation in breast cancer cells. Mol Cancer Res 6:78–88. doi: 10.1158/1541-7786.MCR-07-0339. [DOI] [PubMed] [Google Scholar]
- 25.Silvera D, Schneider RJ. 2009. Inflammatory breast cancer cells are constitutively adapted to hypoxia. Cell Cycle 8:3091–3096. doi: 10.4161/cc.8.19.9637. [DOI] [PubMed] [Google Scholar]
- 26.Apsel B, Blair JA, Gonzalez B, Nazif TM, Feldman ME, Aizenstein B, Hoffman R, Williams RL, Shokat KM, Knight ZA. 2008. Targeted polypharmacology: discovery of dual inhibitors of tyrosine and phosphoinositide kinases. Nat Chem Biol 4:691–699. doi: 10.1038/nchembio.117. [DOI] [PMC free article] [PubMed] [Google Scholar]
- 27.Liu Q, Kirubakaran S, Hur W, Niepel M, Westover K, Thoreen CC, Wang J, Ni J, Patricelli MP, Vogel K, Riddle S, Waller DL, Traynor R, Sanda T, Zhao Z, Kang SA, Zhao J, Look AT, Sorger PK, Sabatini DM, Gray NS. 2012. Kinome-wide selectivity profiling of ATP-competitive mammalian target of rapamycin (mTOR) inhibitors and characterization of their binding kinetics. J Biol Chem 287:9742–9752. doi: 10.1074/jbc.M111.304485. [DOI] [PMC free article] [PubMed] [Google Scholar]
- 28.Rogakou EP, Pilch DR, Orr AH, Ivanova VS, Bonner WM. 1998. DNA double-stranded breaks induce histone H2AX phosphorylation on serine 139. J Biol Chem 273:5858–5868. doi: 10.1074/jbc.273.10.5858. [DOI] [PubMed] [Google Scholar]
- 29.Wang H, Wang M, Wang H, Bocker W, Iliakis G. 2005. Complex H2AX phosphorylation patterns by multiple kinases including ATM and DNA-PK in human cells exposed to ionizing radiation and treated with kinase inhibitors. J Cell Physiol 202:492–502. doi: 10.1002/jcp.20141. [DOI] [PubMed] [Google Scholar]
- 30.Ward IM, Chen J. 2001. Histone H2AX is phosphorylated in an ATR-dependent manner in response to replicational stress. J Biol Chem 276:47759–47762. [DOI] [PubMed] [Google Scholar]
- 31.Syljuasen RG, Sorensen CS, Hansen LT, Fugger K, Lundin C, Johansson F, Helleday T, Sehested M, Lukas J, Bartek J. 2005. Inhibition of human Chk1 causes increased initiation of DNA replication, phosphorylation of ATR targets, and DNA breakage. Mol Cell Biol 25:3553–3562. doi: 10.1128/MCB.25.9.3553-3562.2005. [DOI] [PMC free article] [PubMed] [Google Scholar]
- 32.Kurose A, Tanaka T, Huang X, Traganos F, Darzynkiewicz Z. 2006. Synchronization in the cell cycle by inhibitors of DNA replication induces histone H2AX phosphorylation: an indication of DNA damage. Cell Prolif 39:231–240. doi: 10.1111/j.1365-2184.2006.00380.x. [DOI] [PMC free article] [PubMed] [Google Scholar]
- 33.Matsuoka S, Rotman G, Ogawa A, Shiloh Y, Tamai K, Elledge SJ. 2000. Ataxia telangiectasia-mutated phosphorylates Chk2 in vivo and in vitro. Proc Natl Acad Sci U S A 97:10389–10394. doi: 10.1073/pnas.190030497. [DOI] [PMC free article] [PubMed] [Google Scholar]
- 34.Chan DW, Chen BP, Prithivirajsingh S, Kurimasa A, Story MD, Qin J, Chen DJ. 2002. Autophosphorylation of the DNA-dependent protein kinase catalytic subunit is required for rejoining of DNA double-strand breaks. Genes Dev 16:2333–2338. doi: 10.1101/gad.1015202. [DOI] [PMC free article] [PubMed] [Google Scholar]
- 35.Collins AR. 2004. The comet assay for DNA damage and repair: principles, applications, and limitations. Mol Biotechnol 26:249–261. doi: 10.1385/MB:26:3:249. [DOI] [PubMed] [Google Scholar]
- 36.Dowling RJ, Topisirovic I, Alain T, Bidinosti M, Fonseca BD, Petroulakis E, Wang X, Larsson O, Selvaraj A, Liu Y, Kozma SC, Thomas G, Sonenberg N. 2010. mTORC1-mediated cell proliferation, but not cell growth, controlled by the 4E-BPs. Science 328:1172–1176. doi: 10.1126/science.1187532. [DOI] [PMC free article] [PubMed] [Google Scholar]
- 37.Gao N, Flynn DC, Zhang Z, Zhong XS, Walker V, Liu KJ, Shi X, Jiang BH. 2004. G1 cell cycle progression and the expression of G1 cyclins are regulated by PI3K/AKT/mTOR/p70S6K1 signaling in human ovarian cancer cells. Am J Physiol Cell Physiol 287:C281–291. doi: 10.1152/ajpcell.00422.2003. [DOI] [PubMed] [Google Scholar]
- 38.Panier S, Durocher D. 2013. Push back to respond better: regulatory inhibition of the DNA double-strand break response. Nat Rev Mol Cell Biol 14:661–672. doi: 10.1038/nrm3659. [DOI] [PubMed] [Google Scholar]
- 39.Wasielewski M, Elstrodt F, Klijn JG, Berns EM, Schutte M. 2006. Thirteen new p53 gene mutants identified among 41 human breast cancer cell lines. Breast Cancer Res Treat 99:97–101. doi: 10.1007/s10549-006-9186-z. [DOI] [PubMed] [Google Scholar]
- 40.Curtin NJ. 2012. DNA repair dysregulation from cancer driver to therapeutic target. Nat Rev Cancer 12:801–817. doi: 10.1038/nrc3399. [DOI] [PubMed] [Google Scholar]
- 41.Roos WP, Thomas AD, Kaina B. 2016. DNA damage and the balance between survival and death in cancer biology. Nat Rev Cancer 16:20–33. doi: 10.1038/nrc.2015.2. [DOI] [PubMed] [Google Scholar]
- 42.Silvera D, Formenti SC, Schneider RJ. 2010. Translational control in cancer. Nat Rev Cancer 10:254–266. doi: 10.1038/nrc2824. [DOI] [PubMed] [Google Scholar]
- 43.Hsieh AC, Liu Y, Edlind MP, Ingolia NT, Janes MR, Sher A, Shi EY, Stumpf CR, Christensen C, Bonham MJ, Wang S, Ren P, Martin M, Jessen K, Feldman ME, Weissman JS, Shokat KM, Rommel C, Ruggero D. 2012. The translational landscape of mTOR signalling steers cancer initiation and metastasis. Nature 485:55–61. doi: 10.1038/nature10912. [DOI] [PMC free article] [PubMed] [Google Scholar]
- 44.Cornu M, Albert V, Hall MN. 2013. mTOR in aging, metabolism, and cancer. Curr Opin Genet Dev 23:53–62. doi: 10.1016/j.gde.2012.12.005. [DOI] [PubMed] [Google Scholar]
- 45.Guo F, Li J, Zhang S, Du W, Amarachintha S, Sipple J, Phelan J, Grimes HL, Zheng Y, Pang Q. 2014. mTOR kinase inhibitor sensitizes T-cell lymphoblastic leukemia for chemotherapy-induced DNA damage via suppressing FANCD2 expression. Leukemia 28:203–206. doi: 10.1038/leu.2013.215. [DOI] [PMC free article] [PubMed] [Google Scholar]
- 46.Shen C, Lancaster CS, Shi B, Guo H, Thimmaiah P, Bjornsti MA. 2007. TOR signaling is a determinant of cell survival in response to DNA damage. Mol Cell Biol 27:7007–7017. doi: 10.1128/MCB.00290-07. [DOI] [PMC free article] [PubMed] [Google Scholar]
- 47.Fingar DC, Blenis J. 2004. Target of rapamycin (TOR): an integrator of nutrient and growth factor signals and coordinator of cell growth and cell cycle progression. Oncogene 23:3151–3171. doi: 10.1038/sj.onc.1207542. [DOI] [PubMed] [Google Scholar]
- 48.Richardson CJ, Broenstrup M, Fingar DC, Julich K, Ballif BA, Gygi S, Blenis J. 2004. SKAR is a specific target of S6 kinase 1 in cell growth control. Curr Biol 14:1540–1549. doi: 10.1016/j.cub.2004.08.061. [DOI] [PubMed] [Google Scholar]
- 49.Tanaka K, Babic I, Nathanson D, Akhavan D, Guo D, Gini B, Dang J, Zhu S, Yang H, De Jesus J, Amzajerdi AN, Zhang Y, Dibble CC, Dan H, Rinkenbaugh A, Yong WH, Vinters HV, Gera JF, Cavenee WK, Cloughesy TF, Manning BD, Baldwin AS, Mischel PS. 2011. Oncogenic EGFR signaling activates an mTORC2-NF-kappaB pathway that promotes chemotherapy resistance. Cancer Discov 1:524–538. doi: 10.1158/2159-8290.CD-11-0124. [DOI] [PMC free article] [PubMed] [Google Scholar]
- 50.Sanli T, Steinberg GR, Singh G, Tsakiridis T. 2014. AMP-activated protein kinase (AMPK) beyond metabolism: a novel genomic stress sensor participating in the DNA damage response pathway. Cancer Biol Ther 15:156–169. doi: 10.4161/cbt.26726. [DOI] [PMC free article] [PubMed] [Google Scholar]
- 51.Agami R, Bernards R. 2000. Distinct initiation and maintenance mechanisms cooperate to induce G1 cell cycle arrest in response to DNA damage. Cell 102:55–66. doi: 10.1016/S0092-8674(00)00010-6. [DOI] [PubMed] [Google Scholar]
- 52.Ramirez-Valle F, Braunstein S, Zavadil J, Formenti SC, Schneider RJ. 2008. eIF4GI links nutrient sensing by mTOR to cell proliferation and inhibition of autophagy. J Cell Biol 181:293–307. doi: 10.1083/jcb.200710215. [DOI] [PMC free article] [PubMed] [Google Scholar]
- 53.Ritchie ME, Phipson B, Wu D, Hu Y, Law CW, Shi W, Smyth GK. 2015. limma powers differential expression analyses for RNA-sequencing and microarray studies. Nucleic Acids Res 43:e47. doi: 10.1093/nar/gkv007. [DOI] [PMC free article] [PubMed] [Google Scholar]
- 54.Silvera D, Arju R, Darvishian F, Levine P, Goldberg JG, Hockman T, Formenti SC, Schneider RJ. 2009. Essential role for eIF4GI overexpression in inflammatory breast cancer pathogenesis. Nature Cell Biol 11:903–910. doi: 10.1038/ncb1900. [DOI] [PubMed] [Google Scholar]
- 55.Winer J, Jung CK, Shackel I, Williams PM. 1999. Development and validation of real-time quantitative reverse transcriptase-polymerase chain reaction for monitoring gene expression in cardiac myocytes in vitro. Anal Biochem 270:41–49. doi: 10.1006/abio.1999.4085. [DOI] [PubMed] [Google Scholar]


