

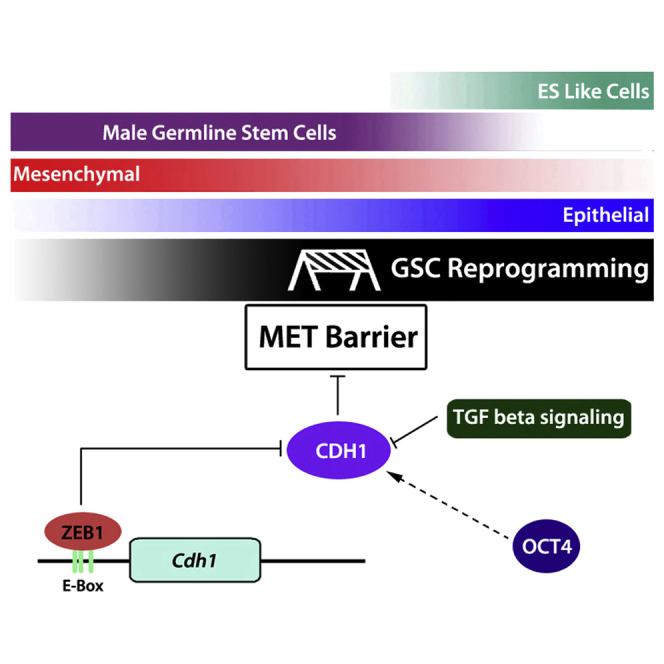
Summary
Cultured spermatogonial stem cells (GSCs) can spontaneously form pluripotent cells in certain culture conditions. However, GSC reprogramming is a rare event that is largely unexplained. We show GSCs have high expression of mesenchymal to epithelial transition (MET) suppressors resulting in a developmental barrier inhibiting GSC reprogramming. Either increasing OCT4 or repressing transforming growth factor β (TGF-β) signaling promotes GSC reprogramming by upregulating CDH1 and boosting MET. Reducing ZEB1 also enhances GSC reprogramming through its direct effect on CDH1. RNA sequencing shows that rare GSCs, identified as CDH1+ after trypsin digestion, are epithelial-like cells. CDH1+ GSCs exhibit enhanced reprogramming and become more prevalent during the course of reprogramming. Our results provide a mechanistic explanation for the spontaneous emergence of pluripotent cells from GSC cultures; namely, rare GSCs upregulate CDH1 and initiate MET, processes normally kept in check by ZEB1 and TGF-β signaling, thereby ensuring germ cells are protected from aberrant acquisition of pluripotency.
Keywords: male germline stem cell, reprogramming, Mesenchymal to epithelial transition, CDH1, ZEB1, TGFb signalling
Graphical Abstract
Highlights
-
•
OCT4 and TGF-β signaling regulate GSC reprogramming by influencing MET
-
•
ZEB1 regulates CDH1 expression and MET by binding to E boxes in the Cdh1 promoter
-
•
MET controlled by CDH1 is a barrier in GSC reprogramming
-
•
GSCs and SSCs with higher CDH1 expression exhibit enhanced reprogramming potential
Dann and colleagues show that GSCs are guarded from pluripotency by ZEB1 and high TGF-β signaling, maintaining GSC's mesenchymal state and constituting a MET barrier. However, rare GSCs exhibit epithelial characteristics, explaining the spontaneous emergence of pluripotent cells. Inhibiting TGF-β signaling, downregulating Zeb1, or isolating rare epithelial GSCs all enhance the reprogramming frequency by boosting GSCs over the MET barrier.
Introduction
A long-standing vision for regenerative medicine has been the possibility of generating cells needed for therapy by inducing differentiation of pluripotent cells. Pluripotent cells are defined by their ability to give rise to all of the cell types that make up the body. Embryonic stem cells (ESCs) are the prototypical pluripotent cell type, derived from the inner cell mass within blastocyst staged embryos. Primordial germ cells (PGCs) can first be detected in the extraembryonic mesoderm just posterior to the definitive primitive streak in mouse at 7 days post coitum (dpc) (Ginsburg et al., 1990). In 1992, it was found that PGCs could reprogram into ESC-like (ESL) cells when cultured with appropriate growth factors including fibroblast growth factor 2 (FGF2), stem cell factor, and leukemia inhibitory factor (LIF) (Matsui et al., 1992, Resnick et al., 1992). The reprogramming potential of PGCs decreases gradually during development between 8.5 and 12.5 dpc, and reprogramming ability is no longer found in the embryonic germline later than 12.5 dpc (Labosky et al., 1994). However, the reprogramming ability is restored in later germline development as evidenced by the ability to derive ESL cells from spermatogonial stem cells (SSCs) (Guan et al., 2006, Kanatsu-Shinohara et al., 2004, Ko et al., 2009, Seandel et al., 2007).
SSCs are the founder cells of spermatogenesis and are located on the basement membrane of the seminiferous tubules. SSCs are unipotent and have the ability to self-renew to maintain a stem cell population or to differentiate to ultimately produce sperm. In 2003, an in vitro mouse SSC culture system was developed (Kanatsu-Shinohara et al., 2003). The cultured SSCs, designated germline stem cells (GSCs), form grape-like clusters in vitro and proliferate in medium containing several cytokines, notably glial cell line-derived neurotrophic factor (GDNF) (Kubota et al., 2004). Importantly, GSCs reinitiate spermatogenesis and produce offspring after transplantation into seminiferous tubules of infertile testes (Kanatsu-Shinohara et al., 2003, Kubota et al., 2004). When GSCs are subjected to suitable in vitro conditions they can spontaneously dedifferentiate into ESL cells without introducing any exogenous factors (see Table S1 for summary; Guan et al., 2006, Kanatsu-Shinohara et al., 2004, Ko et al., 2009, Seandel et al., 2007). ESL cells derived from GSCs are able to contribute to chimera formation, fulfilling this requirement for a bona fide pluripotent cell type (Guan et al., 2006, Ko et al., 2009). ESL cells have been shown to be more similar to ESCs than induced pluripotent stem cells (iPSCs) of somatic origin in terms of gene expression profiles, indicating that ESL cells might be better than iPSCs for therapeutic purposes (Ko et al., 2009). SSC reprogramming as a transcription factor-free reprogramming strategy could be greatly beneficial for clinical applications and could also be a powerful tool for studying the origin of totipotency during development.
Early SSC reprogramming studies relied on visual detection of unpredictable, very rare conversion events wherein a singular, smooth-edged and flattened ESC-like colony would be found and manually removed from the surrounding typical grape-like clusters of GSCs. The first report of such an occurrence was in 2004 by the Shinohara group, who obtained ESL cells from neonatal mouse testis with extremely low frequency (1 in 107 cells). Seandel et al. (2007) used a similar protocol for reprogramming, except that they started with GPR125+ GSCs derived from adult mice and they used inactivated testicular stromal cells as a feeder layer. In contrast to the preceding reports, Ko et al. (2010) established a reprogramming protocol that converted GSCs, derived from adult Oct4-GFP mice, into ESL cells in a more predictable and reproducible manner. A key feature of their approach was that they determined an ideal density to plate cells for reprogramming that was 5- to 10-times lower than the typical density used for maintenance of GSCs, thereby allowing the cells to be cultured for 3–4 weeks without the need for dissociation and passaging.
GSC reprogramming takes place over multiple weeks and the mechanism is largely unknown. Low efficiency and inconsistent ESL cell formation makes it difficult to study the molecular mechanism of GSC reprogramming, knowledge of which is a prerequisite for improving the efficiency. In addition, GSCs do not reprogram to ESL cells when transfected with the four Yamanaka factors typically used in somatic cell reprogramming, suggesting that GSCs exhibit unique properties constituting a barrier to reprogramming (Morimoto et al., 2012). Here, we report that high TGF-β signaling and high ZEB1 expression result in a barrier preventing the needed upregulation of CDH1 for initiation of mesenchymal to epithelial transition (MET) during GSC reprogramming. Epithelial to mesenchymal transition (EMT) and the reverse process of MET are developmental processes whereby polar epithelial cells that typically interact with a basal membrane interconvert to fibroblast-like migratory cells with mesenchymal secretory properties. SSCs are generally not thought of as being either mesenchymal or epithelial but have certain properties of both epithelial cells (CDH1 expression) (Tokuda et al., 2007) and mesenchymal cells (THY1 expression) (Kubota et al., 2003).
In GSC clusters in vitro, and in undifferentiated spermatogonia in vivo, CDH1 is detected in a majority of cells (Fanslow et al., 2014, Tokuda et al., 2007). However, following dissociation of GSC clusters detection of CDH1 by flow cytometry varies depending on the exact method used. CDH1 epitopes are typically sensitive to trypsin digestion, a method commonly used for cell dissociation. We identified a population of rare CDH1+ cells that remain following trypsin digestion (hereafter referred to simply as CDH1+ GSCs). By total RNA sequencing (RNA-seq) analysis of trypsin-digested GSCs we show that CDH1- cells are mesenchymal-like and CDH1+ GSCs are epithelial-like. The presence of a rare population of GSCs with epithelial properties, typified by enhanced CDH1 expression, likely explains the occasional spontaneous emergence of ESL cells that have been observed by others in standard GSC culture conditions in the past.
By focusing our study on understanding the molecular mechanism of GSC reprogramming we identify several key positive and negative regulators of the process and define manipulations that increase the CDH1+ GSC population and promote MET and likewise, formation of ESL cells. First, we show CDH1 is essential for GSC reprogramming. Increasing OCT4 promotes reprogramming by upregulating CDH1 and boosting MET. ZEB1 and TGF-β signaling reduce CDH1 and suppress MET and GSC reprogramming efficiency. During the weeks-long process of reprogramming, CDH1+ GSCs gradually increase and the enhanced reprogramming ability of isolated CDH1+ cells suggests that CDH1+ GSCs are poised in a later stage of MET. In summary, our results suggest that CDH1 upregulation constitutes a MET barrier to SSC spontaneous reprogramming that is controlled by ZEB1 and TGF-β signaling, thereby ensuring germ cells are protected from aberrant acquisition of pluripotency. Instead of relying on transfection of genetic material, we define multiple approaches that lead to improved conversion of mouse GSCs to pluripotency that may accelerate the study of human SSC reprogramming and its clinical applications.
Results
Establishment and Validation of Conditions for Reproducible and Quantifiable GSC Reprogramming
In order to investigate mechanisms of GSC reprogramming we required a quantitative and reproducible assay (Figure S1). In a procedure adapted from Ko et al. (2010), Oct4-GFP GSCs were seeded at low density (Figure 1A) in wells of a 48-well plate and cultured in reprogramming medium (RP medium) without passaging for several weeks. Two weeks after plating, clusters were small (about 5–20 cells) and appeared similar to typical GSC clusters (Figure 1B). At this stage Oct4-GFP expression was heterogeneous and at overall low levels, consistent with what is known about OCT4 expression in GSCs (Dann et al., 2008) (Figure 1B). After 4 weeks GSC clusters often had more than 100 cells; abundant cell death was also observed, consistent with previous findings (Heim et al., 2012). However, in a subset of wells (∼4 out of 100 wells; Table 1) a single colony emerged with typical ESC morphology and unusually high GFP expression in the middle (Figure 1C). Upon trypsinization and transfer of all of the cells of each well to new wells containing standard ESC growth medium (ES medium), which contained LIF but lacked GDNF, the germ cells quickly died without GDNF but ESL cells formed typical ESC colonies and expanded rapidly within 1 week (Figure 1C). For quantitative assessment of reprogramming, reprogramming was defined by this ability of a well of cells to rapidly expand upon dissociation and transfer to a new well containing ES medium.
Figure 1.

GSC Spontaneous Reprogramming and Characterization of ESL Cells
(A–C) Oct4-GFP GSC colony after (A) 3 days, (B) 14 days, or (C) 35 days of culture in RP medium. Insets show Oct4-GFP ESL cells derived from GSC colonies 7 days after transferring from GSC growth medium to ES medium. Scale bars, 150 μm.
(D) RT-PCR analysis of Nanog, Oct4, Eras, Utf1, Esg1, Cripto, and ActinB mRNA from GSC, ESL cells, and ES-D3 cells.
(E) Embryoid body derived from ESL cells. Green color indicates Oct4-GFP expression in (A) to (C), (E) and (H). Scale bar, 150 μm.
(F, G, I, and J) βIII-Tubulin immunostaining of neuron-like (ectodermal) cells derived by ESL cell differentiation (F). Immunofluorescence analysis of ESL-derived embryoid bodies differentiated into mesodermal cells (G, ACTA2), ectodermal cells (I, SOX1) and endodermal cells (J, GATA4) in red, merged with DAPI in blue.
(H) SSEA1 staining (red) in ESL cells.
(K) NANOG, SOX2, OCT4, and TUB1 immunoblotting of lysates from GSC, ESL, and ES-D3 cells.
(L–Q) Immunofluorescence analysis of ESL-derived teratomas differentiated into endodermal cells (L, GATA4), mesodermal cells (M, ACTA2), and ectodermal cells (N, βIII-tubulin) in red, merged with DAPI in blue. Respective negtive control images shown in (O–Q).
Scale bars, 150 μm (E–J and L–Q).
Table 1.
Summary of GSC/SSC Reprogramming Results
| Reprogramming Condition | Cell Backgrounda | No. of Experiments | No. of Wells Cultured | No. of Wells with ESL Cells | ESL Colonies per 100 Wells | |
|---|---|---|---|---|---|---|
| GSCs | RP medium only | OG/DO | 5 | 96 | 4 | 4 |
| WT | 2 | 96 | 3 | |||
| +DMSO control | OG/DO | 4 | 96 | 3 | 3 | |
| WT | 2 | 48 | 1 | |||
| +siRNA control | OG/DO | 6 | 96 | 3 | 3 | |
| WT | 3 | 72 | 2 | |||
| +Dox | OG/DO | 6 | 96 | 14 | 14 | |
| +RepSox | OG/DO | 5 | 96 | 13 | 12 | |
| WT | 2 | 48 | 4 | |||
| +SB431542 | OG/DO | 4 | 84 | 3 | 4 | |
| +Zeb1 siRNA | OG/DO | 6 | 120 | 17 | 13 | |
| WT | 3 | 72 | 8 | |||
| +Zeb2 siRNA | OG/DO | 5 | 84 | 3 | 4 | |
| +Twist2 siRNA | OG/DO | 5 | 84 | 2 | 2 | |
| +Zeb1 siRNA +control siRNA |
OG/DO | 4 | 96 | 12 | 10 | |
| WT | 3 | 72 | 5 | |||
| +Zeb1 siRNA +Cdh1 siRNA |
OG/DO | 4 | 96 | 0 | 0 | |
| WT | 3 | 72 | 0 | |||
| +Dox +Cdh1 siRNA |
OG/DO | 2 | 96 | 0 | 1 | |
| OG/DO | 2 | 96 | 1 | |||
| RP medium only | OG/DO CDH1+/THY1+ |
3 | 88 | 6 | 7 | |
| OG/DO CDH1−/THY1+ |
3 | 96 | 1 | 1 | ||
| Primary testis SSCs | +Zeb1 siRNA | OG | 3 | 72 | 5 | 7 |
| +siRNA control | OG | 3 | 72 | 1 | 1 | |
| +RepSox | OG | 3 | 72 | 4 | 6 | |
| +DMSO control | OG | 3 | 72 | 2 | 3 | |
| RP medium only | OG CDH1+/THY1+ |
4 | 84 | 5 | 6 | |
| OG CDH1−/THY1+ |
4 | 84 | 0 | 0 |
OG/DO, Oct4-GFP/Dox-Oct4; OG, Oct4-GFP; WT, wild-type.
To test whether the ESL cells had the same molecular phenotype as ESCs, we examined expression of pluripotency markers (Figures 1D and 1K). ESL cells expressed Nanog, Oct4, Eras, Utf1, Esg1, and Cripto mRNAs and stained positive for SSEA1, SOX2, and NANOG, but were negative for the SSC marker GFRA1 (Figures 1D, 1H, and S1). Western blotting confirmed NANOG, SOX2, and OCT4 expression in ESL cells (Figure 1K). We then tested the differentiation potential of ESL cells. We showed that ESL cells could be induced to neuroectoderm cells expressing βIII-tubulin, a neuronal marker (Figure 1F) (Gaspard et al., 2009). We also tested whether ESL cells could differentiate into cell types indicative of the three germ layers. We generated differentiated embryoid bodies (Figure 1E) and obtained cardiac beating cells, and cells with expression of ACTA2 (mesoderm, Figure 1G), SOX1 (ectoderm, Figure 1I), and GATA4 (endoderm, Figure 1J). Similar differentiation potential was observed in vivo by transplanting ESL cells into mice to generate teratomas (Figures 1L–1N). Altogether the results validated our procedure for consistently generating ESL cell lines from GSCs and defined a baseline efficiency at which reprogramming occurred (∼4 out of 100 wells; Table 1).
Exogenous OCT4 Promoted GSC Reprogramming by Upregulating CDH1
Although GSCs could reprogram to ESL cells consistently, the frequency was similarly low in our study as in studies by others (about 0.02% of cells plated). Interestingly, the presence of very high Oct4-GFP expression in a cluster of cells correlated with its ability to reprogram to ESL cells. Based on this observation, and the known role for OCT4 in pluripotency, we hypothesized that increasing OCT4 may increase the efficiency of GSC reprogramming. OCT4-inducible GSCs were established from doubly transgenic mice (“Dox-OCT4” and “Oct4-GFP”) to study OCT4 function in GSC reprogramming. Dox-OCT4 transgenic mice expressed exogenous OCT4 in a doxycycline-dependent manner (Hochedlinger et al., 2005) (Figure 2A). In GSCs 1 μg/mL of doxycycline resulted in effective OCT4 overexpression (Figure 2B). Using our 48-well-plate reprogramming assay, we found a reproducible increase in the frequency of reprogramming when GSCs were cultured with doxycycline. This result suggested that OCT4 played a role in promoting GSC reprogramming (Figure 2C and Table 1).
Figure 2.

Doxycycline-Dependent OCT4 Overexpression Promotes GSC Reprogramming
(A) Schematic representation of Dox-Oct4 transgenic mice. The rtTA gene was targeted into the ROSA26 locus under control of the ROSA promoter. A cassette containing the Oct4 cDNA under the control of the doxycycline-responsive promoter was inserted downstream of the collagen locus. SA, splice acceptor; TetOP, tetracycline/doxycycline-responsive operator. Black arrows indicate transcriptional start sites.
(B) OCT4 (top) and TUB1 (bottom) immunoblotting of GSC lysates from Dox-Oct4 homozygous mice treated with different concentrations of doxycycline.
(C) GSC reprogramming efficiency in RP medium after 1 μg/mL doxycycline treatment (n = 96 wells total from six experiments) compared with doxycycline and Cdh1 siRNA co-treatment group (n = 96 wells total from four experiments) and untreated control group (n = 96 wells total from five experiments). ∗p < 0.01, significance between doxycycline-only group and each of the other two groups. The values in the histogram are presented as the means ± SD.
(D) OCT4 (top), CDH1 (middle), and TUB1 (bottom) immunoblotting of cells lysates from homozygotes (+/+), heterozygotes (+/−), and wild-type (−/−) GSCs after 72 hr of doxycycline treatment (1 μg/mL).
(E) qRT-PCR analysis of mesenchymal or epithelial marker expression as indicated. RNA was isolated from Dox-Oct4 homozygotes (+/+), Dox-Oct4 heterozygotes (+/−), and wild-type (−/−) GSCs after 1 μg/mL of doxycycline treatment (72 hr). The values in the histogram are presented as the means ± SD. Mean and SD for three biological replicates from three independent experiments are shown. ∗p < 0.01.
The function of OCT4 in GSC reprogramming is still largely unknown. Interestingly, we noticed that ESL clusters appeared from within the middle of large clusters of GSCs (Figure 1C), indicating that the surrounding environment of cell-to-cell adhesion may influence reprogramming. It is known that CDH1 is required for the maintenance of cell-to-cell contacts in epithelial cells: anti-CDH1 antibodies can disrupt these contacts and induce a mesenchymal phenotype (Imhof et al., 1983). We found CDH1 increased after OCT4 induction (Figure 2D). In the presence of doxycycline, the highest levels of OCT4 were obtained from Dox-Oct4 homozygous mice, intermediate levels in Dox-Oct4 heterozygous mice, and low levels in wild-type mice. Accordingly, CDH1 protein increased as the amount of OCT4 increased, suggesting that Cdh1 was a downstream gene of OCT4 and that OCT4's effect on reprogramming was mediated by CDH1. Indeed, OCT4 overexpression failed to induce GSC reprogramming when CDH1 was downregulated, indicating that the effect of OCT4 on reprogramming was dependent on CDH1 (Figure 2C and Table 1).
CDH1 is not only a surface marker on a subset of spermatogonia/SSCs but is also a typical marker of epithelial cells. We examined other epithelial markers including desmoplakin (Dsp) and crumbs family member 3 (Crb3) and found that they were also upregulated along with OCT4 (Figure 2E). Furthermore, cadherin 2 (Cdh2, also known as N-cadherin), a mesenchymal marker, was downregulated after OCT4 overexpression (Figure 2E). Increased epithelial and decreased mesenchymal markers indicated that GSCs may acquire properties of epithelial cells through MET during OCT4 induction. These results suggested that OCT4 promoted reprogramming in part by upregulating CDH1 and enabling GSCs to undergo MET.
MET Barrier Mediated by TGF-β Signaling Inhibits GSC Reprogramming
Recent studies have shown that conversion of fibroblasts into an intermediate epithelial cell is crucial during initiation of reprogramming (Li et al., 2010, Samavarchi-Tehrani et al., 2010). This phenotypic change occurs through induction of MET and is consistent with the fact that ESCs from the inner cell mass of the blastocyst are epithelial-like (Ocana and Nieto, 2010). It is known that SSC-containing populations of undifferentiated spermatogonia express both mesenchymal (THY1) and epithelial (CDH1) markers (Kubota et al., 2003, Tokuda et al., 2007). To gain better insight on the nature of GSCs, we quantitatively examined several mesenchymal/epithelial markers in direct comparison with ESCs. We found that mesenchymal markers including Thy1 and Cdh2 were expressed at higher levels in GSCs, while epithelial markers, including Cdh1, Dsp, Pkp1, and Crb3, were expressed at lower levels in GSCs (Figures 3A and 3C). These results were consistent with recently published RNA-seq data (Liu et al., 2016) and suggested that GSCs favor the mesenchymal state over the epithelial state.
Figure 3.

Effect of TGF-β Signaling-Mediated Modulation of MET on GSCs Reprogramming
(A and B) qRT-PCR analysis of mesenchymal/epithelial markers (A) and MET regulators (B) as indicated. RNAs were from Oct4-GFP GSCs, ESL cells, and ES-D3 cells. ∗p < 0.01.
(C) Top: phospho-SMAD3, CDH1, and TUB1 immunoblotting of cells lysates from GSCs, ESL cells, and ES-D3 cells. Bottom: phospho-SMAD3, OCT4, NANOG, SOX2, CDH1, ZEB1, and TUB1 immunoblotting of cell lysates from GSCs treated with 25 μM RepSox, 25 μM SB431542, or DMSO (Control).
(D) qRT-PCR analysis of mesenchymal/epithelial-related genes in RNAs of GSCs after 72 hr of treatment with 25 μM RepSox and 25 μM SB431542. DMSO was used as control. ∗p < 0.01.
(E) GSC reprogramming efficiency in RP medium after TGF-β signaling inhibitor (n = 144 wells from seven experiments for RepSox, n = 84 wells from four experiments for SB431542) compared with DMSO control (n = 144 wells from six experiments). ∗p < 0.01.
In (A), (B), (D), and (E), the values in the histograms are presented as the means ± SD. Mean and SD for three biological replicates from three independent experiments are shown.
Transforming growth factor β (TGF-β) signaling plays a major role in influencing MET (Akhurst and Hata, 2012). TGF-β induces EMT through SMAD-mediated and SMAD-independent signaling. In SMAD-mediated signaling TGF-β signals through a tetrameric complex of receptors to activate SMAD2 and SMAD3 and turns on expression of EMT-related factors. Consistent with our observations showing that GSCs exhibit an EMT-favored (mesenchymal) state, we found evidence for relatively higher TGF-β signaling in GSCs than in ESCs. Specifically, Tgfbr1 and phosphorylated SMAD3 were much higher in GSCs than ESCs (Figures 3B and 3C). Also, Smad7, a negative regulator of TGF-β signaling, was lower in GSCs than in ESCs (Figure 3B). These results showed that TGF-β signaling, which plays a negative role in MET, was activated in GSCs. We analyzed factors known to induce EMT, such as Zeb1, Zeb2, Twist1, Twist2, Snai1, and Slug, and found that they were also more highly expressed in GSCs compared with ESCs (Figure 3B). Altogether, a high expression of negative regulators of MET established a MET barrier for GSCs.
We hypothesized that breaking the MET barrier may help to increase the efficiency of GSC reprogramming. To test this prediction we used the TGFBR1 inhibitors, RepSox and SB431542, to repress TGF-β signaling. Treatment of GSCs for 3 days led to decreased phosphorylated SMAD3 (Figure 3C) and increased Smad7 (Figure 3D), confirming the effectiveness of each inhibitor treatment (Figure 3C). Also, repressors of MET, Zeb1 and Snai1, were decreased by RepSox treatment while factors associated with MET, SOX2 and CDH1, were upregulated (Figures 3C and 3D) (Li et al., 2010). In addition, OCT4 and NANOG were increased by 3 days of RepSox treatment (Figure 3C). Importantly, when RepSox treatment was added to reprogramming medium, we saw a marked increase in reprogramming efficiency (Figure 3E and Table 1). However, SB431542 failed to promote GSC reprogramming for reasons that are unclear. One possibility is that both RepSox and SB431542 upregulated CDH1 and increased CDH1+ cells after 3 days; however, SB431542-treated cells failed to maintain elevated CDH1 after 2 weeks of treatment (Figure S2). In addition, unlike with RepSox, cells treated with SB431542 did not have upregulated OCT4 or NANOG or substantially downregulated ZEB1 (Figure 3C). ESL cells generated with RepSox treatment were confirmed to have pluripotent properties based on their ability to form teratomas (Figure S3). These results support the idea of a MET barrier that prevents GSCs from acquiring pluripotency, and that repressing TGF-β signaling could boost MET and promote GSC reprogramming.
ZEB1 but Not ZEB2 Is a MET Regulator in GSC Reprogramming
The process of MET represents a reversion of EMT; therefore, one might predict that downregulation of EMT-inducing transcription factors, such as ZEB1, ZEB2, and TWIST2, would promote GSC reprogramming by promoting MET. We tested this idea by knocking down Zeb1, Zeb2, and Twist2 using small interfering RNA (siRNA) transfection. Zeb1, Zeb2, and Twist2 mRNA levels in GSCs were significantly reduced after each siRNA treatment (Figure 4A). To test whether ZEB1 influenced MET in GSCs, we determined expression of MET genes in GSCs after siRNA treatment (Figure 4C). Zeb1 knockdown led to a significant increase in Cdh1, Dsp, Pkp1, and Crb3 and a decrease in Snai1, Snai2, and Cdh2. Interestingly, Zeb1 knockdown, but not Zeb2 or Twist2 knockdown, promoted GSC reprogramming (Figure 4B and Table 1), suggesting that not all EMT-inducing factors functioned as barriers for GSC reprogramming.
Figure 4.

ZEB1 Represses MET through Binding to the Cdh1 Promoter in GSCs
(A) qRT-PCR analysis of RNAs from GSCs treated with Zeb1, Zeb2, and Twist2 siRNA for 72 hr. Zeb1, Zeb2, and Twist2 genes were detected. ∗p < 0.01, significant difference between siRNA and each control separately.
(B) GSC reprogramming efficiency in RP medium after Zeb1 siRNA (n = 192 total wells from nine experiments), Zeb2 siRNA (n = 84 total wells from five experiments), and Twist2 siRNA (n = 84 total wells from five experiments) treatment. Scrambled non-targeting siRNA was used as a control (n = 168 total wells from nine experiments). ∗p < 0.01.
(C) The expression of MET-related genes after Zeb1 siRNA treatment. qRT-PCR analysis of mesenchymal/epithelial-related genes in GSCs treated with Zeb1 siRNA. siRNA consisting of a scrambled sequence was used as negative control (NC). GSCs without siRNA transfection were used as control (MOCK). ∗p < 0.01, significant difference between siRNA and each control separately.
(D) ZEB1 (top), CDH1 (middle), and TUB1 (bottom) immunoblotting of GSC lysates treated with different siRNA combinations. siRNA consisting of a scrambled sequence was used as negative control (NC).
(E) The locations of E boxes and primers in CDH1 gene promoter (small arrows). Black arrow indicates the transcriptional start site.
(F) qPCR analysis of DNAs from GSCs after chromatin immunoprecipitation (ChIP) by using ZEB1 antibody. ChIP was performed using GSCs treated with Zeb1 siRNA, control siRNA (NC), or no siRNA (MOCK) and qPCR was used to analyze the E-box 1/2 and E-box 3 in the promoter of CDH1. Enrichment is presented as (ChIP/input) × 100.
In (A), (B), (C), and (F), the values in the histograms are presented as the means ± SD. Means and SD for three biological replicates from three independent experiments are shown. ∗p < 0.01.
CDH1 is one of the defining features of the epithelial state (Zeisberg and Neilson, 2009). As described above, our results showed that CDH1 was necessary in GSC reprogramming regulated by OCT4. To test whether CDH1 was also involved in ZEB1-regulated GSC reprogramming, we co-transfected Zeb1 and Cdh1 siRNA during reprogramming. Without CDH1 reprogramming was virtually undetectable in our assay (Table 1), suggesting that CDH1 was a crucial factor in GSC reprogramming and that CDH1 may be downstream of ZEB1 regulation. Consistent with this idea, western blotting showed that Zeb1 knockdown increased CDH1 but not the opposite (Figure 4D). These results suggested Zeb1 knockdown promoted GSC reprogramming via CDH1.
The 5′ proximal promoter region of Cdh1 contains E boxes, sites for direct binding of specific transcription regulators. E boxes in the mouse Cdh1 promoter were shown to play a crucial role in the epithelial-specific expression of Cdh1 (Behrens et al., 1991, Giroldi et al., 1997). To test whether ZEB1 directly regulated CDH1 expression, we analyzed three E-box elements in the promoter of CDH1 by chromatin immunoprecipitation (ChIP) using a ZEB1 antibody (Figure 4E). qPCR analysis of the immunoprecipitated DNA showed that ZEB1 could bind to all three E boxes (Figure 4F). The binding was reduced when ZEB1 was knocked down. These results showed that ZEB1 directly regulated Cdh1 expression and suggested that ZEB1 inhibits MET in GSCs by directly repressing CDH1 transcription.
A Rare Population of Epithelial-like GSCs Exhibits Enhanced Reprogramming Ability
Undifferentiated spermatogonia, and likewise GSC populations, are known to be heterogeneous, with different subpopulations expressing different combinations of proteins (Dann et al., 2008, Hermann et al., 2015, Niedenberger et al., 2015). As shown by immunoblotting (Figure 3C), CDH1 is detected weakly in the GSC population. We hypothesized that a subset of GSCs with elevated CDH1 may exhibit enhanced reprogramming ability. When using collagenase type II to dissociate cells prior to immunostaining and flow cytometry, CDH1 expression was detected in ∼60% of GSCs and with a range of expression levels. In contrast, consistent with the known sensitivity of CDH1 epitopes to trypsin, trypsin-digested GSCs exhibited a much lower percentage of CDH1+ cells (∼3%) (Figure S4). Interestingly, the rare CDH1+ cells detected after trypsin digestion showed significantly higher reprogramming efficiency than CDH1− cells (Table 1 and Figure 5E), suggesting that this CDH1+ cell population has unique properties. Therefore, we focused on the properties of these rare CDH1+ cells that remained after trypsin digestion (hereafter, CDH1+).
Figure 5.

CDH1 Defines an Epithelial-like GSC Subpopulation with Enhanced Reprogramming Efficiency
(A) Pairwise comparison of expression profiles for CDH1−/THY1+ and CDH1+/THY1+ cells. The scatterplot represents normalized expression values (average fragments per kilobase of transcript per million mapped reads) of individual genes, with the genes increased or decreased >2-fold in CDH1−/THY1+ and CDH1+/THY1+ cells indicated in red and green, respectively. Crb3, Dsp, and Cdh1 are marked in blue.
(B) Heatmap showing the hierarchically clustered correlation matrix resulting from comparing the transcript expression values for each pair of samples.
(C) Heatmap showing the relative expression levels of each sample.
(D) qRT-PCR analysis of MET-related gene expression in CDH1+/THY1+ and CDH1−/THY1+ cells. The values in the histogram are presented as the means ± SD. Means and SD for three biological replicates from three independent experiments are shown. ∗p < 0.01.
(E) Reprogramming efficiency in RP medium by using CDH1−/THY1+ cells (n = 96 wells from three experiments) and CDH1+/THY1+ cells (n = 88 wells from three experiments). The values in the histogram are presented as the means ± SD. ∗p < 0.01.
(F) Schematic representation summarizing sorting experiment and results.
(G) Flow cytometry analysis of CDH1 and THY1 expression in GSC (wild-type) reprogramming at indicated time points. Forward and side scatterplots were used to define viable GSCs (not shown) and isotype controls were used to define positive immunostaining. Percentage of parent gates are indicated with CDH1+/THY1+ cells marked in red.
To further understand the properties of CDH1+ GSCs and CDH1− GSCs, we used flow cytometry to sort the two populations after trypsin digestion and compared them by total RNA-seq. A total of 23,803 transcripts were detected, of which 3,125 were upregulated (red in Figure 5A) and 2,134 were downregulated (green in Figure 5A) in CDH1+ GSCs compared with CDH1− GSCs (fold change>2). The differentially transcribed genes (fold change>2) were classified into 28 gene ontology terms, including 13 biological processes, seven cellular components, and eight molecular functions (Figure S5). The data clearly showed CDH1+ and CDH1− cells as having highly distinct profiles (Figure 5B). In particular, numerous epithelial genes (e.g., Dsp, Pkp2, and Krt19) and pluripotency factors (Nanog and Sox2) were highly expressed in the CDH1+ population. In contrast, most genes known to be general markers of SSCs/undifferentiated spermatogonia were downregulated (e.g., GFRA1 and ID4) or unchanged (e.g., ZBTB16 and SALL4) in CDH1+ GSCs (Figures 5A and 5C). KEGG pathway analysis revealed that the populations exhibited distinct activity in signaling pathways including WNT and TGF-β signaling (Figure S5). Notably, Tgfbr1, Smad2, and Smad3 tended to be lower in CDH1+ GSCs while Smad7, an inhibitor of TGF-β signaling, was higher. qRT-PCR analysis confirmed that these trends were statistically significant and showed that epithelial markers Cdh1, Dsp, and Crb3 were highly expressed whereas mesenchymal markers Thy1, Cdh2, Zeb1, and Zeb2 were lowly expressed in CDH1+ GSCs (Figure 5D). The results showed that CDH1+ GSCs were more epithelial in nature compared with CDH1− GSCs and supported the notion that CDH1+ GSCs are able to partly overcome the MET barrier because they may be in an advanced stage of MET.
CDH1+ GSCs were quantified at different time points during GSC reprogramming. We found that CDH1+ GSCs increased over the weeks of reprogramming (Figure 5G), supporting the idea that upregulation of CDH1 through MET occurs during GSC reprogramming. Interestingly, Zeb1 siRNA and RepSox, treatments that both enhanced reprogramming efficiency, also resulted in increased CDH1+ GSCs 2 weeks into reprogramming (Figures S2, S4, and S6), indicating that ZEB1 and TGF-β signaling inhibited the upregulation of CDH1. In summary, these results showed that MET was a crucial step in GSC reprogramming and by initiating reprogramming with rare trypsin-resistant CDH1+ GSCs the barrier to reprogramming was reduced, because CDH1+ GSCs were poised in a later stage of MET.
For obtaining autologous testes-derived pluripotent cells from patients, it is likely that direct reprogramming from primary testicular cells would be required instead of establishing GSC lines. To study whether MET also plays a role in reprogramming of SSCs obtained directly from the testes, we sorted THY1+ cells (enriched in SSCs) from Oct4-GFP mice testes and quantified their reprogramming ability. THY1+ cells were directly sorted into wells in 48-well plates and treated with RepSox and Zeb1 siRNA for 6 weeks. Similar to results obtained with GSCs, testicular SSCs treated with RepSox or Zeb1 siRNA showed increased SSC reprogramming efficiency (Table 1). Using sorted CDH1+/THY1+ SSCs also promoted cell reprogramming efficiency (Table 1). These results suggested that methods based on overcoming a MET barrier were not only relevant to GSC reprogramming but also promoted testicular SSC reprogramming.
Discussion
SSCs are unique among adult cell types in that they share expression of many mRNAs in common with ESCs, including all four Yamanaka factors. Although levels are lower compared with ESCs, Oct4, Klf4, and Myc mRNA and protein, and Sox2 mRNA are all expressed in SSCs, implying that SSCs may contain special protective mechanisms to prevent acquisition of pluripotency in the germline and that additional factors may be required for the initiation of SSC reprogramming (Kanatsu-Shinohara et al., 2008). Our results show that relatively high expression of ZEB1, along with relatively high TGF-β signaling in GSCs compared with ESCs, play a pivotal role in preventing MET in GSCs, thereby inhibiting their reprogramming to pluripotency (Figure 6). We show that enhanced reprogramming can be achieved with three general approaches and that each approach is correlated with an increase in the CDH1+ cell population. First, knockdown of Zeb1, but not Zeb2 or Twist2, enhances reprogramming through its effect on CDH1. Second, RepSox treatment, but not SB431542 treatment, results in a greater CDH1+ cell population while increasing reprogramming efficiency. Finally, using isolated CDH1+ cells directly for reprogramming enhances the generation of ESL cells while CDH1− cells exhibit reprogramming efficiency lower than the basal level of spontaneous reprogramming observed in controls.
Figure 6.

Model of Mechanistic Regulation of Mesenchymal to Epithelial Transition in Reprogramming
Initially, GSCs have moderate to no detectable CDH1 expression. During prolonged culturing rare, transitional GSCs emerge with higher CDH1, reflecting an initiation of MET. Additional known and unknown factors (pink box) further drive reprogramming of MET transitional colonies to a fully epigenetically reprogrammed state of pluripotency. OCT4 and ZEB1 and TGF-β signaling regulate MET during SSC reprogramming. ZEB1 regulates Snai1/2 and directly represses CDH1 expression, thereby preventing MET.
MET is an important step in reprogramming fibroblasts to iPSCs (Li et al., 2010, Samavarchi-Tehrani et al., 2010), and the acquisition of epithelial features and loss of mesenchymal features are known to occur soon after transfection with Yamanaka factors (David and Polo, 2014, Polo et al., 2012). Traditionally, SSCs have been considered neither mesenchymal nor epithelial. Extensive genomic profiling of neonatal mouse spermatogonia recently suggested that both epithelial-like and mesenchymal-like subpopulations of spermatogonia were present (Hammoud et al., 2015). Similarly, we found that GSCs in vitro comprise both epithelial-like (CDH1+) and mesenchymal-like (CDH1−) cells. However, side-by-side comparisons with ESCs show that the GSC population appears to be dominated by a mesenchymal phenotype because expression of epithelial markers, such as Cdh1, Crb3, and Dsp, are much lower in GSCs than ESCs. In addition, GSCs exhibit high expression of MET repressors such as ZEB1, ZEB2, and TWIST2, factors that one would expect to further reinforce the mesenchymal phenotype and prevent acquisition of pluripotency by GSCs. We demonstrate that ZEB1, although not ZEB2 or TWIST2, is a key contributor to the MET barrier that prevents GSC conversion to pluripotency (Figure 6). ZEB1 is well known as an inducer of EMT, the opposite process of MET (Li et al., 2014, Shu and Pei, 2014). ZEB1 has been shown to act as a direct transcriptional repressor of CDH1 in a variety of cell types, but to our knowledge a role for ZEB1 in SSCs has not been described (Eger et al., 2005, Grooteclaes and Frisch, 2000). We provide evidence here that in GSCs ZEB1 directly binds the Cdh1 promoter at both the E-box 1/2 and E-box 3 regions, and that loss of ZEB1 results in increased CDH1 expression and a reduction in the barrier to SSC and GSC reprogramming to pluripotency.
CDH1 is one of the defining marks of the epithelial state. Ironically, CDH1 and THY1 have both been commonly used as spermatogonial markers. We noticed that although THY1 expression is abundant, GSCs have overall much lower expression of CDH1 than ESCs. Only about 3% of GSCs were CDH1+ after trypsin digestion (Figure S4), but after collagenase type II digestion a much higher fraction of GSCs (∼60%) were CDH1+. In contrast, ESCs were over 80% CDH1+, even after trypsin digestion (J.A., unpublished data). Others have used collagenase type II instead of trypsin for testis digestion before CDH1 cell sorting, presumably to protect CDH1 epitopes. Altogether, the results suggested that by using trypsin the sensitivity of our flow cytometry assay was reduced such that only those GSCs with highest CDH1 expression could be detected. In support of this idea, following collagenase type II digestion gene expression analysis of the 3% highest expressing CDH1 cells exhibited relatively high Crb3, Dsp, and Nanog and low Cdh2 and Zeb1, patterns comparable with the CDH1+ trypsin-digested cells (Figure S7). Also, after RepSox or Zeb1 siRNA treatment, comparable effects were observed regardless of the enzyme used for cell dissociation (Figure S4). Hence, despite differences in the absolute number of CDH1+ cells observed with different methods of cell preparation, the GSC subpopulation with the highest CDH1 expression appears to correspond to cells with epithelial properties that are poised in a later stage of MET and with greatest potential for reprogramming.
Transcriptome-wide analysis of the rare CDH1+ trypsin-digested GSC population revealed that they have an epithelial gene expression profile, suggesting that GSC-derived ESL cells may originate from these epithelial-like cells. By using the trypsin-digested CDH1+ and CDH1− cells to initiate a reprogramming experiment it was apparent that the CDH1+ population had a higher reprogramming efficiency than CDH1− cells. The results further support a model wherein MET presents a barrier to GSC reprogramming that can be overcome by selecting cells that have already acquired epithelial characteristics, possibly because they are already undergoing MET, to initiate reprogramming. Still, lineage tracing would be required to prove that cells that upregulate CDH1 are the origin of ESL cells. Interestingly, not only do the CDH1+ GSCs exhibit gene expression consistent with MET, they also are highly enriched in multiple pluripotency factors, including Nanog, an important pluripotency factor not previously detected in SSCs or GSCs. In the context of the normal GSC reprogramming procedure, it is likely that the prolonged culturing of clusters leads to a microniche as proposed by Ko et al. (2010) that is defined by acquisition of epithelial features conducive to the conversion to pluripotency.
Previous studies of GSC reprogramming commonly utilized genetically modified mice. For instance, Oct4-GFP mice have been used because they provide a convenient way to monitor the process of reprogramming (Ko et al., 2010, Youn et al., 2013). Using transgenic mice may be precluded in certain research contexts and is not applicable to clinical settings. We show that the use of Zeb1 knockdown and RepSox are effective for increasing reprogramming efficiency. Both approaches are effective in mice with other genetic backgrounds including C57BL6 wild-type mice, and the experimental approach does not depend on visualization of an Oct4-GFP reporter. ESL cells generated in our study, including from four conditions (RP medium control, RP medium with Dox, RP medium with RepSox, and RP medium with Zeb1 siRNA) exhibit many characteristics of pluripotent cells, including the ability to differentiate to mesoderm, ectoderm, and endoderm both in vitro and in a teratoma assay (Figures 1 and S3). It should be noted, however, that the ESL lines generated in our study were not tested for ability to contribute to a chimera following injection into blastocysts, so conclusions about the extent of pluripotency are tentative. Still, the baseline reprogramming culture conditions and techniques used here (i.e., RP medium control) were proved to generate bona fide pluripotent ESL cells with chimera-forming ability by others (Ko et al., 2009).
In recent years a variety of technologies have emerged for the generation of pluripotent cells, each of which may have its own benefits. Pluripotent cell lines generated by each method may be particularly suitable for certain downstream applications, and it is known that even individual cell lines generated from the same method may exhibit variable propensity for subsequent differentiation. In some cases, using germ cell-derived pluripotent cells may be advantageous over somatic cell-derived pluripotent cells. ESL cells are more equivalent to ESCs than iPSCs of somatic origin in terms of gene expression profiles, indicating that ESL cells might be better than iPSCs for therapeutic purposes (Ko et al., 2009). Also, the presence of telomerase activity in SSCs may lend itself to the production of superior cells for transplantation-based therapies (Ozturk, 2015, Pech et al., 2015). Finally, the ability to obtain pluripotent cells spontaneously, without introducing transgenes, provides advantages. Ultimately, further research will be needed to determine the ideal source of pluripotent cells for any given application.
Some reports have claimed that human SSCs may also become spontaneously reprogrammed to pluripotency; however, more recent data suggest that the cell lines that were generated are fibroblast-like in nature and may be related to multipotent mesenchymal-like stem cells, not ESL cells (Chikhovskaya et al., 2014, Ko et al., 2011, Kossack et al., 2009, Zheng et al., 2014). Based on our observations here with mouse SSCs, it may be possible to obtain bona fide germ cell-derived ESL cells from human testes by enriching for epithelial-like spermatogonia and/or promoting MET through manipulation of TGF-β signaling.
Experimental Procedures
Mice
Transgenic mice were from The Jackson Laboratory. “Dox-Oct4” mice are B6;129-Gt(ROSA)26Sortm1(rtTA∗M2)Jae Col1a1tm2(tetO-Pou5f1)Jae/J (Stock No. 006911). “Oct4-GFP” mice are B6;CBA-Tg(Pou5f1-EGFP)2Mnn/J (Stock No. 04654) and are also known as OG2. Dox-Oct4 homozygous and Oct4-GFP mice were intercrossed to generate doubly transgenic mice. Wild-type mice were C57BL6 background. All procedures involving mice were approved by the Bloomington Institutional Animal Care and Use Committee.
Reprogramming Assay
In initial experiments we determined that plating 200–400 cells per well of a 48-well plate, with minimally 12 replicates, produced an ideal density and quantity of cells to reliably observe reprogramming in at least one well. For the experiments in this study, established GSCs (around passage 6) were seeded on DR4 MEFs at a low density of 250 cells (or 500 cells for primary testis SSCs) per one well of a 48-well plate (Falcon). Cells were fed with RP medium (Table S4) at least two times per week and maintained without passaging until ESL cell colonies appeared, generally 5–7 weeks after seeding. Using this procedure only a single ESL colony could be discerned in any given well. For quantification of wells with ESL cells, all wells of cells were dissociated with 0.05% trypsin and replated (one to one) into new wells with ES medium (Table S4). Wells were scored based on whether the trypsinized cells could proliferate rapidly following trypsinization and transfer to ES medium. Since GSCs require GDNF for proliferation, and ES medium lacks GDNF, remaining germ cells that did not undergo reprogramming died following transfer to the new well. Hence, each well was scored as either positive (ESL cells grew) or negative (cells died). Data from reprogramming assays are summarized in Table 1.
Statistical Analysis
Experiments including qRT-PCR, western blot, and ChIP assay were repeated at least three times (n > 3) with different individual samples (biological replicates). More than 12 wells (n > 12) per treatment group were set up for a single GSC reprogramming experiment and each experiment was reproduced at least three times. Total number of wells and experimental replicates for reprogramming are summarized in Table 1 and provided individually in the figure legends. The values in each histogram (qRT-PCR, ChIP-PCR, and reprogramming) are presented as the means ± SD. Significant differences between means of biological replicates were compared pairwise using Student's t test.
Author Contributions
J.A. designed and performed experiments, analyzed data, and wrote the manuscript; Y.Z. performed experiments and analyzed data; C.T.D. conceived and supervised the study, analyzed data, and wrote the manuscript.
Acknowledgments
Thank you to Aaron Michael Buechlein, Christiane Hassel, and Sue Childress for technical assistance. Indiana University Bloomington Center for Genomics and Bioinformatics and Flow Cytometry Core Facilities were used for certain experiments. Research was supported by funding from the Eunice Kennedy Shriver National Institute of Child Health and Human Development of the NIH under award number 4R01HD071081.
Published: January 5, 2017
Footnotes
Supplemental Information includes Supplemental Experimental Procedures, seven figures, and four tables and can be found with this article online at http://dx.doi.org/10.1016/j.stemcr.2016.12.006.
Accession Numbers
The accession number for the RNA sequencing data reported in this paper is GEO: GSE90712.
Supplemental Information
References
- Akhurst R.J., Hata A. Targeting the TGF beta signalling pathway in disease. Nat Rev. Drug Discov. 2012;11:790. doi: 10.1038/nrd3810. [DOI] [PMC free article] [PubMed] [Google Scholar]
- Behrens J., Lowrick O., Klein-Hitpass L., Birchmeier W. The E-cadherin promoter: functional analysis of a G.C-rich region and an epithelial cell-specific palindromic regulatory element. Proc. Natl. Acad. Sci. USA. 1991;88:11495–11499. doi: 10.1073/pnas.88.24.11495. [DOI] [PMC free article] [PubMed] [Google Scholar]
- Chikhovskaya J.V., van Daalen S.K.M., Korver C.M., Repping S., van Pelt A.M.M. Mesenchymal origin of multipotent human testis-derived stem cells in human testicular cell cultures. Mol. Hum. Reprod. 2014;20:155–167. doi: 10.1093/molehr/gat076. [DOI] [PubMed] [Google Scholar]
- Dann C.T., Alvarado A.L., Molyneux L.A., Denard B.S., Garbers D.L., Porteus M.H. Spermatogonial stem cell self-renewal requires OCT4, a factor downregulated during retinoic acid-induced differentiation. Stem Cells. 2008;26:2928–2937. doi: 10.1634/stemcells.2008-0134. [DOI] [PubMed] [Google Scholar]
- David L., Polo J.M. Phases of reprogramming. Stem Cell Res. 2014;12:754–761. doi: 10.1016/j.scr.2014.03.007. [DOI] [PubMed] [Google Scholar]
- Eger A., Aigner K., Sonderegger S., Dampier B., Oehler S., Schreiber M., Berx G., Cano A., Beug H., Foisner R. DeltaEF1 is a transcriptional repressor of E-cadherin and regulates epithelial plasticity in breast cancer cells. Oncogene. 2005;24:2375–2385. doi: 10.1038/sj.onc.1208429. [DOI] [PubMed] [Google Scholar]
- Fanslow D.A., Wirt S.E., Barker J.C., Connelly J.P., Porteus M.H., Dann C.T. Genome editing in mouse spermatogonial stem/progenitor cells using engineered nucleases. PLoS One. 2014;9:e112652. doi: 10.1371/journal.pone.0112652. [DOI] [PMC free article] [PubMed] [Google Scholar]
- Gaspard N., Bouschet T., Herpoel A., Naeije G., van den Ameele J., Vanderhaeghen P. Generation of cortical neurons from mouse embryonic stem cells. Nat. Protoc. 2009;4:1454–1463. doi: 10.1038/nprot.2009.157. [DOI] [PubMed] [Google Scholar]
- Ginsburg M., Snow M.H., McLaren A. Primordial germ cells in the mouse embryo during gastrulation. Development. 1990;110:521–528. doi: 10.1242/dev.110.2.521. [DOI] [PubMed] [Google Scholar]
- Giroldi L.A., Bringuier P.P., de Weijert M., Jansen C., van Bokhoven A., Schalken J.A. Role of E boxes in the repression of E-cadherin expression. Biochem. Biophys. Res. Commun. 1997;241:453–458. doi: 10.1006/bbrc.1997.7831. [DOI] [PubMed] [Google Scholar]
- Grooteclaes M.L., Frisch S.M. Evidence for a function of CtBP in epithelial gene regulation and anoikis. Oncogene. 2000;19:3823–3828. doi: 10.1038/sj.onc.1203721. [DOI] [PubMed] [Google Scholar]
- Guan K., Nayernia K., Maier L.S., Wagner S., Dressel R., Lee J.H., Nolte J., Wolf F., Li M.Y., Engel W. Pluripotency of spermatogonial stem cells from adult mouse testis. Nature. 2006;440:1199–1203. doi: 10.1038/nature04697. [DOI] [PubMed] [Google Scholar]
- Hammoud S.S., Low D.H., Yi C., Lee C.L., Oatley J.M., Payne C.J., Carrell D.T., Guccione E., Cairns B.R. Transcription and imprinting dynamics in developing postnatal male germline stem cells. Genes Dev. 2015;29:2312–2324. doi: 10.1101/gad.261925.115. [DOI] [PMC free article] [PubMed] [Google Scholar]
- Heim C.N., Fanslow D.A., Dann C.T. Development of quantitative microscopy-based assays for evaluating dynamics of living cultures of mouse spermatogonial stem/progenitor cells. Biol. Reprod. 2012;87:90. doi: 10.1095/biolreprod.112.101717. [DOI] [PMC free article] [PubMed] [Google Scholar]
- Hermann B.P., Mutoji K.N., Velte E.K., Ko D.J., Oatley J.M., Geyer C.B., McCarrey J.R. Transcriptional and translational heterogeneity among neonatal mouse spermatogonia. Biol. Reprod. 2015;92:54. doi: 10.1095/biolreprod.114.125757. [DOI] [PMC free article] [PubMed] [Google Scholar]
- Hochedlinger K., Yamada Y., Beard C., Jaenisch R. Ectopic expression of Oct-4 blocks progenitor-cell differentiation and causes dysplasia in epithelial tissues. Cell. 2005;121:465–477. doi: 10.1016/j.cell.2005.02.018. [DOI] [PubMed] [Google Scholar]
- Imhof B.A., Vollmers H.P., Goodman S.L., Birchmeier W. Cell-cell interaction and polarity of epithelial cells: specific perturbation using a monoclonal antibody. Cell. 1983;35:667–675. doi: 10.1016/0092-8674(83)90099-5. [DOI] [PubMed] [Google Scholar]
- Kanatsu-Shinohara M., Ogonuki N., Inoue K., Miki H., Ogura A., Toyokuni S., Shinohara T. Long-term proliferation in culture and germline transmission of mouse male germline stem cells. Biol. Reprod. 2003;69:612–616. doi: 10.1095/biolreprod.103.017012. [DOI] [PubMed] [Google Scholar]
- Kanatsu-Shinohara M., Inoue K., Lee J., Yoshimoto M., Ogonuki N., Miki H., Baba S., Kato T., Kazuki Y., Toyokuni S. Generation of pluripotent stem cells from neonatal mouse testis. Cell. 2004;119:1001–1012. doi: 10.1016/j.cell.2004.11.011. [DOI] [PubMed] [Google Scholar]
- Kanatsu-Shinohara M., Lee J., Inoue K., Ogonuki N., Miki H., Toyokun S., Ikawa M., Nakamura T., Gura A., Shinohara T. Pluripotency of a single spermatogonial stem cell in mice. Biol. Reprod. 2008;78:681–687. doi: 10.1095/biolreprod.107.066068. [DOI] [PubMed] [Google Scholar]
- Ko K., Tapia N., Wu G.M., Kim J.B., Arauzo-Bravo M.J., Sasse P., Glaser T., Ruau D., Han D.W., Greber B. Induction of pluripotency in adult unipotent germline stem cells. Cell Stem Cell. 2009;5:87–96. doi: 10.1016/j.stem.2009.05.025. [DOI] [PubMed] [Google Scholar]
- Ko K., Arauzo-Bravo M.J., Kim J., Stehling M., Scholer H.R. Conversion of adult mouse unipotent germline stem cells into pluripotent stem cells. Nat. Protoc. 2010;5:921–928. doi: 10.1038/nprot.2010.44. [DOI] [PubMed] [Google Scholar]
- Ko K., Reinhardt P., Tapia N., Schneider R.K., Arauzo-Bravo M.J., Han D.W., Greber B., Kim J., Kliesch S., Zenke M. Brief report: evaluating the potential of putative pluripotent cells derived from human testis. Stem Cells. 2011;29:1304–1309. doi: 10.1002/stem.671. [DOI] [PubMed] [Google Scholar]
- Kossack N., Meneses J., Shefi S., Nguyen H.N., Chavez S., Nicholas C., Gromoll J., Turek P., Pera R.R. Isolation and characterization of pluripotent human spermatogonial stem cell-derived cells. J. Androl. 2009;30:130. doi: 10.1634/stemcells.2008-0439. [DOI] [PMC free article] [PubMed] [Google Scholar]
- Kubota H., Avarbock M.R., Brinster R.L. Spermatogonial stem cells share some, but not all, phenotypic and functional characteristics with other stem cells. Proc. Natl. Acad. Sci. USA. 2003;100:6487–6492. doi: 10.1073/pnas.0631767100. [DOI] [PMC free article] [PubMed] [Google Scholar]
- Kubota H., Avarbock M.R., Brinster R.L. Growth factors essential for self-renewal and expansion of mouse spermatogonial stem cells. Proc. Natl. Acad. Sci. USA. 2004;101:16489–16494. doi: 10.1073/pnas.0407063101. [DOI] [PMC free article] [PubMed] [Google Scholar]
- Labosky P.A., Barlow D.P., Hogan B.L. Mouse embryonic germ (EG) cell lines: transmission through the germline and differences in the methylation imprint of insulin-like growth factor 2 receptor (Igf2r) gene compared with embryonic stem (ES) cell lines. Development. 1994;120:3197–3204. doi: 10.1242/dev.120.11.3197. [DOI] [PubMed] [Google Scholar]
- Li R.H., Liang J.L., Ni S., Zhou T., Qing X.B., Li H.P., He W.Z., Chen J.K., Li F., Zhuang Q.A. A mesenchymal-to-epithelial transition initiates and is required for the nuclear reprogramming of mouse fibroblasts. Cell Stem Cell. 2010;7:51–63. doi: 10.1016/j.stem.2010.04.014. [DOI] [PubMed] [Google Scholar]
- Li X., Pei D.Q., Zheng H. Transitions between epithelial and mesenchymal states during cell fate conversions. Protein Cell. 2014;5:580–591. doi: 10.1007/s13238-014-0064-x. [DOI] [PMC free article] [PubMed] [Google Scholar]
- Liu Y., Giannopoulou E.G., Wen D.C., Falciatori I., Elemento O., Allis C.D., Rafii S., Seandel M. Epigenetic profiles signify cell fate plasticity in unipotent spermatogonial stem and progenitor cells. Nat. Commun. 2016;7:11275. doi: 10.1038/ncomms11275. [DOI] [PMC free article] [PubMed] [Google Scholar]
- Matsui Y., Zsebo K., Hogan B.L. Derivation of pluripotential embryonic stem cells from murine primordial germ cells in culture. Cell. 1992;70:841–847. doi: 10.1016/0092-8674(92)90317-6. [DOI] [PubMed] [Google Scholar]
- Morimoto H., Lee J., Tanaka T., Ishii K., Toyokuni S., Kanatsu-Shinohara M., Shinohara T. In vitro transformation of mouse testis cells by oncogene transfection. Biol. Reprod. 2012;86:148. doi: 10.1095/biolreprod.111.095307. 1–11. [DOI] [PubMed] [Google Scholar]
- Niedenberger B.A., Busada J.T., Geyer C.B. Marker expression reveals heterogeneity of spermatogonia in the neonatal mouse testis. Reproduction. 2015;149:329–338. doi: 10.1530/REP-14-0653. [DOI] [PMC free article] [PubMed] [Google Scholar]
- Ocana O.H., Nieto M.A. Epithelial plasticity, stemness and pluripotency. Cell Res. 2010;20:1086–1088. doi: 10.1038/cr.2010.127. [DOI] [PubMed] [Google Scholar]
- Ozturk S. Telomerase activity and telomere length in male germ cells. Biol. Reprod. 2015;92:53. doi: 10.1095/biolreprod.114.124008. [DOI] [PubMed] [Google Scholar]
- Pech M.F., Garbuzov A., Hasegawa K., Sukhwani M., Zhang R.X.J., Benayoun B.A., Brockman S.A., Lin S.D., Brunet A., Orwig K.E. High telomerase is a hallmark of undifferentiated spermatogonia and is required for maintenance of male germline stem cells. Genes Dev. 2015;29:2420–2434. doi: 10.1101/gad.271783.115. [DOI] [PMC free article] [PubMed] [Google Scholar]
- Polo J.M., Anderssen E., Walsh R.M., Schwarz B.A., Nefzger C.M., Lim S.M., Borkent M., Apostolou E., Alaei S., Cloutier J. A molecular roadmap of reprogramming somatic cells into iPS cells. Cell. 2012;151:1617–1632. doi: 10.1016/j.cell.2012.11.039. [DOI] [PMC free article] [PubMed] [Google Scholar]
- Resnick J.L., Bixler L.S., Cheng L., Donovan P.J. Long-term proliferation of mouse primordial germ cells in culture. Nature. 1992;359:550–551. doi: 10.1038/359550a0. [DOI] [PubMed] [Google Scholar]
- Samavarchi-Tehrani P., Golipour A., David L., Sung H.K., Beyer T.A., Datti A., Woltjen K., Nagy A., Wrana J.L. Functional genomics reveals a BMP-driven mesenchymal-to-epithelial transition in the initiation of somatic cell reprogramming. Cell Stem Cell. 2010;7:64–77. doi: 10.1016/j.stem.2010.04.015. [DOI] [PubMed] [Google Scholar]
- Seandel M., James D., Shmelkov S.V., Falciatori I., Kim J., Chavala S., Scherr D.S., Zhang F., Torres R., Gale N.W. Generation of functional multipotent adult stem cells from GPR125(+) germline progenitors. Nature. 2007;449:346. doi: 10.1038/nature06129. [DOI] [PMC free article] [PubMed] [Google Scholar]
- Shu X.D., Pei D.Q. The function and regulation of mesenchymal-to-epithelial transition in somatic cell reprogramming. Curr. Opin. Genet. Dev. 2014;28:32–37. doi: 10.1016/j.gde.2014.08.005. [DOI] [PubMed] [Google Scholar]
- Tokuda M., Kadokawa Y., Kurahashi H., Marunouchi T. CDH1 is a specific marker for undifferentiated spermatogonia in mouse testes. Biol. Reprod. 2007;76:130–141. doi: 10.1095/biolreprod.106.053181. [DOI] [PubMed] [Google Scholar]
- Youn H., Kim S.H., Choi K.A., Kim S. Characterization of Oct4-GFP spermatogonial stem cell line and its application in the reprogramming studies. J. Cell Biochem. 2013;114:920–928. doi: 10.1002/jcb.24431. [DOI] [PubMed] [Google Scholar]
- Zeisberg M., Neilson E.G. Biomarkers for epithelial-mesenchymal transitions. J. Clin. Invest. 2009;119:1429–1437. doi: 10.1172/JCI36183. [DOI] [PMC free article] [PubMed] [Google Scholar]
- Zheng Y., Thomas A., Schmidt C.M., Dann C.T. Quantitative detection of human spermatogonia for optimization of spermatogonial stem cell culture. Hum. Reprod. 2014;29:2497–2511. doi: 10.1093/humrep/deu232. [DOI] [PMC free article] [PubMed] [Google Scholar]
Associated Data
This section collects any data citations, data availability statements, or supplementary materials included in this article.