

Abstract
Mitochondrially generated oxidants are believed to play important roles in both physiology and pathophysiology. Therefore, it is of significant interest to better understand the metabolic conditions leading to enhanced mitochondrial oxidant generation. Here, we investigate the influence of oxygen and glucose availability on the redox state of peroxiredoxin-based redox probes, expressed in the cytosol and mitochondrial matrix of yeast cells. We observe that the redox state of peroxiredoxin probes reflects the balance between dioxygen-dependent peroxide generation and glucose-dependent generation of reducing equivalents. The oxidative pentose phosphate pathway appears to be the dominant source of NADPH in the system under study.
Keywords: mitochondria, genetically encoded redox probes, hydrogen peroxide, pentose phosphate pathway
1. Introduction
The mitochondrial electron transport chain (ETC) is known to produce variable amounts of superoxide, depending on metabolic conditions [1]. Superoxide dismutates to hydrogen peroxide (H2O2), which can also be emitted to the cytosol. The generation and emission of mitochondrial H2O2 is believed to serve as a signal that contributes to mitochondrial homeostasis (mitogenesis, mitophagy) [2] and stress adaptation (e.g. mitohormesis) [3], but may also play a negative role in various pathologies (e.g. neurodegeneration) [4]. Thus, understanding which metabolic conditions lead to enhanced mitochondrial H2O2 generation is of significant interest.
On the one hand, it is obvious that dioxygen (O2) availability must be an important determinant of mitochondrial H2O2 generation, because O2 is the precursor of superoxide and thus H2O2. On the other hand, the quantity and quality of reduced carbon sources taken up from the environment as nutrients must also be an important factor. Nutrients provide the electrons, through NADH and NADPH, which generate partially reduced oxygen species in the first place (at the ETC or through various oxidases). But they also provide additional electrons, through NADPH, that need to be spent to fully reduce the partially reduced oxygen species to water.
We recently developed a genetically encoded redox probe, roGFP2-Tsa2ΔCR [5], which is based on redox-sensitive green fluorescent protein (roGFP) [6] and reports on the redox state of a typical 2-Cys peroxiredoxin (Prx). Prxs are the most abundant thiol peroxidases and are responsible for reducing almost all of the H2O2 formed inside cells [7]. Although H2O2 is the predominant substrate, 2-Cys Prxs can also reduce other kinds of peroxides with varied efficiency, including peroxynitrite and organic hydroperoxides. Prxs are reduced via NADPH-dependent systems [8]. Therefore, Prx-based probes in effect should monitor the balance between O2-dependent peroxide generation and nutrient-dependent NADPH generation (figure 1).
Figure 1.
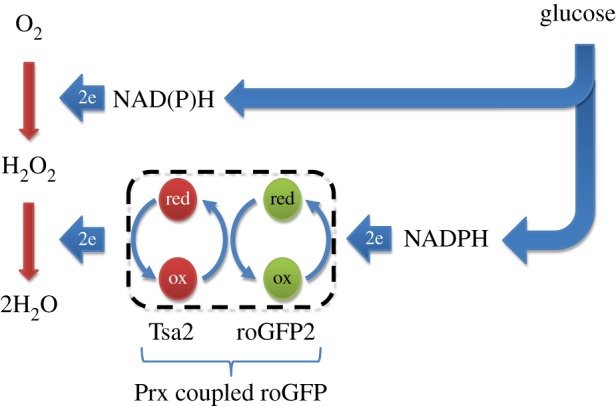
General principle of how Prx-based redox probes are oxidized and reduced. Initially, two electrons (coming from NADH or NADPH) are spent to partially reduce molecular oxygen (O2) to hydrogen peroxide (H2O2), which then abstracts two additional electrons from the Prx (red) to form H2O. The oxidized Prx transfers the oxidizing equivalent to redox-sensitive green fluorescent protein 2 (roGFP2, green) to which it is physically connected (dotted line). The oxidized redox probe is subsequently reduced via NADPH-dependent thiol reducing systems. (Online version in colour.)
In this study, we investigated how the availability of O2 and a nutritional electron source (glucose; Glc) influences the redox state of the Prx-based probe in the mitochondrial and cytosolic compartments of yeast cells.
2. Results
2.1. The influence of oxygen availability
For our experiments, we used yeast strains harbouring genomically integrated expression cassettes encoding roGFP2-Tsa2ΔCR with or without a mitochondrial targeting sequence. To monitor the influence of O2 availability on the cytosolic and mitochondrial probe redox states in real time, we grew colonies on solid agar plates and monitored probe fluorescence from individual colonies inside an atmospheric control unit. The atmospheric volume fraction of O2 was decreased from 18% to 1% over a time period of 5 h and then kept at 1% O2 for 1 h. The hypoxic period was followed by continuous re-oxygenation over 10 h until again reaching normoxic O2 pressure (figure 2a,b; filled curve).
Figure 2.

The influence of oxygen availability on the redox state of Prx-based probes and on the RTG pathway. (a) Oxygen pressure influences the redox state of cyto- and mito-roGFP2-Tsa2ΔCR probes as expressed in yeast colonies growing on agar plates. roGFP2 oxidation is represented by the 405 nm/580 nm ratio. (b) Endogenous expression of Cit2-mCherry fusion protein monitored over time. mCherry fluorescence intensity exceeded the measuring range at t > 12 h. (n = 2 independent experiments in which the response to oxygen pressure was measured in 15 different colonies). Error bars represent the mean ± s.d.
The cytosolic probe immediately responded to the decrease in O2 availability by becoming more reduced, suggesting that the cytosolic Prx redox state directly depends on exogenous O2 availability (figure 2a). By contrast, the mitochondrial probe largely maintained its redox state until atmospheric O2 fell below a volume fraction of ≈12%, suggesting that the redox conditions inside the mitochondrial matrix are buffered against exogenous fluctuations in O2 availability. Below 12% O2, the degree of mitochondrial probe oxidation decreased in lockstep with the decrease in O2 levels. During the hypoxic phase, both probes reached the same degree of near-complete reduction. Upon re-oxygenation, the mitochondrial probe recovered to its starting redox state, in lockstep with the continuous increase of O2 pressure. Surprisingly, and in stark contrast, the cytosolic probe remained in the reduced state during the whole time course of re-oxygenation (figure 2a).
As pharmacological inhibition of respiration is known to induce the retrograde (RTG) signalling pathway [9], we asked if lowering O2 pressure would induce RTG signalling in our system (figure 2b). To this end, we monitored citrate synthase 2 (Cit2) expression, a well-established indicator of RTG induction [10], using a Cit2-mCherry fusion construct integrated into the endogenous CIT2 locus. Cit2 is induced under conditions of respiratory inhibition because it provides citrate through the glyoxylate cycle, to fuel the interrupted TCA cycle [11]. Cit2 expression was very low and constant under normoxic conditions. However, it was strongly upregulated 3 h after the hypoxic phase, during the re-oxygenation phase. This result suggested that either hypoxia per se or re-oxygenation triggered the RTG response pathway.
2.2. The influence of glucose availability
To investigate the influence of Glc availability on the redox state of the cytosolic and mitochondrial probes, we grew yeast in synthetic defined (SD) medium with or without Glc. As we have shown previously [5], respiring yeast cells growing in liquid suspension rapidly deplete dissolved O2 (as expected due to limiting O2 diffusion conductivity across the air–liquid interface), leading to increased probe reduction over time. We observed that the cytosolic probe was more rapidly and more strongly reduced in the presence of Glc, yet both cultures (SD ± Glc) reached the same degree of probe oxidation (OxD) after 3 h (figure 3a).
Figure 3.

The influence of glucose availability on the redox state of roGFP2-Tsa2ΔCR in suspension growth. roGFP2 oxidation over time in wild-type (a–c) and Δcox7 (b,c) cells, transformed with cytosolic and mitochondrial roGFP2-Tsa2ΔCR. n = 3 independent experiments with two technical replicates each, OxD, degree of sensor oxidation. Error bars represent the mean ± s.d.
In order to separate the effect of Glc availability from the effect of oxygen depletion, we repeated the experiment with non-respiring yeast cells, lacking a functional respiratory complex IV (Δcox7). After 3 h of incubation in SD medium, Glc was added (figure 3b,c). Both the cytosolic and mitochondrial probes were more oxidized in Δcox7 cells, but were rapidly reduced upon adding 2% Glc to the medium. While the cytosolic probe was completely reduced, the mitochondrial probe was only partially reduced, suggesting that reducing equivalents provided by Glc primarily became available the cytosol (figure 3c).
2.3. The oxidative pentose phosphate pathway is the dominant source of reducing equivalents
The strong influence of Glc availability on the redox state of both the cytosolic and mitochondrial probes implicated the oxidative pentose phosphate pathway (oxPPP) as the main source of NADPH. To further investigate the influence of oxPPP activity on the probe, we first characterized the NAD(P)H autofluorescence signal in yeast (figure 4a–d). We confirmed that the in vitro excitation spectra of NADH and NADPH (figure 4a) matched the spectral pattern emitted by yeast cells and that NAD(P)H autofluorescence intensity is proportional to cell density (figure 4b). We then challenged cells with H2O2 to provoke acute demand for NADPH and to study the relationship between Prx redox state and NAD(P)H autofluorescence. Upon delivering an H2O2 bolus, both the redox probe (figure 4c) and the NAD(P)H signal (figure 4d) responded in a concentration-dependent manner. As NAD(P)H fluorescence intensity is a function of NAD(P)H concentration, cells incubated without Glc, being in a non-proliferative state, exhibited an unchanging NAD(P)H signal, while cells grown with Glc exhibited a linear increase in the NAD(P)H signal, corresponding to cell proliferation (figure 4e). The NAD(P)H signal coming from cells incubated with Glc reached a plateau after 4 h, which was lower when cells had received an H2O2 bolus (figure 4e). To further investigate this effect, we incubated cells with either low (0.2%) or high Glc (2%) and monitored growth with or without the addition of 1 mM H2O2 during the log phase (figure 4f). In the absence of H2O2, cells in low and high Glc medium grew similarly. The addition of H2O2 delayed growth in both low and high Glc mediums. Despite the delay, the high Glc cultures reached the same optical density at stationary phase, irrespective of the addition of H2O2. By contrast, the addition of H2O2 to cells in low glucose medium not only delayed growth but also led to a lower cell density at stationary phase. These observations indicated that the growth of non-stressed cells is not limited by lowering Glc to 0.2%. However, in the presence of an oxidant, glucose is not only used in biosynthesis but also to provide reducing equivalents for the anti-oxidative reducing systems; therefore biosynthesis is compromised when the Glc supply is limiting.
Figure 4.

Genetic or pharmacological disruption of the oxPPP increases cyto-roGFP2-Tsa2ΔCR oxidation. (a) Excitation spectra (emission recorded at 460 nm) of NADPH and NADH (500 mM each) in vitro. (b) Excitation spectrum of yeast cells at two different cell densities. (c) Response of cytosolic roGFP2-Tsa2ΔCR to H2O2 bolus addition. (d) Response of NAD(P)H autofluorescence (Ex 340 nm; Em 460 nm) in the same experiment as in (c), normalized to t = 0. The vertical lines in (c) and (d) indicate corresponding time points to show that maximal probe oxidation coincides with the end of the excursion of NAD(P)H fluorescence. (e) Change of NAD(P)H autofluorescence in yeast cultures growing with or without Glc, in the presence or absence of H2O2. (f) Influence of Glc concentration and H2O2 on growth curves. (g) Response of cytosolic roGFP2-Tsa2ΔCR to treatment with CB83, an inhibitor of G6PDH, in wt cells growing in suspension. The normalized NAD(P)H signal is monitored in the same experiment. (h) Redox state of cytosolic roGFP2-Tsa2ΔCR in wt and Δzwf1 cells. (a-h) n=2 independent experiments with two technical replicates each. Error bars represent the mean ± s.d. OxD, degree of oxidation.
In the following experiments, to obtain information about the cellular NAD(P)H status (independent of cell number), we normalized the NAD(P)H signal to the cell number. We interrupted oxPPP activity and monitored the probe redox state together with normalized NAD(P)H autofluorescence (figure 4g,h). Pharmacological inhibition of glucose-6-phosphate dehydrogenase (G6PDH) with the small molecule inhibitor CB83 [12] decreased the NAD(P)H signal and gradually increased probe oxidation to 80% (figure 4g). Moreover, we compared probe oxidation in wild-type cells and in cells lacking G6PDH (Δzwf1). The probe expressed in Δzwf1 cells was more oxidized than in wild-type cells (figure 4h), probe oxidation being comparable in magnitude to the increase observed after 4 h of CB83 treatment. These observations suggested that G6PDH, and thereby oxPPP, is the major source of NADPH and that its loss cannot be compensated by alternative NADPH sources.
2.4. The oxPPP regulates the response to exogenously supplied H2O2
Yeast cells lacking G6PDH (Δzwf1) have been described to be more sensitive to H2O2 exposure [13]. To investigate the influence of oxPPP activity on the cytosolic probe response to exogenous H2O2, we monitored NAD(P)H autofluorescence and the probe redox state in wt and Δzwf1 cells following a bolus of H2O2 in a medium with and without Glc.
G6PDH-proficient cells rapidly responded to a H2O2 bolus by increasing NAD(P)H autofluorescence (figure 5a). When probe oxidation reached a plateau, the NAD(P)H signal peaked and then rapidly dropped back to basal levels. The re-normalization of the NAD(P)H signal coincided with the start of progressive probe reduction, suggesting that a burst in NADPH production served to accommodate the acute H2O2 load surge. When the same cells were incubated with glucose (figure 5b), the amplitude of probe oxidation was lower and the reductive recovery faster. The NAD(P)H signal was not increased by the H2O2 pulse, suggesting that basal glucose-dependent NADPH production was sufficient to counteract the initial surge in H2O2 load.
Figure 5.

The oxPPP regulates the response to exogenously added H2O2. (a–d) Response of the cytosolic roGFP2-Tsa2ΔCR probe and NAD(P)H autofluorescence to H2O2 in wild-type (a,b) and Δzwf1 cells (c,d) grown in suspension. n = 2 independent experiments with two technical replicates each. OxD: degree of probe oxidation. Normalized NAD(P)H autofluorescence: fluorescence in the presence of H2O2 divided by the fluorescence in the absence of H2O2 [NAD(P)H(+H2O2)/NAD(P)H(-H2O2)].
When cells lacking oxPPP activity (Δzwf1) were kept without Glc the probe was already 80% oxidized at steady state. The addition of H2O2 further increased probe oxidation, but only slightly. As expected, the NAD(P)H signal in Δzwf1 cells was not induced by the addition of H2O2 (figure 5c), but rather decreased, indicating net oxidation of NADPH. Glucose availability (2%) led to a more reduced probe, but again, generation of NAD(P)H was not induced by H2O2 in G6PDH deficient cells (figure 5d).
3. Discussion
We investigated how the redox state of a Prx, expressed as a probe in yeast, is influenced by changes in atmospheric O2 availability. The first notable observation was that the cytosolic probe immediately responded to even a slight lowering of O2 pressure while the mitochondrial probe maintained its redox state until atmospheric O2 fell below a volume fraction of ≈12%. This observation suggests that redox conditions in the mitochondrial matrix, but not in the cytosol, are buffered against exogenous fluctuations in O2 availability. This is in line with the idea that O2 is preferentially channelled to mitochondria when overall O2 availability decreases. Previous studies have shown that cells redistribute oxygen from the cytosol to the mitochondria under hypoxic conditions [14,15]. In our system, the majority of O2 seems to be consumed by the mitochondrial ETC as inactivation of complex IV abolished overall O2 consumption [5].
The second notable observation was that stepwise re-oxygenation after hypoxia led to the re-oxidation of the mitochondrial, but not of the cytosolic probe. It is not obvious why the cytosolic probe remained fully reduced, but it may be speculated that the hypoxic phase induced a long-lasting metabolic adaptation that supported ongoing reduction of the cytosolic probe during the re-oxygenation phase. This metabolic adaptation may indeed be connected to the observed activation of the RTG pathway under hypoxic conditions, which appears to be an adaptive response to the loss of respiratory function [16]. Mitochondrial dysfunction stimulates glycolysis [17,18] and triggers major changes in gene expression related to carbohydrate, lipid and isoprenoid metabolism [19]. It is likely that the agar substrate provided enough glucose to support increased NADPH production throughout the hypoxic and re-oxygenation phases. In addition, hypoxic conditions may also lead to the upregulation of anti-oxidative enzymes [20].
We then looked at the influence of glucose availability. In the absence of glucose, ETC-defective, non-respiring cells exhibited pronounced probe oxidation in both cytosolic and mitochondrial compartments. This effect can be explained by the increased H2O2 generation that is expected to accompany ETC disruption [1]. Provisioning glucose led to rapid probe reduction, most prominently in the cytosol, thus implying the generation of NADPH. As expected, NADPH was predominantly generated through the oxPPP, as pharmacological inhibition or genetic deletion of G6PDH increased the oxidation of the cytosolic probe.
In this study, we used NAD(P)H autofluorescence as a first preliminary attempt to estimate changes in NADPH levels. The fact that G6PDH deletion essentially abolished the H2O2-induced increase in NAD(P)H autofluorescence supports the interpretation that the observed changes predominantly relate to the NADP+/NADPH redox couple. The almost immediate increase in NAD(P)H autofluorescence upon adding H2O2, if correctly interpreted as a reflection of increased NADPH levels, is broadly in line with previous studies, showing H2O2-induced rerouting of glucose-6-phosphate into the oxPPP and allosteric activation of G6PDH by NADP+ [21]. The critical role of the oxPPP as the dominant source of NADPH in our system is also reflected by the fact that G6PDH-deficient (Δzwf1) cells cannot grow in medium lacking methionine, which requires NADPH for biosynthesis [22,23].
It must be stressed that the interpretation of the NAD(P)H autofluorescence signals is generally problematic and must remain uncertain. Not only because autofluorescence cannot distinguish between NADH and NADPH, which are spectrally identical, but also because it cannot distinguish between changes in NAD(P)+/NAD(P)H ratios and changes in total pyridine nucleotide levels. Moreover, whole-cell autofluorescence measurements average contributions from all subcellular compartments, although the compartmental pyridine nucleotide pools are controlled independently. Therefore, more advanced methods need to be employed in the future to achieve chemical specificity and subcompartmental resolution. Technical possibilities include (i) the separation of NADH and NADPH autofluorescence using fluorescence lifetime imaging [24], (ii) the use of genetically encoded NADH [25] or NAD+/NADH probes [26], and (iii) the use of the genetically encoded Apollo-NADP+ probe [27].
In conclusion, we have taken first steps to evaluate the impact of oxygen and glucose on the state of intracellular Prx-based redox probes. As expected, the Prx redox state does not only respond to changes in intracellular H2O2 generation but also to changes in the availability of reducing power (NADPH). It will be important to consider both sides of the equation when interpreting probe responses.
4. Material and methods
4.1. Reagents
All reagents were purchased from Sigma-Aldrich unless otherwise stated.
4.2. Yeast strains and culture conditions
Yeast strains used in this study are derivatives of the BY4742 strain (table 1). Yeast cells were grown at 28°C in solid or liquid YPD medium (10 g l−1 yeast extract, 20 g l−1 peptone, and 20 g l−1 glucose or galactose). For fluorescence measurements on solid medium, saturated liquid cultures grown in YPD were plated with replica pads (ROTOR, Singer instruments) and grown in SD medium for 20 h at 28°C.
Table 1.
Yeast strains used in this study.
4.3. Construction of yeast strains
Yeast genome manipulations (insertions and tagging) were performed using PCR targeting for standard homologous recombination as described [29]. Plasmids and primers used in this study are listed in table 2.
Table 2.
Plasmids used in this study.
| plasmid | description | source |
|---|---|---|
| pRS303N | vector for integration into the HIS3 locus with nourseothricin resistance marker | [29] |
| pRS303N GDP-roGFP2-Tsa2ΔCR | this study | |
| pRS303N GDP-Su9-roGFP2-Tsa2ΔCR | this study | |
| p415 TEF empty | CEN ARS LEU2 low copy yeast/E. coli shuttle plasmid with LEU2 auxotrophic selection | [30] |
| p415 TEF roGFP2-Tsa2ΔCR | [5] | |
| p415 TEF Su9-roGFP2-Tsa2ΔCR | [5] |
4.4. Measurement of roGFP2 probe oxidation: fluorescence imaging
The roGFP2-Tsa2ΔCR redox state was measured using a fluorescence plate reader, as described previously [31]. Cells were grown to late logarithmic phase (OD600 nm = 3–4) in SD media lacking leucine for auxotrophic selection. Cells were harvested by centrifugation at 4000 r.p.m. for 5 min at room temperature and subsequently resuspended in SD medium to a final concentration of 1.5 OD600 nm ml−1. In total, 100 µl of each cell suspension was transferred to two wells of a flat-bottomed black/clear 384-well imaging plate. To determine the degree of probe oxidation (OxD), N,N,N′,N′-tetramethylazodicarboxamide (diamide) was added to a final concentration of 20 mM to a generate a fully oxidized control sample. Dithiothreitol (DTT) was added to a final concentration of 100 mM to generate a fully reduced control sample. OxD was calculated as described previously [31]. All fluorescence measurements were performed with either a CLARIOstar or PHERAstar FS plate reader (BMG-Labtech, Ortenberg, Germany).
4.5. Oxygen depletion assay
Measurements were performed using a CLARIOstar microplate reader with an atmospheric control unit (BMG-Labtech, Ortenberg, Germany). Single colonies were observed over 16 h by taking fluorescence measurements every 10 min. The oxygen volume fraction was reduced stepwise by 0.5% every 10 min until reaching 1%. For re-oxygenation, the volume fraction was increased stepwise by 0.5% every 20 min.
4.6. Yeast growth assay
Yeast cells were grown to stationary phase in SD complete medium at 28°C. The cultures were diluted to an OD600 nm of 0.1 in SD complete medium in a 200 µM well of a 96-well plate. The plate was incubated in a FLUOstar Omega plate reader for 16 h at 30°C with orbital shaking at 500 r.p.m. every 10 min. Measurements were taken every 10 min. After 6 h, a bolus of 1 mM H2O2 or water was added.
Competing interests
We declare we have no competing interests.
Funding
T.P.D. and K.B. are supported by the Deutsche Forschungsgemeinschaft (DFG) priority programme SPP1710.
References
- 1.Murphy MP. 2009. How mitochondria produce reactive oxygen species. Biochem. J. 417, 1–13. ( 10.1042/BJ20081386) [DOI] [PMC free article] [PubMed] [Google Scholar]
- 2.Willems PH, Rossignol R, Dieteren CE, Murphy MP, Koopman WJ. 2015. Redox homeostasis and mitochondrial dynamics. Cell Metab. 22, 207–218. ( 10.1016/j.cmet.2015.06.006) [DOI] [PubMed] [Google Scholar]
- 3.Ristow M. 2014. Unraveling the truth about antioxidants: mitohormesis explains ROS-induced health benefits. Nat. Med. 20, 709–711. ( 10.1038/nm.3624) [DOI] [PubMed] [Google Scholar]
- 4.Lin MT, Beal MF. 2006. Mitochondrial dysfunction and oxidative stress in neurodegenerative diseases. Nature 443, 787–795. ( 10.1038/nature05292) [DOI] [PubMed] [Google Scholar]
- 5.Morgan B, Van Laer K, Owusu TN, Ezerina D, Pastor-Flores D, Amponsah PS, Tursch A, Dick TP. 2016. Real-time monitoring of basal H2O2 levels with peroxiredoxin-based probes. Nat. Chem. Biol. 12, 437–443. ( 10.1038/nchembio.2067) [DOI] [PubMed] [Google Scholar]
- 6.Dooley CT, Dore TM, Hanson GT, Jackson WC, Remington SJ, Tsien RY. 2004. Imaging dynamic redox changes in mammalian cells with green fluorescent protein indicators. J. Biol. Chem. 279, 22 284–22 293. ( 10.1074/jbc.M312847200) [DOI] [PubMed] [Google Scholar]
- 7.Winterbourn CC. 2008. Reconciling the chemistry and biology of reactive oxygen species. Nat. Chem. Biol. 4, 278–286. ( 10.1038/nchembio.85) [DOI] [PubMed] [Google Scholar]
- 8.Perkins A, Nelson KJ, Parsonage D, Poole LB, Karplus PA. 2015. Peroxiredoxins: guardians against oxidative stress and modulators of peroxide signaling. Trends Biochem. Sci. 40, 435–445. ( 10.1016/j.tibs.2015.05.001) [DOI] [PMC free article] [PubMed] [Google Scholar]
- 9.Arnold I, Wagner-Ecker M, Ansorge W, Langer T. 2006. Evidence for a novel mitochondria-to-nucleus signalling pathway in respiring cells lacking i-AAA protease and the ABC-transporter Mdl1. Gene 367, 74–88. ( 10.1016/j.gene.2005.09.044) [DOI] [PubMed] [Google Scholar]
- 10.Pray-Grant MG, et al. 2002. The novel SLIK histone acetyltransferase complex functions in the yeast retrograde response pathway. Mol. Cell. Biol. 22, 8774–8786. ( 10.1128/MCB.22.24.8774-8786.2002) [DOI] [PMC free article] [PubMed] [Google Scholar]
- 11.Jazwinski SM. 2013. The retrograde response: when mitochondrial quality control is not enough. Biochim. Biophys. Acta 1833, 400–409. ( 10.1016/j.bbamcr.2012.02.010) [DOI] [PMC free article] [PubMed] [Google Scholar]
- 12.Preuss J, et al. 2012. High-throughput screening for small-molecule inhibitors of Plasmodium falciparum glucose-6-phosphate dehydrogenase 6-phosphogluconolactonase. J. Biomol. Screen. 17, 738–751. ( 10.1177/1087057112442382) [DOI] [PMC free article] [PubMed] [Google Scholar]
- 13.Juhnke H, Krems B, Kotter P, Entian KD. 1996. Mutants that show increased sensitivity to hydrogen peroxide reveal an important role for the pentose phosphate pathway in protection of yeast against oxidative stress. Mol. Gen. Genet. 252, 456–464. ( 10.1007/BF02173011) [DOI] [PubMed] [Google Scholar]
- 14.Hagen T, Taylor CT, Lam F, Moncada S. 2003. Redistribution of intracellular oxygen in hypoxia by nitric oxide: effect on HIF1α. Science 302, 1975–1978. ( 10.1126/science.1088805) [DOI] [PubMed] [Google Scholar]
- 15.Unitt DC, Hollis VS, Palacios-Callender M, Frakich N, Moncada S. 2010. Inactivation of nitric oxide by cytochrome c oxidase under steady-state oxygen conditions. Biochim. Biophys. Acta 1797, 371–377. ( 10.1016/j.bbabio.2009.12.002) [DOI] [PubMed] [Google Scholar]
- 16.Liu Z, Butow RA. 1999. A transcriptional switch in the expression of yeast tricarboxylic acid cycle genes in response to a reduction or loss of respiratory function. Mol. Cell. Biol. 19, 6720–6728. ( 10.1128/MCB.19.10.6720) [DOI] [PMC free article] [PubMed] [Google Scholar]
- 17.Bunn HF, Poyton RO. 1996. Oxygen sensing and molecular adaptation to hypoxia. Physiol. Rev. 76, 839–885. [DOI] [PubMed] [Google Scholar]
- 18.Miceli MV, Jazwinski SM. 2005. Common and cell type-specific responses of human cells to mitochondrial dysfunction. Exp. Cell Res. 302, 270–280. ( 10.1016/j.yexcr.2004.09.006) [DOI] [PubMed] [Google Scholar]
- 19.Kwast KE, Lai LC, Menda N, James DT 3rd, Aref S, Burke PV. 2002. Genomic analyses of anaerobically induced genes in Saccharomyces cerevisiae: functional roles of Rox1 and other factors in mediating the anoxic response. J. Bacteriol. 184, 250–265. ( 10.1128/JB.184.1.250-265.2002) [DOI] [PMC free article] [PubMed] [Google Scholar]
- 20.Hermes-Lima M, Moreira DC, Rivera-Ingraham GA, Giraud-Billoud M, Genaro-Mattos TC, Campos EG. 2015. Preparation for oxidative stress under hypoxia and metabolic depression: revisiting the proposal two decades later. Free Radic. Biol. Med. 89, 1122–1143. ( 10.1016/j.freeradbiomed.2015.07.156) [DOI] [PubMed] [Google Scholar]
- 21.Dick TP, Ralser M. 2015. Metabolic remodeling in times of stress: who shoots faster than his shadow? Mol. Cell 59, 519–521. ( 10.1016/j.molcel.2015.08.002) [DOI] [PubMed] [Google Scholar]
- 22.Masselot M, De Robichon-Szulmajster H. 1975. Methionine biosynthesis in Saccharomyces cerevisiae. I. Genetical analysis of auxotrophic mutants. Mol. Gen. Genet. 139, 121–132. ( 10.1007/BF00264692) [DOI] [PubMed] [Google Scholar]
- 23.Thomas D, Surdin-Kerjan Y. 1997. Metabolism of sulfur amino acids in Saccharomyces cerevisiae. Microbiol. Mol. Biol. Rev. 61, 503–532. [DOI] [PMC free article] [PubMed] [Google Scholar]
- 24.Blacker TS, Mann ZF, Gale JE, Ziegler M, Bain AJ, Szabadkai G, Duchen MR. 2014. Separating NADH and NADPH fluorescence in live cells and tissues using FLIM. Nat. Commun. 5, 3936 ( 10.1038/ncomms4936) [DOI] [PMC free article] [PubMed] [Google Scholar]
- 25.Hung YP, Albeck JG, Tantama M, Yellen G. 2011. Imaging cytosolic NADH-NAD+ redox state with a genetically encoded fluorescent biosensor. Cell Metab. 14, 545–554. ( 10.1016/j.cmet.2011.08.012) [DOI] [PMC free article] [PubMed] [Google Scholar]
- 26.Zhao Y, et al. 2015. SoNar, a highly responsive NAD+/NADH sensor, allows high-throughput metabolic screening of anti-tumor agents. Cell Metab. 21, 777–789. ( 10.1016/j.cmet.2015.04.009) [DOI] [PMC free article] [PubMed] [Google Scholar]
- 27.Cameron WD, Bui CV, Hutchinson A, Loppnau P, Graslund S, Rocheleau JV. 2016. Apollo-NADP+: a spectrally tunable family of genetically encoded sensors for NADP+. Nat. Methods 13, 352–358. ( 10.1038/nmeth.3764) [DOI] [PubMed] [Google Scholar]
- 28.Winzeler EA, et al. 1999. Functional characterization of the S. cerevisiae genome by gene deletion and parallel analysis. Science 285, 901–906. ( 10.1126/science.285.5429.901) [DOI] [PubMed] [Google Scholar]
- 29.Taxis C, Knop M. 2006. System of centromeric, episomal, and integrative vectors based on drug resistance markers for Saccharomyces cerevisiae. Biotechniques 40, 73–78. ( 10.2144/000112040) [DOI] [PubMed] [Google Scholar]
- 30.Mumberg D, Muller R, Funk M. 1995. Yeast vectors for the controlled expression of heterologous proteins in different genetic backgrounds. Gene 156, 119–122. ( 10.1016/0378-1119(95)00037-7) [DOI] [PubMed] [Google Scholar]
- 31.Morgan B, Sobotta MC, Dick TP. 2011. Measuring E(GSH) and H2O2 with roGFP2-based redox probes. Free Radic. Biol. Med. 51, 1943–1951. ( 10.1016/j.freeradbiomed.2011.08.035) [DOI] [PubMed] [Google Scholar]