Fig. 1.
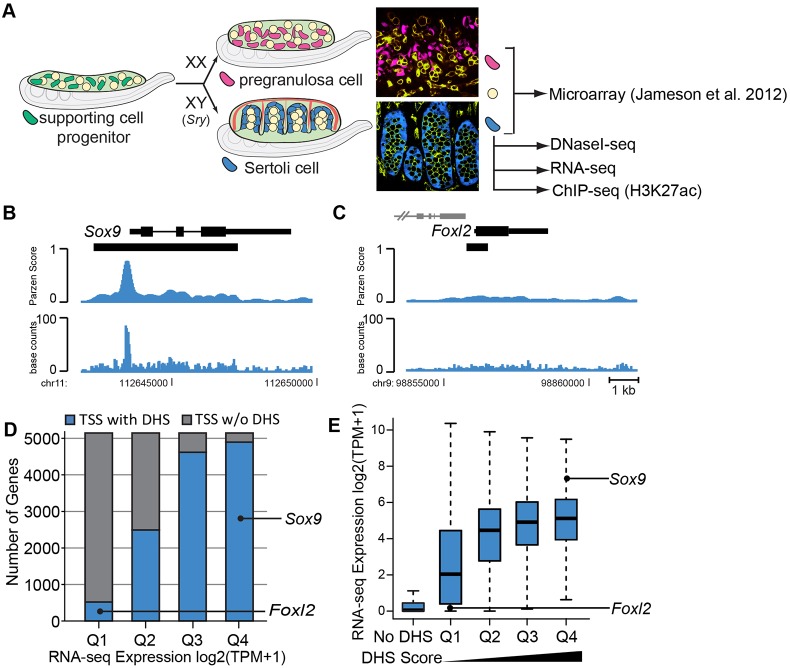
DNaseI-seq and RNA-seq analysis of Sertoli cells. (A) Overview of sex determination. At the bipotential stage (E11.5), XX and XY gonads are indistinguishable and contain a mixture of somatic and germ cells (yellow). The supporting cell lineage (green) gives rise to Sertoli cells of the testis (XY; blue) or pregranulosa cells of the ovary (XX; pink) upon sex determination. Confocal images show a whole-mount immunostained E13.5 ovary (top) and testis (bottom). XX pregranulosa cells express the Sry-eGFP transgene (Albrecht and Eicher, 2001) (pink), XY Sertoli cells express the Sox9-CFP transgene (blue; germ cells and vasculature are yellow/green). Microarray data were previously collected from FACS-isolated E13.5 pregranulosa cells, Sertoli cells and germ cells (Jameson et al., 2012b). DNaseI-seq was performed on FACS-isolated E13.5 and E15.5 Sertoli cells. RNA-seq was performed on E15.5 Sertoli cells. (B,C) DNaseI-seq data identified a strong DHS at (B) the Sox9 promoter (expressed in Sertoli cells) and a weaker DHS at (C) the Foxl2 promoter (repressed in Sertoli cells). Only peaks overlapping the TSS are shown and gene names are positioned adjacent to the TSS. Nearby genes are indicated in gray. Black bars under the gene indicate DHSs. The top track indicates the Parzen score, or DHS score, while the bottom track shows the smoothed base counts. (D,E) Comparative analysis of E15.5 DNaseI-seq and RNA-seq data. (D) RNA-seq data [log base 2 (transcripts per million (TPM+1))] from E15.5 Sertoli cells was divided into quartiles based on expression values [Q1, log2(TPM+1)=0-0.1; Q2, log2(TPM+1)=0.1-2.34; Q2, log2(TPM+1)=2.34-5.02; Q2, log2(TPM+1)=5.02-12.74]. The chart indicates the number of genes within each quartile that had an overlapping DHS (blue) or did not have an overlapping DHS (gray) at the TSS. (E) Genes with a DHS overlapping the TSS were divided into quartiles based on DHS scores (Q1-Q4, low to high DHS scores). The distribution of expression values for each group is shown as a boxplot (excluding outliers).

