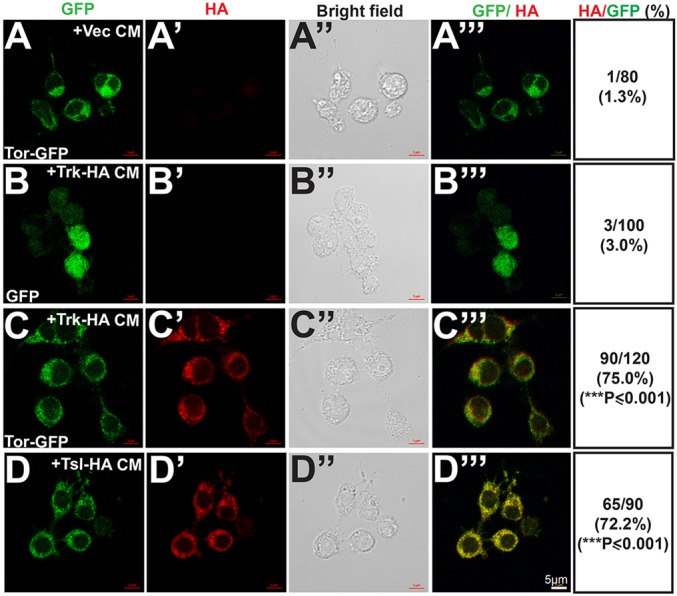
Fig. 7.

Tor-expressing cells take up Trk and Tsl. (A-D‴) Cells expressing Tor-GFP (A-A‴,C-E‴) or GFP alone (expressed by pAc5-STABLE1-Neo) (B-B‴) were exposed to CM obtained from cells expressing vector alone (A-A‴), Trk-HA (B-C‴) or Tsl-HA (D-D‴). The cells were imaged for GFP fluorescence (A-D) and stained with anti-HA antibody (A′-D′). Bright-field images (A″-D″) and overlays of GFP and anti-HA staining (A‴-D‴) are also shown. For each study, the proportion of GFP- or Tor-GFP-expressing cells that also exhibited staining with anti-HA are shown in the last column. For each treatment, cells counted are the total of three independent experiments (n=3). Statistical significance was calculated relative to Tor-GFP-expressing cells treated with CM from vector control transfected cells. ***P≤0.001.
