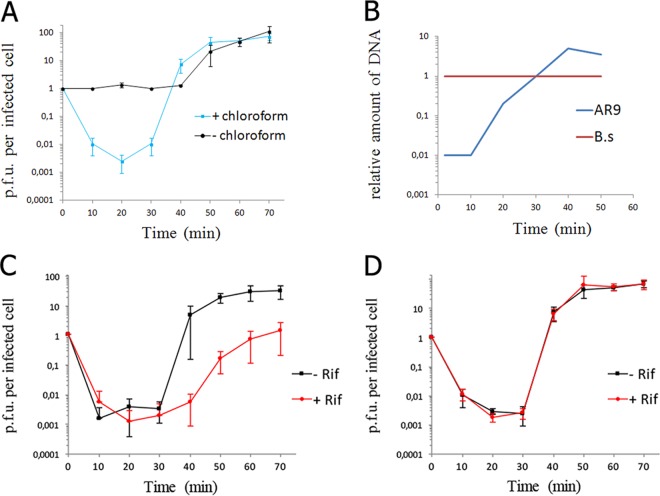
FIG 1 .
General properties of the AR9 infection process. (A) AR9 one-step growth curve on B. subtilis 168. The numbers of PFU per infected cell in chloroform-treated and untreated cultures are shown. (B) Accumulation of phage AR9 DNA during infection determined by qPCR analysis of DNA extracted at different time points after phage infection. The results obtained for the AR9 gene g283 and the B. subtilis (B.s) gene yoxA in three independent reactions are shown. (C) AR9 one-step growth curve in the presence of the host RNAP inhibitor rifampin (Rif). The culture was chloroform treated prior to PFU determination. (D) AR9 one-step growth curve on a B. subtilis 168 mutant resistant to rifampin in the presence of rifampin. The culture was chloroform treated. For every one-step growth curve, each data point is an average of three biological replicates; error bars indicate standard deviations.

