

Abstract
Many cancers including the late stage ones become drug-resistant and undergo epithelial-to-mesenchymal transition (EMT). These lead to enhanced invasion, migration, and metastasis toward manifesting its aggressiveness and malignancy. One of the key hallmarks of cancer is its overdependence on glycolysis as its preferred energy metabolism pathway. The strict avoidance of alternate energy pathway gluconeogenesis by cancer cells points to a yet-to-be hoisted role of glucocorticoid receptor (GR) especially in tumor microenvironment, where cells are known to become drug-sensitive through induction of gluconeogenesis. However, since GR is involved in metabolism, anti-inflammatory reactions, immunity besides inducing gluconeogenesis, a greater role of GR in tumor microenvironment is envisaged. We have shown previously that GR, although ubiquitously expressed in all cells; afford to be an effective cytoplasmic target for killing cancer cells selectively. Herein, we report the therapeutic use of a newly developed GR-targeted liposomal concoction (DXE) coformulating a lipophilic drug (ESC8) and an anti-Hsp90 anticancer gene against aggressive tumor models. This induced drug-sensitivity and apoptosis while reversing EMT in tumor cells toward effective retardation of aggressive growth in pancreas and skin tumor models. Additionally, the ESC8-free lipid formulation upon cotreatment with hydrophilic drugs, gemcitabine and doxorubicin, could effectively sensitize and kill pancreatic cancer and melanoma cells, respectively. The formulation-triggered EMT-reversal was GR-dependent. Overall, we found a new strategy for drug sensitization that led to the advent of new GR-targeted anticancer therapeutics.
Keywords: glucocorticoid receptor, Hsp90, EMT, tumor, drug-sensitivity, liposome
Graphical Abstract
1. INTRODUCTION
Among various treatments of cancer, small molecule chemotherapy and radiation therapy are the most used clinical modalities. These are clinically effective against many solid tumors, but these often cause collateral damage in noncancerous tissues and organs besides having limitation to target and treat metastatic and/or drug-resistant aggressive cancer. It is evident now that epithelial to mesenchymal transition (EMT) and hence cancer stem cell (CSC) like property critically influence cancer cells to invade/metastasize and acquire drug resistance. The drug-resistivity, excessive aggressiveness, and metastatic potential of pancreatic cancer (PC) cells are also largely related to these EMT-associated phenomena.1–4 In fact, chemotherapy and radiation therapy particularly fail in cancers as they acquire EMT and possess CSC-like self-renewing clones that lead to highly aggressive, heterogeneous cellular population with varied drug response.5,6 During EMT, cells show down-regulation of cell–cell adhesion promoting proteins (such as E-cadherin and β-catenin), whereas expressions of mesenchymal molecular marker proteins (such as vimentin, α-SMA, etc.) increase with gain in expressions of various related transcription factors such as Snail homologues, Twist, etc.7–10 Hence, targeting EMT to induce drug sensitivity and inhibit metastasis are key steps for successful containment of aggressive cancers such as PC. Therefore, such therapeutic strategies designed to primarily target these EMT-associated factors may yield therapeutic success against aggressive cancers. Among PC, there are subtypes such as PANC-1 and AsPC-1 that show elevated levels of EMT markers and are markedly resistant or easily develop resistance against conventional chemotherapeutics, such as taxol, EGFR-targeted therapy, gemcitabin, vincristine, 5-fluorouracil, and cisplatin.11–13 Logically in the given scenario, development of a new drug is of little use. For those PCs that has undergone EMT and developed drug resistance, it is a big and open challenge to develop new therapeutic strategies, which aim to increase sensitivity in cancer cells against existing drugs.
Glycolysis is the efficient energy-yielding process universally preferred by all states of cancer and their malignancies.14 The up-regulated glucose consumption is the hallmark phenomenon for cancer, wherein glycolysis increases accumulation of its main product pyruvate and subsequent byproduct, lactate in tumor microenvironment. The formation of lactic acid forces tumor cells to adapt to acidosis by increasing expression of various transporters, thereby playing vital role in evolving multidrug resistance in tumors.15–19 So, it is evident that cells in an aggressive tumor environment deduce the natural condition of drug resistance owing to their overdependence on glycolysis. However, to our knowledge no therapeutic strategy is known that utilizes the overabundance of synthesized lactate and pyruvate in tumor microenvironment. Classically, pyruvate and lactate are the starting material for another highly conserved energy metabolism pathway called gluconeogenesis, which is regulated by the nuclear hormone receptor (NHR), namely, glucocorticoid receptor (GR). Gluconeogenesis is energetically less favorable than glycolysis, so naturally cancer cells that are energy starved cannot favor gluconeogenesis over glycolysis. We hypothesize that if we efficiently target GR in general, triggering say, gluconeogenesis instead of glycolysis, cancer cells will undergo EMT reversal and become drug sensitive. However, since GR is involved in metabolism, anti-inflammation, and immunity responses besides triggering gluconeogenesis, selective targeting of GR leading to selective transcriptional regulation of glucocorticoid responsive genes is expected to have multitude of cellular effects simultaneously.
Heat shock protein 90 (Hsp90), a chaperone protein, while in association with other cochaperones helps in the stability and maturation of many proteins. Hsp90 is overexpressed in many cancers.20–22 Hsp90 chaperones many proteins that control cell survival, proliferation, and apoptosis. Clearly, inhibition of Hsp90 is a promising cancer therapeutic strategy. Over the past decades many small molecules such as, 17-AAG (tanespimycin) and 17-DMAG (alvespimycin), have been developed but exhibited limited efficacy and failed in clinical trial owing to their nonspecific toxicity, reduced bioavailability, solubility, etc.23–26 However, strategy to inhibit Hsp90 may be included for combination therapy. Number of studies indicated the use of Hsp90 inhibitors in combination with other anticancer drug toward treating different cancer cells.27–30 Therefore, targeted delivery of anti-Hsp90 therapeutics (e.g., small molecule drug inhibitors or anti-Hsp90 miRNA) in combination with an other anticancer drug will be very interesting and an advantageous approach over the conventional approach for treating cancer.
We have shown previously that GR, although ubiquitously expressed in all cells, can be selectively targeted using dexamethasone (Dex)-associated cationic liposomal delivery systems in cancer cells for therapeutic purposes.31,32 The vital heat shock protein for cancer, Hsp90, can also be selectively downregulated in tumor when targeted via expressed GR. As a result potent, antitumor activity was observed.32 Even using Dex-associated gold nanoparticle (Dex-GNP) we showed that GR is indeed a potential target for cancer.33 Recently, we developed an orally administrable, anticancer drug, ESC8 that has the ability to down-regulate mTOR pathway, target breast cancer cells of all stages and induce cisplatin-sensitization in breast tumor.34,35 Other analogues of ESC8 were also found to be equally potent.36 As liposomes are known systems for individual or simultaneous delivery of bioactive molecules such as drugs, genes, etc., we wanted to utilize this concept to develop a new formulation. Here, in this study, we report the development of a new lipid formulation, which is a concoction of our GR-targeting cationic lipid formulation, potent drug ESC8 and the anti-Hsp90 gene construct. The idea is to develop a new drug-sensitizing strategy to combat aggressive cancer by targeting and instigating GR. This we believe will establish the development of a new anticancer therapeutics.
2. MATERIALS AND METHODS
2.1. Chemicals and General Procedures
ESC8 was synthesized using the same procedure as described before.34 Gemcitabine was purchased from Eli Lily. Dexamethasone, cholesterol, and RIPA buffer were purchased from Sigma-Aldrich Co. (St. Louis, MO). All other chemicals, reagents, and organic solvents were purchased either from Sigma (St. Louis, MO, USA) or from Rankem Ltd. (Mumbai, India). They were used without further purification. Lipofectamine 2000 was bought from Invitrogen Corporation (Carlsbad, CA). Glucocorticoid receptor siRNA was purchased from Santa Cruz Biotech, and scrambled siRNA was purchased from Qiagen.
2.2. Antibodies
β-actin (8457S), p53 (2524S), ABCG2 (4477S), and Vimentin (5741S) antibodies were purchased from Cell Signaling Technology; E-cadherin (ab15148) and Hsp90 (ab13495) were purchased from Abcam; ABCG2 (NBp2-22124), E-cadherin (NBp2-19051), and SNAI 1 (NBp2-29626) were purchased from Novus Biologicals; anti-KDR/Flk-1/VEGFR2 (07-158) was purchased from Millipore; ID-1 (sc-488), SNAI 1(sc-271977), VE-cadherin (sc-9989), and secondary antibodies goat antirabbit IgG-HRP (sc-2030), goat antimouse IgG-HRP (sc-2005), goat antimouse IgG-PE (sc-3738), and goat antirabbit IgG-FITC (sc-2012) were purchased from Santa Cruz Biotechnology; goat antimouse IgG-Cy3 (111-165-003) was purchased from Jackson immunoresearch; goat antimouse IgG alkaline phosphatase (DC05L) and goat antirabbit IgG alkaline phosphatase (DC06L) were purchased from Calbiochem.
2.3. Different Plasmids Construct and Their Maxi-Preparation
pCMV-sport-β-gal and pCMV-luciferase were generous gifts from Dr. Nalam Madhusudhana Rao, Centre for Cellular and Molecular Biology, Hyderabad, India. Artificial miRNA plasmid constructs (amiR-Hsp90 or Hsp90), which contain Hsp90 micro-RNA gene, were made following the same method as described before.32 amiR-Hsp90, pCMV-SPORT-β-gal, and pCMV-luciferase plasmid were maxi-prepared by usual alkaline lysis procedure and purified by PEG-8000 precipitation. The purities of plasmids were checked by A260/A280 (1.7–1.9) and 1% gel electrophoresis.
2.4. Preparation of Liposomes
Liposomes were prepared according to previous protocol.31 The final molar ratios of the component in the DO liposome was 1:1, DODEAC/Chol; while in the DX liposome was 1:1:0.75, DODEAC/Chol/Dex. For the preparation of liposome containing hydrophobic ESC8 drug, ESC8 was added to the lipid mixture of DO or DX at 0.25 molar ratio to get the liposome DOE (DO/ESC8, 1:0.25 molar ratio) or DXE (DX/ESC8, 1:0.25 molar ratio). One millimolar liposome (with respect to cationic lipid) was used for all in vitro studies. For animal studies, 5 mM liposome (with respect to cationic lipid) was used and was dispersed in 5% glucose solution. To determine the encapsulation efficiency, ESC8-loaded liposome was centrifuged for 45 min at 5000 rpm to remove nontrapped ESC8, and then 200 μL of liposome was lysed by mixing with 800 μL of methanol. The solution was then passed through a 0.22 μm filter and analyzed by reversed phase-HPLC method with a UV detector (Varian Prostar 325, at a wavelength of 210 nm) using methanol–acetonitrile (80:20, v/v) as mobile phase. The drug encapsulation efficiency (EE%) was calculated using below formula:
2.5. Preparation of Lipid–DNA Complex and Its Treatment to Cells
The lipid-DNA complex or lipoplex was prepared as per previous literature.31 Briefly, for in vitro toxicity or transfection studies, 1 mM liposome were serially diluted in serum free media in final volume of 50 μL, and it was complexed with fixed amounts of pDNA (0.3 μg/well of 96 well plates), which diluted in 50 μL serum free media. The charge ratios of cationic lipid to DNA were maintained as 1:1, 2:1, 4:1, and 8:1. The lipid-DNA mixtures were shaken in room temperature for 15 min following of which 10% serum containing media (200 μL) were added to each mixture and subsequently used for the treatment. For RT-PCR and Western blot experiment cells were treated with lipoplex, carrying 2 μg of pDNA as a complex with liposome at 4:1 charge ratio (+/−), in each well of 6 well plates. For in vivo studies, the lipoplexes were formed in 5% glucose at 6:1 charge ratio (+/−), with a pDNA amount of 40 μg and the initial liposome concentration used was 5 mM.
2.6. Characterization of Liposomes
The size, zeta potential, and PDI of liposomes in plain DMEM and 10% serum containing DMEM; and size and zeta potential of lipoplexes [at lipid/DNA charge ratio (+/−) of 4:1] in plain DMEM and 5% and 10% serum containing DMEM, were measured with a Zetasizer 3000HSA (Malvern Instruments, UK). The sizes of liposomes and lipoplexes were calculated as an average of 10 measurements.
2.7. Cell Culture
Cell line representing human pancreatic ductal adenocarcinoma (AsPC-1, PANC-1, BxPC-3, MIA PaCa-2), mouse skin melanoma (B16F10) cell lines were purchased from the American Type Cell Culture (ATCC, USA); African Green monkey kidney cells (COS-1) were procured from National Centre for Cell Sciences (NCCS), Pune, India; Human Pancreatic Ductal Epithelial Cells (HPDEC) was a kind gift from Dr. Daniel D. Billadeau (Mayo Clinic, Rochester, USA). Except for HPDEC cell, grown in Keratinocyte-SFM media supplemented with 0.2 ng of EGF, 30 μg/mL bovine pituitary extract, and containing antimycol, and AsPC-1 cell line in RPMI 1640 containing 10% FBS (Lonza, USA) and 50 μg/mL penicillin, 50 μg/mL streptomycin, and 100 μg/mL kanamycin, all other cell lines were grown in Dulbecco’s modified Eagle’s medium (DMEM) containing 10% FBS (Lonza, USA), 50 μg/mL penicillin, 50 μg/mL streptomycin, and 100 μg/mL kanamycin at 37 °C in a humidified incubator containing 5% CO2. Cultured healthy cells of 80–85% confluency were used for all experiments. Cells were trypsinized, counted, and seeded in 6-well plates for RT-PCR studies, 96-well plates for cell viability studies, and 6-well or 25 cm2 tissue culture flasks for Western blot. The cells were incubated overnight before they were used for experiments.
2.8. Gene Transfections Using Luciferase Reporter Plasmid
Cells were seeded at a density of 12000 per well in a 96-well plate for 18–24 h before the transfection. Plasmid pCMV-luciferase (0.3 μg, 0.9 nmol) was complexed with DX liposome in serum free medium at 8:1, 4:1, 2:1 lipid-DNA (+/−) charge ratio. Forty-eight hours after the transfection, cells were subjected to lysis and assayed for luciferase activity with the luciferase reporter assay system (Promega) according to the manufacturer’s protocol. The luciferase activity per well was estimated using Centro LB 960 microplate luminometer (Berthold Technologies). The luciferase activity was expressed as the fold change scale while comparing with the RLU/mg protein value of Lipofectamine 2000.
2.9. Cell Cytotoxicity Studies
Cell viability was analyzed by MTS (3-(4,5-dimethylthiazol-2-yl)-5-(3-carboxymethoxyphenyl)-2-(4-sulfonyl)-112H-tetrazolium) assay (Promega, Madison, WI). Briefly, 5000 cells/well were plated in a 96-well plate with 100 μL of medium 18–24 h before experiment. Different treatment groups were prepared, and each treatment was done at triplicate wells continuously for 48 h. Following 48 h of treatment, 90 μL of MTS solution containing PMS (MTS/PMS = 20:1 vol. ratio) were added to each well, then the cells were incubated at 37 °C for 1 to 2 h, and the absorbance at 490 nm was determined using Spectra Fluor PLUS (Molecular Devices, Sunnyvale, CA). Results were expressed as percent viability = [A490(treated cells) − background/A490(untreated cells) − background]/100.
2.10. RNA Isolation and Quantitative PCR Analysis
Cells were seeded at a density of 2 × 10⁵ cells/well in a 6-well plate for 18–24 h before treatment. Cells were treated with different treatment groups keeping dexamethasone final concentration the same at 9 μM. After 36 h of treatment RNA was extracted using the RNeasy plus mini kit (Qiagen) followed with quantification and qualitative measurement spectrometrically (NanoDrop, Thermo scientific), and reverse transcription was done according the BioRad iScript cDNA synthesis kit following manufacturer’s protocol. Real Time-PCR was carried out by using the Qiagen Quantifect SYBR Green PCR kit and the Applied Biosystems 7500 real-time PCR system (Applied Biosystems, Foster City, CA). GAPDH, ABCG2, and Hsp90 Primers were purchased from Integrated DNA Technologies.
Primers Sequence
-
Human GAPDH:
Forward: 5′-TGGTGTTTCCTTGTGACACTG-3′
Reverse: 5′-TGAGCCTTTGGTTAAGACCG-3′
-
Human ABCG2:
Forward: 5′-TTGAGGTCAATGAAGGGGTC-3′
Reverse: 5′-GAAGGTGAAGGTCGGAGTCA-3′
-
Human Hsp90:
Forward: 5′-TCTGGAAGATCCCCAGACAC-3′
Reverse: 5′-AGTCATCCCTCAGCCAGAGA-3′
2.11. Western Blot
For this experiment, AsPC-1, PANC-1, and B16F10 cells were treated with different treatment groups keeping dexamethasone concentration (9 μM) the same in all treatment groups. For in vitro whole cell lysate, after 48 h of continuous treatment cells were first washed with cold PBS for two times, lysed with ice-cold RIPA lysis buffer (50 mM Tris [pH 7.5], 1% NP-40, 150 mM NaCl, 0.1% sodium dodecyl sulfate [SDS], 0.5% sodium deoxycholate) with 1% protease inhibitor cocktails (PIC) (Cell Signaling Technology), by incubating on ice for 30 min, and centrifuged at 14,000 rpm at 4 °C for 15 min. Supernatant was collected, and protein concentration was measured by Bradford method (Bio-Rad Protein Assay). For in vivo whole cell lysate, after completion of the in vivo experiment, one C57BL/6J and two SCID mice with representative tumor size from each group was sacrificed and tumor was collected, lysed by ice-cold RIPA buffer with 1% PIC, whole cell lysate was prepared following the same steps as mentioned above. Respective cell lysates were run in SDS-PAGE gel (8%–15%) and then the bands were transferred to polyvinylidene fluoride (PVDF) membrane.
For AsPC-1, PANC-1 in vitro, and AsPC-1 in vivo cell lysate, membranes were probed with primary antibodies and then incubated with HRP-conjugated goat antimouse IgG and/or HRP-conjugated goat-antirabbit secondary antibody. Immunodetection was performed with the Super Signal West Pico Substrate (Thermo Scientific, Rockford, IL). For B16F10 in vitro and in vivo cell lysate, antibody-reactive bands were detected by BCIP/NBT substrate (Sigma-Aldrich) as alkaline phosphates conjugated secondary antibodies (goat-antirabbit and goat-antimouse) were used.
2.12. Drug Sensitivity Assay
Briefly, 5000 cells/well (AsPC-1 and B16F10) were seeded in 96-well flat-bottom plates with 100 μL of medium. After 18–24 h, AsPC-1 cells were either kept untreated or treated with DX liposome and DX-Hsp90 lipoplex (amiR-Hsp90 used 0.3 μg/well) for 24 h, and B16F10 cells were either kept untreated or treated with DX liposome, DX-Hsp90 lipoplex, DX-Cont lipoplex, DO-Hsp90+Dex (i.e., DO-Hsp90 lipoplex along with DX equivalent amount of dexamethasone) for 24 h. Following 24 h of treatment, media was removed and washed twice with PBS, then cells (AsPC-1 and B16F10) were incubated with variable concentrations of gemcitabine (for AsPC-1 cell), doxorubicin (for B16F10 cell), and ESC8 (For AsPC-1 and B16F10) for additional 48 h. At the end of the treatment period, viability was determined by the MTS assay.
2.13. In Vivo Tumor Model
For melanoma model, 6 to 8 week old female C57BL/6J mice, obtained from NIN (Hyderabad, India), were subcutaneously inoculated with 2.5 × 10⁵ B16F10 cells in the lower left abdomen. Eleven days following B16F10 cell implantation, mice were randomly grouped and respective treatment was started. Each of the treatment groups contained 5 mice.
Pancreatic cancer orthotopic model was established by orthotopicaly injecting 1 × 10⁶ luminescent AsPC-1 (AsPC-1-Luc) cells, resuspended in 100 μL of PBS, into the pancreas of the 4 to 6 week old female SCID mice (Charles River Laboratories). Five days after inoculation of cells, the mice were imaged with the IVIS Imaging System 200 (Xenogen Corp.) and were randomly assigned four groups with each group having 5 mice. Seven days after cell implantation treatment was started. The groups were as follows: (a) group treated with 5% glucose and (b) group intraperitoneal injected with either 40 μg Hsp90 plasmid associated DOE (DOE-Hsp90), or (c) 40 μg β-gal plasmid associated DXE (DXE-Cont), or (d) 40 μg of Hsp90 plasmid associated DXE (DXE-Hsp90). For in vivo tumor regression study, 6:1 charge ratio cationic lipid to DNA was used. Six intraperitoneal injections with a gap of 1 to 2 days were administered. Tumors were monitored by measuring size for B16F10 tumor and for AsPC-1 tumor by measuring luminescent imaging. The tumor sizes were expressed in volume (mm3) and calculated by using the formula (0.5 × a × b2), where a and b represent the longest and the shortest dimension of the tumors, respectively. AsPC-1 tumor experiment was terminated on day 35 from the date of tumor cell inoculation. B16F10 s.c. tumor experiment was terminated when tumor volume of the untreated group reached ~3500 mm3. All animal work was conducted under protocols approved by Institutional Animal Ethical Committee of CSIR-IICT, India, and Mayo Clinic, USA.
2.14. TUNEL Assay and Immunohistochemistry
After completion of the melanoma model based in vivo study, one mouse from each group was sacrificed for histological study. The tumors were frozen in Jung tissue freeze medium (Leica Microsystem, Germany) followed by cryo-sectioning of 10 μm thin sections using Leica CM1850 cryostat (Germany). The sections were fixed into 4% formalin for 15 min and TUNEL assayed using Dead-End fluorometric apoptosis detection kit (BD Biosciences) as per manufacturer’s protocol. The same cryosections were washed with PBS and incubated for 2 h at 4 °C with VE-cadherin mouse monoclonal antibody at 1:200 dilutions (Santa Cruz Biotech.) for blood vessel staining, followed by 1 h incubation with goat antimouse IgG-PE (Santa Cruz Biotech.) secondary antibody. Then the doubly stained tissues were mounted with 4′,6-diamidino-2-phenylindole (DAPI)-containing mounting medium, and images were captured in Nikon TE2000E microscope at 10× magnification. Quantitative representation was done as percentage of DAPI- positive cells stained with TUNEL (for TUNEL-positive cells) or VE-cadeherin (for VE-cadherin positive cells). For each treatment group, five random images were taken and each image was analyzed ten times.
For Ki-67 staining, first tissue sections were incubated with mouse antirabbit Ki-67 antibody (1:200, Thermo Scientific) and then stained with Cy3-conjugated goat antimouse secondary antibody (1:200, Jackson immunoresearch). The Ki-67 stained tissues were then mounted with DAPI containing mounting medium and observed under Nikon TE2000E microscope at 10× magnification. The Ki-67 staining index (SI) was represented as the percentage of DAPI-positive cells expresses Ki-67. For all histological analysis, related quantifications were done by taking five random images from each treatment group and each images was analyzed ten times.
2.15. Tissue-Specific Transfection Study in AsPC-1 Xenograft
To determine the tissue-distribution profile of luciferase expression, AsPC-1 tumor model was used. Twenty days after AsPC-1 cell inoculation, three mice were intraperitoneal injected with 40 μg of plasmid of pCMV-luciferase associated DXE liposome (DXE-luciferase lipoplex). Twenty-four hours after the in vivo transfection, cells were subjected to lysis and assayed for luciferase activity with the luciferase reporter assay system (Promega) according to the manufacturer’s protocol. To determine the tissue-distribution of the luciferase expression, mice were humanely sacrificed by cervical dislocation, and their tumors and organs were dissected. Tissue samples from tumors and major organs, including the pancreas, lung, heart, liver, spleen, and kidney, were harvested and homogenized. The luciferase activity of each cell lysate was determined, and the corresponding protein concentrations were measured by Bradford method (Bio-Rad Protein Assay). The luminescence results were reported as relative light units (RLU) per mg protein.
2.16. Glucocorticoid Receptor Down-Regulation
Glucocorticoid receptor down-regulation by siRNA was performed following similar protocol described earlier.31 In brief, 2 × 10⁵ B16F10 cells/well were seeded in 6-well plates. After 24 h incubation, cells were either kept untreated or transfected with 40 pmol of glucocorticoid receptor-siRNA (Santa Cruz Biotech) and 40 pmol of scrambled siRNA (Qiagen) (diluted to 50 μL with serum-free DMEM) using 4 μL of Lipofectamine-2000 (Invitrogen) (diluted to 50 μL with serum-free DMEM). After 4 h another 2 mL of complete DMEM media was added and incubated for additional 24 h. Following 24 h after transfection, cells were harvested, counted, and again seeded in 6-well plates at a 2 × 10⁵ cells/well density for Western blot analysis. After 16 h of incubation, cells were treated with different treatment groups, keeping dexamethasone concentration (9 μM) fixed, for 48 h. After 48 h cells were lysed, and subsequent Western blot analysis (as described earlier) was done for E-cadherin and Vimentin along with GR to confirm the GR knockdown.
GR siRNA (cat no 35505); It is a pool of three different siRNA duplexes:
GGCUUCAGGUAUCUUAUGATTUCAUAAGAUACCUGAAGCCTT
CCAAGAGCUAUUUGAUGAATTUUCAUCAAAUAGCUCUUGGTT
CCAAGAGCUAUUUGAUGAATTUUCAUCAAAUAGCUCUUGGTT
Control siRNA (Qiagen Inc.)
UUCUCCGAACGUGUCACGUTTACGUGACACGUUCGGAGAATT
2.17. Statistical Analysis
Data were presented as mean ± SD. Statistical analysis of the samples were performed using a one-way analysis of variance (ANOVA), using GraphPad Prism software (version 5.03) and P-values < 0.05 were considered to be statistically significant.
3. RESULTS
3.1. Development of Formulations and Their Characterization
We developed the dexamethasone associated cationic lipid formulations, DX and DXE, by simply associating cationic lipid (here, DODEAC), dexamethasone, cholesterol, and hydrophobic anticancer drug ESC8. For DXE formulation, all four components were taken (Scheme 1), whereas DX formulation did not contain ESC8. We also made two control formulations DO and DOE. DO contained only cationic lipid and cholesterol. DOE contained all the components of DXE but without dexamethasone. We then checked for their size, PDI, and zeta potential in the presence and absence of serum. We additionally checked the respective size and zeta potential of DX, DXE, and DOE liposome-DNA complex (or, lipoplex) in different serum concentration to find out the effect of serum on lipoplex. Table S1 shows that all liposomes have positive potential in absence of serum, which makes them better candidates for the formation of lipoplex with negatively charged plasmid. All liposomes and lipoplexs tend to have smaller sizes in the presence of serum and showed negative zeta potential in the presence of serum (Table S1, Figure S1). This data was important to know because for all cell culture experiments with liposomes or lipoplexes we used serum-containing media. Further, using HPLC analyses we calculated ESC8 entrapment efficiency of 86.35 ± 5.15% and 84.76 ± 8.08%, respectively, for DXE and DOE formulations.
Scheme 1.

(A) Scheme Model of Liposome and Lipoplex Formulation of DXE:Liposome Formation through Lipid Film Hydration Method by Using DODEAC, Cholesterol, Dexamethasone, and ESC8 in the Mole Ratios of 1:1:0.75:0.25; (B) Scheme Model of Typical Liposomal Bilayer and Lipoplex: Presentation of Typical Liposomal Bilayered Structure in Which the Hydrophobic Drug ESC8 Is Confined; Formation of Lipoplex through Electrostatic Interaction between Cationic Liposome with Plasmid DNA
3.1.1. Transfection Efficiency of Dexamethasone-Associated DX Lipoplex Is Significantly More in Cancer Cells than in Noncancer Cells
To check the transfection efficiency, DX liposome was first complexed with luciferase expressing reporter gene in different charge ratios and treated to the cancer (AsPC-1, PANC-1, B16F10) and noncancer (HPDEC, COS-1) cells. The data in Figure 1A shows that the transfection of the DX liposome in pancreatic cancer cells (AsPC-1, PANC-1) and melanoma cells (B16F10) are 2- to 3-fold more efficient than regularly used transfecting agent Lipofectamine-2000. However, transfection efficiency of DX liposome in noncancerous cell (HPDEC, COS-1) was less compared to lipofectamine-2000. As expected, DO liposome, which is devoid of dexamethasone, showed less transfection efficiency in cancerous cells compared to the DX liposome but induced comparable transfection in noncancerous cell (HPDEC, COS-1). This result clearly corroborates our earlier result reflecting that the Dex containing DX liposome possibly utilizes cancer cell-associated GR for efficient transfection of cancer cells.20
Figure 1.

(A) In vitro transfection efficiencies in cancer (AsPC-1, PANC-1, B16F10) and noncancer (HPDEC, COS-1) cells after 48 h of continuous treatment using 0.3 μg of pCMV-luciferase plasmid either as DX (black bar) or DO (gray bar) lipoplex at 4:1 charge ratio (cationic lipid/DNA) except B16F10 where charge ratio was maintained at 2:1, lipofectamine-2000/0.3 μg of same plasmid also used for positive control. (B) Viability studies of cancer cells (AsPC-1, PANC-1, B16F10) and noncancer cell (COS-1) after 48 h of continuous treatment with ESC8 (E, black bar), DX (gray bar), and DXE (white bar) where ESC8 concentration was maintained at 7 μM except B16F10 where 3.5 μM ESC8 was taken. (C) Viability studies with the same set of cells when treated with either DX liposome (black bar), or DX-Control (DX-Cont, gray bar), and DX-Hsp90 lipoplex (white bar) carrying 0.3 μg of respective plasmid maintaining charge ratios (+/−) of 4:1 in all cell line apart from B16F10 where it was maintained at 2:1. (D) Viability of different cells in the presence of DXE liposome (black bar), DXE-Cont lipoplex (gray bar), and DXE-Hsp90 lipoplex (white bar), at ESC8 concentration of 7 μM (3.5 μM for B16F10) and carrying 0.3 μg of respective plasmids in lipoplexes maintaining a charge ratio (+/−) of 4:1 (2:1 charge ratio for B16F10). The results are obtained from the average of triplicate treatments. * denotes p < 0.001, # denotes p < 0.01, and + denotes p < 0.05.
3.2. Simultaneous Cellular Delivery of Liposome-Associated ESC8 Drug and amiR-HSP90 Plasmid
3.2.1. DX-Liposome Associated ESC8 (DXE) Has Limited Anticancer Efficacy
ESC8, a hydrophobic anticancer drug, was first encapsulated in the GR-targeted cationic DX liposome to form DXE liposome. Cellular viability assay result in treated cancer cells shows that both DX and ESC8 individually did not affect cell viability, whereas a combined DXE formulation reduced the viability of B16F10 (Figure 1B), BxPC-3, and MIA PaCa-2 (Figure S2A) among different cancer cells tested. However, cancer cells like AsPC-1 and PANC-1 and noncancerous cell COS-1 remained largely unaffected by DXE treatment (Figure 1B). This shows that DXE alone is not competent to kill all cells tested.
3.2.2. DX-Lipoplex Exhibits Anticancer Efficacy
The anticancer gene amiR-Hsp90 was also separately complexed with DX formulation to test if the plasmid has its individual anticancer efficacy in pancreatic cancer cells. The DX-lipoplex containing this anticancer gene has been previously shown to exhibit excellent antitumor activity in mouse melanoma model.32 The resulting lipoplex along with other treatment groups were treated to different cancer cells for 48 h. DX liposome had no effect on viability of cancer cells tested, but interestingly, when DX liposome was exposed to the cells in the lipoplex form (i.e., in association with amiR-Hsp90 or control plasmid), the lipoplex could reduce cellular viability (Figure 1C). We also observed that DX complexed with control plasmid of amiR-Hsp90 also showed similar level of cytotoxicity in AsPC-1, PANC-1 (Figure 2C), and MIA PaCa-2 (Figure S2B) cells, possibly because of the presence of lipoplex (and not liposome)-bound Dex, a GR synthetic ligand with known anticancer effect. Although we failed to show any additional effect of amiR-Hsp90 over control plasmid in AsPC-1 and PANC-1 cells but when we tested those lipoplexes in freshly isolated B16F10 cells from tumor, amiR-Hsp90 plasmid bound DX lipoplex showed significant amount of toxicity (56% viable cell) compared to control plasmid-bound DX lipoplex (76% viable cell). This difference of toxicity was also evident in BxPC-3 cells (Figure S2B). However, these lipoplexes did not show any significant killing in noncancerous cells, COS-1. Further, we find that lipoplexes with preformulated dexamethasone (as in DX) has the ability to induce selective and enhanced toxicity in cancer cells than when dexamethasone is added extraneously to preformed lipoplexes (Figure S2E and Figure 1C).
Figure 2.

(A) Western blot study of MET related marker and ABCG2 protein in AsPC-1 cell following 48 h of continuous treatment with dexamethasone (Dex), DX liposome, DX-control (DX-Cont), DX-Hsp90, and DO-Hsp90 lipoplexes. UT denotes untreated group where lipoplex treatment was done at 4:1 (+/−) charge ratio keeping dexamethasone concentration the same in all treatment groups. (B) Fold change in the E-cadherin and ABCG2 protein expression level. (C) Hsp90 protein expression level after 72 h of treatment. (D) Hsp90 protein expression level after 72 h of treatment. (E) Expression of E-cadherin and Hsp90 protein in B16F10 cell after 48 h of continuous treatment. (F) Fold change in E-cadherin and Hsp90 level after 48 h of treatment. * denotes p < 0.05 and ** denotes p < 0.01 while comparing with untreated group (UT).
3.2.3. Combination Effect of ESC8 and amiR-Hsp90 in DX Liposome
As shown above, DX-amiR-Hsp90 lipoplex exhibited some cytotoxic effect on cancer cells, whereas DXE had very limited anticancer effect in most pancreatic cancer cells. To get the collective effect of ESC8 drug and amiR-Hsp90, we codelivered both ESC8 and amiR-Hsp90 via DX delivery system. Hence, DXE (liposomal formulation containing DX and ESC8) was electrostatically complexed with amiR-Hsp90 plasmid in various charge ratios (+/−). The resultant lipoplex is henceforth represented as DXE-Hsp90. We show here the effect of lipoplex maintaining 4:1 cationic lipid to DNA charge ratio (+/−) apart from B16F10 cells where we maintained the charge ratio at 2:1. We found that combined effect reduced cell viability of cancer cells significantly when compared to individual effects of only DXE or DX-Hsp90 on cellular viability (Figure 1D). However, when DXE was treated in the lipoplex form irrespective of the plasmid used (Hsp90 or control plasmid), it showed substantial amount of cell killing (Figure 1D and Figure S2C) in all cancer cells, which indicate that DXE could serve as better anticancer material in the lipoplex form. In this MTS based cellular viability assay we failed to see any clear difference in cytotoxicities between lipoplexes containing anticancer gene or the control gene apart from freshly isolated B16F10 cells where DXE-Hsp90 lipoplex (14% viable cell) induces significantly more cell death compared to DXE-control amiR-Hsp90 lipoplex [henceforth represented as DXE-Cont] (39% viable cell). Additionally, we find out that DXE-Cont or DXE-Hsp90 demonstrate not more than 20% toxicity toward noncancerous cells like COS-1 (Figure 1D).
To show the additional effect of ESC8, we further compared the toxicity effect of DX-Hsp90 with DXE-Hsp90 in different cell lines (Figure S2D). This comparison shows that AsPC-1, B16F10, and MIA PaCa-2 cells were killed more efficiently with DXE-Hsp90 treatment than DX-Hsp90 treatment, justifying the use of ESC8 drug along with the anti-Hsp90 plasmid. However, similar kind of trend was not found in PANC-1 and BxPC-3 cells.
3.3. Dexamethasone Induces Mesenchymal to Epithelial Transition (MET)
Mesenchymal-to-epithelial transition (MET) is a reverse phenomenon of EMT (epithelial-to-mesenchymal transition). In MET, mesenchymal cells revert back to epithelial cell characteristics. MET is characterized by changes in cell morphology, the formation of tight junctions, and increase in expression of cell-to-cell adhesion marker like E-cadherin or decrease in EMT marker such as vimentin. As MET is a reverse process for EMT, MET is associated with decreased expression of mesenchymal markers such as fibronectin, vimentin, N-cadherin, inhibitor of DNA-binding protein (ID-1), and SNAI-1. As EMT is a distinguishing hallmark for tumor metastasis, factors that are linked to mesenchymal conditions are logically up-regulated.
3.3.1. Effect of Dexamethasone Associated Treatment on E-Cadherin
To assess the effect of dexamethasone on the MET, AsPC-1 cells were treated with different treatment groups. As DX-mediated simultaneous delivery of ESC8 and genes induces high levels of cancer cell killing, we opted not to use ESC8 among the treatment groups in the current cellular studies. Following the treatment of different DX lipoplexes to AsPC-1, Western blot analyses of respective cellular lysates were done and result showed that dexamethasone associated treatment groups (treatments such as dexamethasone, DX, and lipoplexes, DX-Cont and DX-Hsp90) exhibited significant surge in the respective E-cadherin expression levels (Figure 2A). However, DO lipoplex (i.e., treatment of DO-Hsp90) that lacks dexamethasone did not show any change in the E-cadherin level compared to untreated group (UT). This result was well supported by decrease in the expression level of SNAI-1, a transcriptional repressor of E-cadherin (Figure 2A). Consistent with this observation, Dex or DX liposomes (with or without amiR-Hsp90 or control plasmid) also suppressed the expression level of ID-1. However, similar kind of elevation of E-cadherin expression with DX-lipoplex treated group was also evident in B16F10 cell (Figure 2E). Together these data indicate that dexamethasone promotes MET process in pancreatic cancer cells.
3.3.2. Effects on ABCG2
ABCG2 or ATP binding cassette subfamily G member 2 is one of the ATP-binding cassette transporters, which is primarily implicated in imparting breast cancer resistance to anticancer drug. It is also demonstrated by Honorat et al.37 that the expression of ABCG2 protein is strongly inhibited by dexamethasone (Dex) in breast cancer cells, toward this we intended to extend this idea in pancreatic cancer cells; hence, we evaluated the protein status of ABCG2 in AsPC-1 (Figure 2A) and PANC-1 (Figure S3C) cells after 48 h of treatment. The result shows that Dex only in the lipoplex forms significantly inhibits the expression level of ABCG2 protein both in the AsPC-1 and PANC-1 cell. However, after 36 h, m-RNA level of ABCG2 in AsPC-1 cell is decreased in all Dex bound treatment groups (Figure S3B).
3.3.3. DX-Hsp90 Lipoplex Mediates Silencing of Hsp90 Expression
To determine whether the delivered amiR-Hsp90 plasmid could mediate silencing of Hsp90 expression in AsPC-1 and B16F10 cells, we performed Western blot analysis of cellular lysates obtained from different treatment groups. We found that in B16F10 cells, after 48 h of treatment, the expression of Hsp90 protein cells is decreased significantly in DX-Hsp90 treated group (Figure 2E). Similar trend was also found in the m-RNA level of AsPC-1 cells after 36 h (Figure 2D). However, we failed to reproduce the same result in the protein level after 48 h in AsPC-1 (Figure S3A) but got similar kind of Hsp90 down regulation after 72 h (Figure 2C). The decrease in Hsp90 level could be found within 48 h post-transfection in PANC-1 cells [data not shown].
3.4. DX-Mediated Sensitization of Cancer Cells toward Anticancer Drug
Driven by the inhibition effect of DX liposomal formulation on multidrug resistant protein ABCG2, we thought to check the drug sensitization aspect of DX liposomal system through viability assay. For this experiment first B16F10 or AsPC-1 cells were treated with DX and DX lipoplex for 24 h followed by drug treatment (ESC8 or Doxorubicin for B16F10 and ESC8 or Gemcitabine for AsPC-1) for another 48 h. In B16F10 cells with ESC8 (Figure 3A), although DX pretreated group did not show any significant reduction on IC50 value (IC50 value 3.73 μM) compared to only ESC8 treatment group (IC50 value 4.5 μM), DX-Hsp90 and DX-Cont pretreated groups lead to almost 4-fold and 1.5-fold reduction in IC50 value (IC50 value for DX-Hsp90 and DX-Cont pretreated groups are 1.2 and 2.8 μM, respectively) compared to only the ESC8 treatment group, respectively. When we used hydrophilic drug Dox (doxorubicin) in B16F10 cells (Figure 3B), both DX and DX-Cont pretreated group is able to reduce the IC50 value by ~1.8-fold compared to only Dox treated group (IC50 value 2.37 μM) but the DX-Hsp90 pretreated group results in huge reduction in IC50 value almost 8-fold reduction (IC50 value 0.36 μM). However, DX-Hsp90 pretreated group induces significantly more toxicity in B16F10 cells compared to DX-Cont pretreated group at any given concentration of ESC8/Dox (at 1 μM p < 0.05 and p < 0.001 for ESC8 and Dox, respectively). We also check the drug sensitization effect of DO-Hsp90 in combination with naked dexamethasone group (DO-Hsp90 + Dex) toward ESC8 and Dox drug in B16F10 cell, but DO-Hsp90 + Dex pretreated group failed to show any significant reduction in viability compare to only drug treated group (Figure S4).
Figure 3.
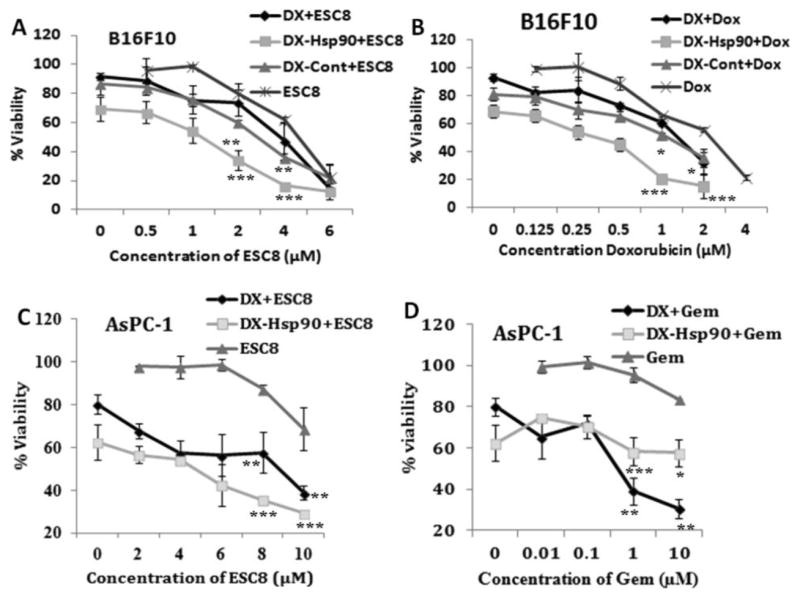
DX formulation sensitizes (A) ESC8 and (B) Dox (doxorubicin) anticancer drug toward B16F10 cell and the same experiment done with AsPC-1 cell where (C) ESC8 and (D) Gem (gemcitabine) were taken. First, cells were either kept untreated or treated for 24 h with DX liposome, DX-Hsp90, and DX-Cont (only for B16F10). Then respective drugs were treated for the next 48 h following cells that were assayed for viability by MTS. * denotes p < 0.05; ** p < 0.01; *** p < 0.001 while comparing with corresponding concentrations of ESC8 or Gem.
Additionally we check the drug sensitization effect in AsPC-1 cell. Herein, the DX and DX-Hsp90 pretreated group showed a huge decrease in the IC50 value in comparison to “only drug” treatment group (Figure 3C,D). This is possibly due to the fact that pretreated DX slows down the drug efflux machinery of the multidrug resistant cancer cell by down regulating drug transporter protein like ABCG2. This result provided a possible application of DX formulation as a sensitizer for cancer cells treated with even hydrophilic drugs.
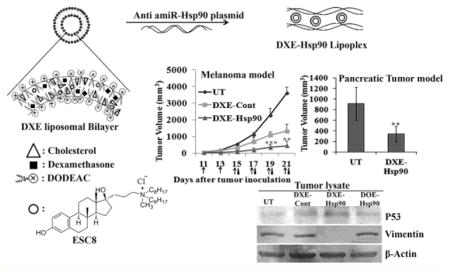
3.5. Antitumor Effect of DXE-amiR-Hsp90 in Orthotopic Pancreatic Tumor Model
3.5.1. Tissue Specific Transfection of DXE-Lipoplex in Pancreatic Tumor Model
To estimate the tissue distribution profile of DXE-lipoplex in terms of its ability to transfect vital organs and tumor, luciferase reporter gene containing DXE lipoplex was intraperitoneally injected in pancreatic tumor bearing mice. Following 24 h of injection, we determined the luciferase gene expression levels in tumors and other vital organs. The result shows that luciferase expression in tumor was substantially high compared to other organs (Figure 4A). This result favorably predicts that there will be minimal issue of any possible nonspecific toxic effects in nontumorigenic organs while codelivering drug cargo toward treating tumor mass.
Figure 4.

(A) In vivo transfection profiles of the DXE lipoplex in different mouse organs: Each mouse was intraperitoneally injected with 40 μg of pCMV-luciferase complexed with DXE liposomes at 6:1 (+/−) charge ratio. Luciferase activities for different organs were measured 24 h postinjection. (B) Tumor-volume curve of indicated treatment group after sacrificing the mice on 35th day from the day of orthotopic implantation of 1 × 10⁶ AsPC-1 cell in the pancreas of SCID mice. From day 7 post-AsPc-1 inoculation, mice were intraperitoneal injected either with 5% glucose (UT) or with respective lipoplexes DXE-Hsp90, DOE-Hsp90, and DXE-Cont. Lipoplex for each injection was formed with 40 μg of respective plasmid at 6:1 lipid/DNA charge ratio in 5% aqueous glucose solution. Total 6 injections were given with 2 days of interval. ***, p < 0.001; *, p < 0.05; +, p > 0.05 while comparing with UT group. (C) Western blot analysis of tumor lysates obtained from mice of respective untreated or treated groups: Differential expression of E-cadherin and VEGFR2 protein are shown.
3.5.2. Antitumor Effect of Delivering DXE-Hsp90 to Xenograft Pancreatic Tumor Model
In order to establish the combined effect of amiR-Hsp90 and ESC8 drug in tumor model, we first developed an orthotropic xenograft pancreatic tumor model with GFP/luciferase expressing AsPC-1 cell. Following tumor cell implantation and after 7 days, mice were intraperitoneally injected with DXE complexed with amiR-Hsp90 or control Hsp90 plasmids. A group of mice were also injected with nontargeted DOE lipoplex system. After 35th day, since orthotopic inoculation of AsPC-1 cells when all the mice in untreated group showed confirmed symptoms of mortality, experiment was terminated. Mice in all the groups were sacrificed and pancreatic tumors of all mice in respective groups were isolated and compared. Results demonstrated in Figure 4B show that mice treated with DXE-Hsp90 lipoplex showed 63% decrease in comparison to tumors in untreated group (p < 0.001). Interestingly, nontargeted DOE-Hsp90 also reduced tumor volume but only by 40% with respect to tumors in untreated group (p > 0.05). Importantly, the difference in tumor volumes between these two treatment groups, which was slowly widening, could have been more if the experiment was continued for few more days, but unfortunately, we stopped the experiment as only the mice in the untreated group started showing signs of morbidity. Reduction in tumor-volume in DXE-Cont treatment group was also statistically significant with respect to that of untreated group (p < 0.05). It is evident that statistically DXE-Hsp90 imparted better antitumor effect than DXE-Cont when respectively compared with untreated group. Taken together, this tumor regression data exhibited that DXE-Hsp90 has more pronounced pancreatic tumor growth inhibition effect compared to that observed with other treatment groups.
3.5.3. DXE-Hsp90 Induces EMT-Reversal and Reduces VEGFR2 in Pancreatic Tumor Mass
Earlier we witnessed the DX-lipoplex mediated down-regulation of SNAI-1, the transcriptional repressor of E-cadherin in cultured AsPC-1 cells. The significantly reduced orthotopic pancreatic tumor mass in DXE-Hsp90 propelled us to check if the reduction in tumor-aggressiveness is due to reduction in mesenchymal properties, or in other words, reversion of EMT. We find clear up-regulation of the hallmark of MET (or EMT reversal), i.e., E-cadherin level in only tumors of mice treated with DXE-Hsp90 (Figure 4C). Simultaneously, as it is known that aggressiveness in tumor burden is importantly linked with microangiogenesis, wherein endothelial cells tend to overexpress VEGFR2 to induce their tumor cell-secreted, VEGF-based paracrine, or even autocrine proliferation. Moreover, various growth factors including VEGF are also independently linked to EMT, and they synergize the TGFβ-assisted EMT. Hence, it was important to check the expression status of VEGFR2. VEGFR2 is also the client protein of Hsp90. As we are also targeting Hsp90, it is obvious that some of its pro-proliferative client proteins including VEGFR2 expression should be affected. We find that VEGFR2 was observably downregulated in tumors of DXE-Hsp90-treated mice.
3.6. Antitumor Effect of DXE-amiR-Hsp90 in Aggressive Melanoma Model
3.6.1. DXE-Hsp90 Reduces Aggressive Melanoma while Enhancing Survivability in Mice
We have shown that DXE-Hsp90 has prominent antitumor effect in pancreatic cancer model. To check the versatility of DXE-Hsp90-mediated antitumor effect in other aggressive tumor model, we chose to develop a B16F10-melanoma cell-based subcutaneous allograft tumor in C57BL6 black mice. In this tumor model, the tumor size-increase accelerates with maximum aggressiveness as it reaches 2 weeks from initial inoculation. In this model, we segregated tumor-bearing mice in different treatment groups. These groups are (a) group treated with 5% glucose only (UT); (b) group treated with DXE lipoplex containing control β-gal plasmid (DXE-Cont); (c) group treated with DXE lipoplex containing amiR-Hsp90 plasmid (DXE-Hsp90); and finally, (d) group treated with DOE lipoplex containing amiR-Hsp90 plasmid (DOE-Hsp90). Intraperitoneal injection started when tumor size became ~100 mm3. As shown in Figure 5A, DXE-amiR-Hsp90-treated group exhibits tumors of least size and aggressiveness. Because of the presence of dexamethasone, even DXE-control plasmid-treated group also showed significantly reduced aggressiveness compared to untreated group or DOE-Hsp90 treatment group. The data shows that effective antitumor action of anticancer gene amiR-Hsp90 assumes significance only when it is associated with dexamethasone-carrying lipoplex (i.e., DXE). In a given scale of time (say, on the 21st day since cell-inoculation) when the tumor increases ~5 times in DXE-Hsp90-treated group, tumor increases, respectively, ~15 times for DXE-control treated, ~25 times for DOE-amiR-Hsp90-treated, and ~35 times (on 21st day) for untreated groups. This trend indicates that DXE-Hsp90 possesses best tumor-regressive property among the different treatment groups. The respective burden of representative tumors from each of the treatment groups indicates the extent of tumor-regression effect of individual treatments (Figure 5B). Clearly, among all treatment groups, DXE-Hsp90 has maximum antitumor effect.
Figure 5.

(A) Tumor regression curve after subcutaneous implantation of 2 × 10⁵ B16F10 cells in C57BL/6J mice followed by intraperitoneal injection with 5% glucose (UT), DXE-Hsp90, DXE-Cont, and DOE-Hsp90. All lipoplexes were formed with 40 μg of respective plasmid at 6:1 lipid/DNA charge ratio and were injected intraperitoneally from 11th day post-B16F10 injection. Total 6 injections were given every alternate day. DXE-Hsp90 (>500) represents treatment group where injection with DXE-Hsp90 lipoplex began when tumor size reached the volume of 500 mm3. The days of injections for the group DXE-Hsp90 (>500) is indicated by black triangle, whereas all remaining groups are represented by arrows. * denotes p < 0.05; **p < 0.01; ***p < 0.001 while comparing with DXE-Cont. (B) Representative B16F10 tumors from each group sacrificed on the respective days of their termination of treatment. (C) Kaplan–Meier survival curves of mice bearing B16F10 tumor treated with different treatment groups. (D) Western blot analysis of B16F10 tumor lysates: Differential expression of SNAI 1, ABCG2, E-cadherin, p53, Vimentin, and Hsp90 proteins are shown.
3.6.1.1. Regressive Effect of DXE-Hsp90 Is More Pronounced in Bigger Tumors
After about 2 weeks of initial inoculation of melanoma cells when this melanoma tumor becomes ~500 mm3 size, the tumor aggressiveness shows maximum acceleration. It becomes a big challenge to contain the aggressiveness at that stage, and most of the antitumor systems fail unless the tumor is treated at a much less aggressive stage. Hence, we further checked if in this situation DXE-Hsp90 had any significant aggressiveness-reducing effect on tumor or not. We opted not to include DXE-Cont group having tumor size greater than 500 mm3 (DXE-Cont > 500 mm3) as initial pilot study showed (data not shown) that DXE-Cont cannot hold the tumor growth below 500 mm3 even if injection was started with 100 mm3 tumor (after the first 3 injections, tumor of the DXE-Cont group started to cross the 500 mm3 mark). We find that DXE-Hsp90 exhibits better regressive effect on bigger tumor compared to what it shows for tumors of smaller size. We noticed that tumors of small size (~100 mm3) grew about 5–6.5-folds (~500–650 mm3) when treated with DXE-Hsp90 for the whole span of experiment. In this case, we injected 6 times. In comparison, tumors of bigger size (~500 mm3) when injected only 4 times (black arrows) grew only 2.4–2.6-fold (~1200–1300 mm3) (Figure 5A). It is known that tumor aggressiveness is associated with EMT transition. Hence, it is logical to extend that the factors involved in EMT transition will have maximum effect on tumor mass for its excessive aggressiveness. Our data shows that DXE-Hsp90 not only has significant antitumor effect by way of reducing tumor aggression but also this effect is more pronounced when the tumor aggressiveness is at its peak. This clearly indicates that DXE-Hsp90 may have resounding inhibitory effect on one or multiple EMT-inducing factors that are involved in tumor aggressiveness.
We also checked for relative survivability among the treated and untreated groups. We find that mice in DXE-Hsp90 treated group were all survived, whereas mice in untreated (UT) or DOE-Hsp90-treated group were all dead in the comparative scale of time (Figure 5C). The other DXE-lipoplex with control plasmid, i.e., DXE-Cont also had moderate survivability effect on mice. Taken together, DXE-Hsp90 was able to make tumor-bearing mice survive longer.
3.6.2. DXE-amiR-Hsp90 Induces Apoptosis in Tumor Mass
Next, to find possible reasons for significant antitumor effect of DXE-Hsp90, we performed Western blot analysis of tumor lysates obtained from different groups. We find prominent up-regulation of apoptosis-inducing protein p53 in all treated groups compared to that in untreated group. DXE-Hsp90 treated tumors showed highest expression of p53 (Figure 5D), indicating a possible reason for significant reduction in tumor aggression. We also find that only DXE-Hsp90 lipoplex system is able to down regulate Hsp90 protein in tumor mass; however, tumor mass in nontargeted DOE-Hsp90 lipoplex-treated mice do not show any Hsp90 down regulation.
3.6.3. DXE-Hsp90 Induces Prominent MET
To find what factors are regulated that has led to significant reduction in tumor aggression, more so when tumor size is bigger, we concentrate on various factors involved in both EMT and MET. In them, we find vimentin, a factor that up-regulates during EMT, is completely down-regulated in tumors of DXE-Hsp90 treated group (Figure 5D). It seems other treatment groups have no effect on vimentin. The surprisingly complete down-regulation of vimentin was neither due to individual treatment of amiR-Hsp90 treatment (as in DOE-Hsp90) nor dexamethasone-associated DXE treatment (as in DXE-Cont). A simultaneous concoction of both is needed to find this possible reason for EMT-reversal. We previously pointed out that p53 was up-regulated although unequally in tumors of other treated groups. Taken together we infer that the most efficient tumor-regressive effect of DXE-Hsp90 was simultaneously due to both, p53 up-regulation and complete down-regulation of vimentin. The down-regulation of vimentin indicates that cells in tumor mass are dedifferentiating back to nonaggressive and possibly more drug-sensitive phenotype.
3.6.4. DXE-Hsp90 Lipoplex Induces Apoptosis in Tumor Mass and Its Vasculature
We observed maximum tumor growth inhibitions by DXE-Hsp90 treated mice. We hypothesized that this could be because of potent induction of apoptosis in tumor mass and in its adjoining angiogenic blood vessels. To confirm this, respective tumor sections obtained from B16F10 melanoma model were examined for apoptotic tumor cells using green fluorescent TUNEL assay, and the same tumor sections were also immunostained with VE-cadherin (red fluorescent) to analyze the apoptotic effects on endothelial cells. Figure 6 clearly shows that tumor sections obtained from DXE-Hsp90 treated group have significantly higher densities of the TUNEL positive cells (~25% apoptotic cell) compared to the untreated and DOE-Hsp90 treated group (~7% apoptotic cell). Vascular endothelial cells of untreated and DOE-Hsp90 treated group tumor contained lesser number of apoptotic region (yellow region in the merged panel of Figure 6). Moreover, DXE-Hsp90 exhibited substantially higher amount of apoptotic region in the endothelial cells. Taken together, the data shows that higher amount of apoptotic effect both in tumor mass and its angiogenic vessel in DXE-Hsp90 treated group could have resulted in significant inhibition of tumor growth.
Figure 6.

(A) Microscopic pictures of 10 μm B16F10 tumor sections from UT (upper panel) group, DOE-Hsp90 (second panel from top), DXE-Cont (third panel from top), and DXE-Hsp90 (lower panel) treated groups. From left, the first column represents the tissue architecture in DAPI staining (DAPI); second column represents apoptotic region as obtained by TUNEL assay (green fluorescent); third column represents endothelial regions as stained by VE-cadherin (red fluorescent); and fourth column represents merger of second and third column from left representing simultaneous appearance of green and red fluorescent zones (if any). All images were taken at 10× magnification. Scale bars represent 100 μm. (B,C) Quantification of tunel-positive cells and VE-cadherin-positive cells, respectively. ** denotes p < 0.01 and * denotes p < 0.05.
3.6.5. Effect of Lipoplexes on Ki-67 Index of Tumor Tissue
The tumor growth inhibition experiment results showed huge tumor growth arrest with DXE-Hsp90 treated group in highly proliferative B16F10 tumor model, so we opted to check the population status of proliferative cells in the tumor tissue of DXE-Hsp90 treated group. Toward this, we examine the expression of Ki-67 protein, a well-known proliferative marker, in tumor section obtained from each treatment group. Figure 7 shows that UT and DOE-Hsp90 treatment groups’ tumors are highly populated with proliferative cells, which are almost more than 50% of the total cell population, thus supporting highest growths in UT and DOE-Hsp90 groups’ tumor (Figure 5A). However, DXE-Cont and DXE-Hsp90 treated tumor sections show lesser number of Ki-67 positive cells; hence, these two groups are able to show more tumor growth inhibition (Figure 5A). However, when we compare the effect between DXE-Cont and DXE-Hsp90, we find that tumors in DXE-Hsp90-treated group possess significantly lesser number of Ki-67 positive cells compared to DXE-Cont group (p < 0.05), thereby justifying the additional use of anti-Hsp90 plasmid. Overall, the result obtained from this proliferative cell population measurement through Ki-67 labeling experiment well corroborated with the tumor growth inhibition study.
Figure 7.

(A) Immunohistochemical studies of 10 μm thick B16F10 tumor cryosections from UT (upper panel), DOE-Hsp90 (second from top), DXE-Cont (third from top), and DXE-Hsp90 (lower panel). From left, first column exhibits tissue after DAPI staining (DAPI); second column shows the expression levels of Ki-67 positive cells in tumor sections (red fluorescent); third column represents the merged image of first and second columns from left. All images were taken at 10× magnification. Scale bars represent 100 μm. (B) Quantification of Ki-67 index in the tumor tissue. ** denotes p < 0.01 while comparing with the UT group.
Vascular endothelial growth factor receptor 2 (VEGFR2) is one of the important regulators of angiogenesis and its overexpression in the angiogenic endothelial cells has been associated with tumor progression and poor prognosis in patients of solid tumors. Logically, tumor progression can be halted by down-regulating VEGFR2 levels in tumor mass. Also, since VEGFR2 is the client protein of Hsp90, it is a natural target for our anti-Hsp90 lipoplex system. Toward confirming the effect of targeted lipoplex systems on VEGFR2, tumor cryosections were immunostained with VE-cadherin (endothelial cell marker, red fluorescent) and VEGFR2 antibody (green fluorescent). Figure S5 represents the semiquantitative representation of the cellular expression of VEGFR2 over VE-cadherin positive endothelial cells in tumors. The data shows that the ratio of VEGFR2/VE-cadherin positive cells in UT and DOE-Hsp90 treated tumor were significantly more compared to other treatment groups. In DXE-Hsp90 treated group one can see significantly lower (p < 0.05) ratio of VEGFR2/VE-cadherin than that in DXE-Cont treated group. Thus, the effect of anti-Hsp90 treatment appears to show antitumor effect. In overall, the findings from these immunostained tumor images are consistent with the tumor growth inhibition property of the DXE-Hsp90 lipoplex treated groups.
3.7. DXE-amiR-Hsp90-Mediated MET Transition Is GR-Dependent
It is now clear that the complete concoction of DXE-Hsp90 has maximum effect against tumor progression. One of the reasons is due to the most effective down-regulation of EMT factor, vimentin, in tumor mass. Either DXE-Cont or DOE-Hsp90 has minimal effect on vimentin expression. So, one can hypothesize that the presence of glucocorticoid receptor in tumor cells, where this EMT reversal is observed, may have an important role. To elucidate the role of GR in tumor mass during this EMT reversal, we isolated tumor cells from fresh tumor mass of sacrificed mice. The tumor cells were first grouped in two sets of experiments. In one group, cells were treated with GR-siRNA and in other group cells were treated with scrambled siRNA (i.e., control siRNA). After these respective treatments, cells in both groups were treated with the following: dexamethasone (Dex); DX liposome; DX lipoplex with control plasmid (DX-Cont); DX lipoplex with amiR-Hsp90 plasmid (DX-Hsp90); DO lipoplex with amiR-Hsp90 plasmid (DO-Hsp90). We avoided using DXE, as the formulation was very toxic for these cancer cells to determine any effect. We find that in scrambled SiRNA (Sc-SiRNA)-treated set there were significantly more down-regulations of vimentin in all DX-treated groups, i.e., DX, DX-Cont, and DX-Hsp90 (Figure 8). However, there were significant levels of E-cadherin up-regulation among pristine Dex and DX-treated groups. Prominently, DO-Hsp90 has no specific effect on the expression of either vimentin or E-cadherin. It seems dexamethasone in only liposome or lipoplex form has vimentin down-regulatory effect, but dexamethasone in all forms has E-cadherin up-regulatory effect. However, in GR-siRNA treated set, where GR was clearly down-regulated there were no appreciable changes neither in vimentin nor in E-cadherin protein expressions for all treatments. We observed some decrease in vimentin levels following DX-based treatments as it could be attributed to incomplete knock down of GR. This proves that the expression of GR is necessary to induce DXE-Hsp90-mediated EMT-reversal.
Figure 8.

(A) GR expression levels in B16F10 cells, either untreated (UT) or treated with GR siRNA (40 pmol) (GR siRNA) or treated with scrambled siRNA (40 pmol) (Scrambled siRNA) for 72 h. (B) E-Cadherin and vimentin protein expression levels in cellular lysates of GR siRNA and scrambled siRNA-treated B16F10 cells after treatment with indicated treatment groups.
4. DISCUSSION
The key to the current study lies in two of our earlier studies wherein we for the first time showed that GR, a ubiquitously expressed cytoplasmic protein, is an active target for cancer. In these studies we discovered a specific cancer cell related unique phenomenon. We found that in only cancer cells liposomal-Dex (i.e., DX) or Dex-gold nanoparticle conjugate (i.e., Dex-GNP) could trigger many folds higher transcription or expression of glucocorticoid responsive genes than what pristine Dex-treatment could do.32,33 The therapeutic implication of this observation was not apprehended until we designed this study. For this study we chose to use a newly developed anticancer gene, an anti-miRNA construct against Hsp90, which upon DX-mediated delivery selectively down-regulated Hsp90 and its client proteins implicated with cancer.21 Others have recently shown that pristine Dex treatment in cancer cells could trigger enhanced transcription of gluconeogenesis-associated genes with simultaneous induction of limited drug-sensitization in cancer cells.38 Dex is known to work against hormone refractory cancer.39 Importantly, Dex is commonly cotreated with anticancer drugs to alleviate various side effects of the genotoxic drugs treated to patients.40,41 In contrast, with repeated use Dex enhances drug resistivity and apoptosis resistance in tumor-models, sometimes by blunting p53-dependent cellular senescence.42,43 Overall, it is clear that usefulness of pristine Dex for cancer treatment yielded mixed results and holds a confusing role in human cancer pathology. Hence, the pharmacological use of Dex, as in pristine form or in formulation, needs a cautious and judicious approach. The present study displayed a new way of utilizing Dex in a cationic lipid-based delivery formulation, which exhibited consistent antitumor effects. This Dex-associated delivery formulation (DXE) is formed by coformulating an anticancer molecule ESC8 with Dex in a cationic lipid [DODEAC] and colipid (here, cholesterol) concoction. ESC8, although a very potent anticancer molecule against triple negative and estrogen responsive breast cancer cells,34 exhibits very limited toxicity against pancreatic cancer cells. Hence, we hypothesized that if Dex-associated formulations (DXE or DX) could enhance drug sensitivity of the coformulated drug, it might induce more anticancer effect than when it would be in pristine form. We indeed find that the Dex formulation (DX) is able to induce drug sensitivity in pancreatic cancer cells against not only hydrophobic drug (such as ESC8) but also against hydrophilic drug, gemcitabin, and doxorubicin. Additionally, inconsistent with previous reports regarding Dex, this Dex-formulation (DXE) rather up-regulated p53 levels and apoptotic lesions in tumor mass, thereby indicating the apoptosis-inducing effect of DXE formulation. One of the cytokines, i.e., transforming growth factor β (TGF-β) multifunctionally regulates various tumor-related pathogenesis such as differentiation, proliferation, migration, and apoptosis and promotes tumor metastasis and invasion through potent induction of EMT.44,45 TGF-β regulates the expression of zinc-finger transcription factor SNAI-1 (or Snail) that represses the E-cadherin expression, and thus, EMT gets promoted.46–49 Our data however indicates that the Dex-associated formulation (DX) triggers EMT reversal in pancreatic cancer cells by down-regulating not only SNAI-1 but also down-regulating another factor called inhibition-of-differentiation 1 (ID-1). EMT reversal is evident from potent up-regulation of E-cadherin. For EMT reversal, a reversal of differentiation is expected. Cancer cells with EMT and high aggressiveness tend to resist dedifferentiation by expressing high level of ID-1. Reinitiation or relapsing of tumor involves among other factors the mediation of various ID genes.50–52 Our data shows that in pancreatic cancer cells ID-1 protein is conveniently down-regulated with DX formulation complexed with or without amiR-Hsp90 plasmid. Free Dex exhibited mixed effect on ID-1 expression in two different pancreatic cancer cells; however, DX was consistent in its role toward ID-1 down-regulation. The control liposomal formulation DO (i.e., one without Dex) complexed with amiR-Hsp90, however, also down-regulated ID-1, indicating that ID-1, although not a client protein of Hsp90, may have been indirectly regulated by Hsp90. Further, the formulation for tumor studies (i.e., DXE) is consistent in its antitumor activity against the tested in vivo mice models, orthotopic pancreatic cancer and subcutaneous melanoma. The orthotopic AsPC-1 pancreatic cancer model in mice is very aggressive and metastatic in nature, and after secondary manifestations, it takes 3 weeks to show signs of mortality in tumor-bearing untreated mice. After observing this, we chose to end the animal experiment. Isolated pancreatic tumors from sacrificed mice revealed that DXE-Hsp90 exhibited maximum anticancer effect, leaving the tumors in the group with least size. Lysates from tumor sections corroborated the fact that a possible EMT reversal did happen, as we found that E-cadherin level was typically increased in the tumors of DXE-Hsp90 group. In melanoma model, we find down-regulation of EMT marker vimentin. We additionally find that when the tumors are considerably big (>500 mm3), i.e., when they are at their highest aggression, the antitumor effect of DXE-Hsp90 is maximal. This shows that formulation could possibly trigger the reversal of EMT, which maximizes during the tumor aggression. We believe as the EMT reversal is accompanied by decrease in ABCG2 levels, drug-sensitization of cancer cells is naturally increased. This could have resulted in effective tumor-regression. Clearly, the DX-mediated EMT-reversal as witnessed by decrease in vimentin level was particularly observable with presence of intact GR. Although Dex is known to induce MET,53 incidentally, at the given condition free Dex has least effect on vimentin level indicating that the formulated Dex is more potent in inducing EMT reversal. Gluconeogenesis is triggered by GR-mediated gene expressions through glucocorticoid response elements (GRE). We have previously shown that compared to free Dex, formulated Dex such as DX or Dex-GNP could trigger multiple-fold higher regulation of GRE-responsive genes in cancer cells.31,33 We have recently shown the in vivo utility of this proof-of-concept of using DXE lipoplex carrying another type of anticancer gene such as, antineuropilin shRNA plasmid as a cargo, for eliciting effective tumor growth regression in a tumor model of severely drug-resistant breast cancer stem cell-like cells.54 However, induction of drug-sensitivity and reversal of EMT could not be established clearly, especially with respect to the indulgence of GR. The observations as reported herein clearly indicate that cancer cell-associated GR can be selectively manipulated with these special formulations. Serendipitously, these formulations can trigger GRE-genes many folds more than what pristine Dex can achieve. We believe in this way one can trigger higher level of gluconeogenesis, which is not preferred by most stages of cancer cells. Gluconeogenesis will require lactic acid and pyruvic acid as its substrate. One can hypothesize that gradual decrease of these substrates in tumor microenvironment will lessen the increased burden of acidosis-resistant factors such as p-glycoproteins of various kinds such as ABCG2, etc. As a result the expression of these drug resistant factors will be decreased leaving the tumor sensitive to anticancer drugs. The formulation is simultaneously doing the same thing, in one hand reducing EMT and increasing drug sensitivity in tumor and in other hand carrying the drug to treat the tumor. Experiments deciphering the link (if any) between gluconeogenesis-induction with drug-sensitization are currently underway in our laboratory. Further, using the current formulation strategy as a platform technology we are now exploring the possibility of reusing various other classes of potent anticancer molecules, which experience resistance in aggressive cancers.
Acknowledgments
S.K.M. and S.J. thank Council of Scientific and Industrial Research (CSIR), Government of India, New Delhi for their doctoral research fellowships. R.B. acknowledges financial assistance from CSIR, Govt. of India through CSIR-Mayo Clinic partnership project funds [CMPP003] and CSIR Network projects [BSC0123, CSC0302]. This work is partially supported by National Institute of Health (NIH) grant CA150190 (DM). A.A. and K.M.A. would like to thank National Plan for Science, Technology and Innovation (MAARIFAH), King Abdulaziz City for Science and Technology, Kingdom of Saudi Arabia, Award Number (12-MED2897-02).
Footnotes
The authors declare no competing financial interest.
Supporting Information
The Supporting Information is available free of charge on the ACS Publications website at DOI: 10.1021/acs.molpharmaceut.6b00230.
Methods for size and charge characterization and histological studies. Tabulated data for size, charge and PDI characterization of lipoplexes in presence and absence of serum. Viability data of other pancreatic cancer cells. Hsp90 and ABCG2 m-RNA expressions in treated AsPC-1 cells. ABCG2 and ID-1 protein expression in treated PANC-1 cells. Effect of hydrophobic and hydrophilic drugs on nontargeted lipoplex-treated melanoma cells. Histological study of VEGFR2 expression levels in melanoma tumors (PDF)
References
- 1.Rhim AD, Mirek ET, Aiello NM, Maitra A, Bailey JM, McAllister F, Reichert M, Beatty GL, Rustgi AK, Vonderheide RH, Leach SD, Stanger BZ. EMT and dissemination precede pancreatic tumor formation. Cell. 2012;148(1–2):349–361. doi: 10.1016/j.cell.2011.11.025. [DOI] [PMC free article] [PubMed] [Google Scholar]
- 2.Sarkar FH, Li Y, Wang Z, Kong D. Pancreatic cancer stem cells and EMT in drug resistance and metastasis. Minerva Chir. 2009;64(5):489–500. [PMC free article] [PubMed] [Google Scholar]
- 3.Li C, Lee CJ, Simeone DM. Identification of human pancreatic cancer stem cells. Methods Mol Biol. 2009;568:161–173. doi: 10.1007/978-1-59745-280-9_10. [DOI] [PubMed] [Google Scholar]
- 4.Hermann PC, Huber SL, Herrler T, Aicher A, Ellwart JW, Guba M, Bruns CJ, Heeschen C. Distinct populations of cancer stem cells determine tumor growth and metastatic activity in human pancreatic cancer. Cell Stem Cell. 2007;1(3):313–323. doi: 10.1016/j.stem.2007.06.002. [DOI] [PubMed] [Google Scholar]
- 5.Bao S, Wu Q, McLendon RE, Hao Y, Shi Q, Hjelmeland AB, Dewhirst MW, Bigner DD, Rich JN. Glioma stem cells promote radioresistance by preferential activation of the DNA damage response. Nature. 2006;444(7120):756–760. doi: 10.1038/nature05236. [DOI] [PubMed] [Google Scholar]
- 6.Li X, Lewis MT, Huang J, Gutierrez C, Osborne CK, Wu MF, Hilsenbeck SG, Pavlick A, Zhang X, Chamness GC, Wong H, Rosen J, Chang JC. Intrinsic resistance of tumorigenic breast cancer cells to chemotherapy. J Natl Cancer Inst. 2008;100(9):672–679. doi: 10.1093/jnci/djn123. [DOI] [PubMed] [Google Scholar]
- 7.Christiansen JJ, Rajasekaran AK. Reassessing epithelial to mesenchymal transition as a prerequisite for carcinoma invasion and metastasis. Cancer Res. 2006;66(17):8319–8326. doi: 10.1158/0008-5472.CAN-06-0410. [DOI] [PubMed] [Google Scholar]
- 8.Moreno-Bueno G, Portillo F, Cano A. Transcriptional regulation of cell polarity in EMT and cancer. Oncogene. 2008;27(55):6958–6969. doi: 10.1038/onc.2008.346. [DOI] [PubMed] [Google Scholar]
- 9.Stemmer V, de Craene B, Berx G, Behrens J. Snail promotes Wnt target gene expression and interacts with beta-catenin. Oncogene. 2008;27(37):5075–5080. doi: 10.1038/onc.2008.140. [DOI] [PubMed] [Google Scholar]
- 10.Yang MH, Hsu DS, Wang HW, Wang HJ, Lan HY, Yang WH, Huang CH, Kao SY, Tzeng CH, Tai SK, Chang SY, Lee OK, Wu KJ. Bmi1 is essential in Twist1-induced epithelial-mesenchymal transition. Nat Cell Biol. 2010;12(10):982– 992. doi: 10.1038/ncb2099. [DOI] [PubMed] [Google Scholar]
- 11.Li Y, VandenBoom TG, 2nd, Kong D, Wang Z, Ali S, Philip PA, Sarkar FH. Up-regulation of miR-200 and let-7 by natural agents leads to the reversal of epithelial-to-mesenchymal transition in gemcitabine-resistant pancreatic cancer cells. Cancer Res. 2009;69(16):6704–6712. doi: 10.1158/0008-5472.CAN-09-1298. [DOI] [PMC free article] [PubMed] [Google Scholar]
- 12.Fuchs BC, Fujii T, Dorfman JD, Goodwin JM, Zhu AX, Lanuti M, Tanabe KK. Epithelial-to-mesenchymal transition and integrin-linked kinase mediate sensitivity to epidermal growth factor receptor inhibition in human hepatoma cells. Cancer Res. 2008;68(7):2391–2399. doi: 10.1158/0008-5472.CAN-07-2460. [DOI] [PubMed] [Google Scholar]
- 13.Arumugam T, Ramachandran V, Fournier KF, Wang H, Marquis L, Abbruzzese JL, Gallick GE, Logsdon CD, McConkey DJ, Choi W. Epithelial to mesenchymal transition contributes to drug resistance in pancreatic cancer. Cancer Res. 2009;69(14):5820–5828. doi: 10.1158/0008-5472.CAN-08-2819. [DOI] [PMC free article] [PubMed] [Google Scholar]
- 14.Gatenby RA, Gillies RJ. Why do cancers have high aerobic glycolysis? Nat Rev Cancer. 2004;4(11):891–899. doi: 10.1038/nrc1478. [DOI] [PubMed] [Google Scholar]
- 15.Thews O, Nowak M, Sauvant C, Gekle M. Hypoxia-induced extracellular acidosis increases p-glycoprotein activity and chemoresistance in tumors in vivo via p38 signaling pathway. Adv Exp Med Biol. 2011;701:115–122. doi: 10.1007/978-1-4419-7756-4_16. [DOI] [PubMed] [Google Scholar]
- 16.Sauvant C, Nowak M, Wirth C, Schneider B, Riemann A, Gekle M, Thews O. Acidosis induces multi-drug resistance in rat prostate cancer cells (AT1) in vitro and in vivo by increasing the activity of the p-glycoprotein via activation of p38. Int J Cancer. 2008;123(11):2532–2542. doi: 10.1002/ijc.23818. [DOI] [PubMed] [Google Scholar]
- 17.Raghunand N, Gillies RJ. pH and drug resistance in tumors. Drug Resist Updates. 2000;3(1):39–47. doi: 10.1054/drup.2000.0119. [DOI] [PubMed] [Google Scholar]
- 18.DeClerck K, Elble RC. The role of hypoxia and acidosis in promoting metastasis and resistance to chemotherapy. Front Biosci Landmark Ed. 2010;15:213–225. doi: 10.2741/3616. [DOI] [PubMed] [Google Scholar]
- 19.Wojtkowiak JW, Verduzco D, Schramm KJ, Gillies RJ. Drug resistance and cellular adaptation to tumor acidic pH microenvironment. Mol Pharmaceutics. 2011;8(6):2032–2038. doi: 10.1021/mp200292c. [DOI] [PMC free article] [PubMed] [Google Scholar]
- 20.Ferrarini M, Heltai S, Zocchi MR, Rugarli C. Unusual expression and localization of heat-shock proteins in human tumor cells. Int J Cancer. 1992;51(4):613–619. doi: 10.1002/ijc.2910510418. [DOI] [PubMed] [Google Scholar]
- 21.Ciocca DR, Calderwood SK. Heat shock proteins in cancer: diagnostic, prognostic, predictive, and treatment implications. Cell Stress Chaperones. 2005;10(2):86–103. doi: 10.1379/CSC-99r.1. [DOI] [PMC free article] [PubMed] [Google Scholar]
- 22.Gress TM, Müller-Pillasch F, Weber C, Lerch MM, Friess H, Buüchler M, Beger HG, Adler G. Differential expression of heat shock proteins in pancreatic carcinoma. Cancer Res. 1994;54(2):547–551. [PubMed] [Google Scholar]
- 23.Neckers L. Hsp90 inhibitors as novel cancer chemotherapeutic agents. Trends Mol Med. 2002;8(4):S55–61. doi: 10.1016/s1471-4914(02)02316-x. [DOI] [PubMed] [Google Scholar]
- 24.Sharp S, Workman P. Inhibitors of the HSP90 molecular chaperone: current status. Adv Cancer Res. 2006;95:323–348. doi: 10.1016/S0065-230X(06)95009-X. [DOI] [PubMed] [Google Scholar]
- 25.Neckers L, Neckers K. Heat-shock protein 90 inhibitors as novel cancer chemotherapeutic agents. Expert Opin Emerging Drugs. 2002;7(2):277–288. doi: 10.1517/14728214.7.2.277. [DOI] [PubMed] [Google Scholar]
- 26.Heath EI, Hillman DW, Vaishampayan U, Sheng S, Sarkar F, Harper F, Gaskins M, Pitot HC, Tan W, Ivy SP, Pili R, Carducci MA, Erlichman C, Liu G. A phase II trial of 17-allylamino-17-demethoxygeldanamycin in patients with hormone-refractory metastatic prostate cancer. Clin Cancer Res. 2008;14(23):7940–7946. doi: 10.1158/1078-0432.CCR-08-0221. [DOI] [PMC free article] [PubMed] [Google Scholar]
- 27.Radujkovic A, Schad M, Topaly J, Veldwijk MR, Laufs S, Schultheis BS, Jauch A, Melo JV, Fruehauf S, Zeller WJ. Synergistic activity of imatinib and 17-AAG in imatinib-resistant CML cells overexpressing BCR-ABL–Inhibition of P-glycoprotein function by 17-AAG. Leukemia. 2005;19(7):1198–1206. doi: 10.1038/sj.leu.2403764. [DOI] [PubMed] [Google Scholar]
- 28.Roh JL, Kim EH, Park HB, Park JY. The Hsp90 inhibitor 17-(allylamino)-17-demethoxygeldanamycin increases cisplatin antitumor activity by inducing p53-mediated apoptosis in head and neck cancer. Cell Death Dis. 2013;4:e956. doi: 10.1038/cddis.2013.488. [DOI] [PMC free article] [PubMed] [Google Scholar]
- 29.Sain N, Krishnan B, Ormerod MG, De Rienzo A, Liu WM, Kaye SB, Workman P, Jackman AL. Potentiation of paclitaxel activity by the HSP90 inhibitor 17-allylamino-17-demethoxygeldanamycin in human ovarian carcinoma cell lines with high levels of activated AKT. Mol Cancer Ther. 2006;5(5):1197–1208. doi: 10.1158/1535-7163.MCT-05-0445. [DOI] [PubMed] [Google Scholar]
- 30.Sauvage F, Franzè S, Bruneau A, Alami M, Denis S, Nicolas V, Lesieur S, Legrand FX, Barratt G, Messaoudi S, Vergnaud-Gauduchon J. Formulation and in vitro efficacy of liposomes containing the Hsp90 inhibitor 6BrCaQ in prostate cancer cells. Int J Pharm. 2016;499(1–2):101–119. doi: 10.1016/j.ijpharm.2015.12.053. [DOI] [PubMed] [Google Scholar]
- 31.Mukherjee A, Narayan KP, Pal K, Kumar JM, Rangaraj N, Kalivendi SV, Banerjee R. Selective cancer targeting via aberrant behavior of cancer cell-associated glucocorticoid receptor. Mol Ther. 2009;17(4):623–631. doi: 10.1038/mt.2009.4. [DOI] [PMC free article] [PubMed] [Google Scholar]
- 32.Pore SK, Choudhary A, Rathore B, Ganguly A, Sujitha P, Kumar CG, Agawane SB, Kumar JM, Scaria V, Pillai B, Banerjee R. Hsp90-targeted miRNA-liposomal formulation for systemic antitumor effect. Biomaterials. 2013;34(28):6804–6817. doi: 10.1016/j.biomaterials.2013.05.054. [DOI] [PubMed] [Google Scholar]
- 33.Sau S, Agarwalla P, Mukherjee S, Bag I, Sreedhar B, Pal-Bhadra M, Patra CR, Banerjee R. Cancer cell-selective promoter recognition accompanies antitumor effect by glucocorticoid receptor-targeted gold nanoparticle. Nanoscale. 2014;6(12):6745–6754. doi: 10.1039/c4nr00974f. [DOI] [PubMed] [Google Scholar]
- 34.Sinha S, Roy S, Reddy BS, Pal K, Sudhakar G, Iyer S, Dutta S, Wang E, Vohra PK, Roy KR, Reddanna P, Mukhopadhyay D, Banerjee R. A lipid-modified estrogen derivative that treats breast cancer independent of estrogen receptor expression through simultaneous induction of autophagy and apoptosis. Mol Cancer Res. 2011;9(3):364–374. doi: 10.1158/1541-7786.MCR-10-0526. [DOI] [PMC free article] [PubMed] [Google Scholar]
- 35.Andey T, Sudhakar G, Marepally S, Patel A, Banerjee R, Singh M. Lipid nanocarriers of a lipid-conjugated estrogenic derivative inhibit tumor growth and enhance cisplatin activity against triple-negative breast cancer: pharmacokinetic and efficacy evaluation. Mol Pharmaceutics. 2015;12(4):1105–1120. doi: 10.1021/mp5008629. [DOI] [PubMed] [Google Scholar]
- 36.Sudhakar G, Bathula SR, Banerjee R. Development of new estradiol-cationic lipid hybrids: ten-carbon twin chain cationic lipid is a more suitable partner for estradiol to elicit better anticancer activity. Eur J Med Chem. 2014;86:653–363. doi: 10.1016/j.ejmech.2014.09.030. [DOI] [PubMed] [Google Scholar]
- 37.Honorat M, Mesnier A, Di Pietro A, Lin V, Cohen P, Dumontet C, Payen L. Dexamethasone down-regulates ABCG2 expression levels in breast cancer cells. Biochem Biophys Res Commun. 2008;375(3):308–314. doi: 10.1016/j.bbrc.2008.07.149. [DOI] [PubMed] [Google Scholar]
- 38.Ma R, Zhang W, Tang K, Zhang H, Zhang Y, Li D, Li Y, Xu P, Luo S, Cai W, Ji T, Katirai F, Ye D, Huang B. Switch of glycolysis to gluconeogenesis by dexamethasone for treatment of hepatocarcinoma. Nat Commun. 2013;4:2508. doi: 10.1038/ncomms3508. [DOI] [PubMed] [Google Scholar]
- 39.Nishimura K, Nonomura N, Satoh E, Harada Y, Nakayama M, Tokizane T, Fukui T, Ono Y, Inoue H, Shin M, Tsujimoto Y, Takayama H, Aozasa K, Okuyama A. Potential mechanism for the effects of dexamethasone on growth of androgen-independent prostate cancer. J Natl Cancer Inst. 2001;93(22):1739–1746. doi: 10.1093/jnci/93.22.1739. [DOI] [PubMed] [Google Scholar]
- 40.Hesketh PJ, Altamira PS. Aprepitant, dexamethasone, and palonosetron in the prevention of doxorubicin/cyclophosphamide-induced nausea and vomiting. Support Care Cancer. 2012;20(3):653– 656. doi: 10.1007/s00520-011-1312-8. [DOI] [PubMed] [Google Scholar]
- 41.Warr D. Standard treatment of chemotherapy-induced emesis. Support Care Cancer. 1997;5(1):12–16. doi: 10.1007/BF01681956. [DOI] [PubMed] [Google Scholar]
- 42.Herr I, Ucur E, Herzer K, Okouoyo S, Ridder R, Krammer PH, von Knebel Doeberitz M, Debatin KM. Glucocorticoid cotreatment induces apoptosis resistance toward cancer therapy in carcinomas. Cancer Res. 2003;63(12):3112–3120. [PubMed] [Google Scholar]
- 43.Ge H, Ni S, Wang X, Xu N, Liu Y, Wang X, Wang L, Song D, Song Y, Bai C. Dexamethasone reduces sensitivity to cisplatin by blunting p53-dependent cellular senescence in non-small cell lung cancer. PLoS One. 2012;7(12):e51821. doi: 10.1371/journal.pone.0051821. [DOI] [PMC free article] [PubMed] [Google Scholar]
- 44.Massagué J, Wotton D. Transcriptional control by the TGF-beta/Smad signaling system. EMBO J. 2000;19(8):1745–1754. doi: 10.1093/emboj/19.8.1745. [DOI] [PMC free article] [PubMed] [Google Scholar]
- 45.Ikushima H, Miyazono K. TGF-beta signalling: a complex web in cancer progression. Nat Rev Cancer. 2010;10(6):415–424. doi: 10.1038/nrc2853. [DOI] [PubMed] [Google Scholar]
- 46.Nieto MA. The snail superfamily of zinc-finger transcription factors. Nat Rev Mol Cell Biol. 2002;3(3):155–166. doi: 10.1038/nrm757. [DOI] [PubMed] [Google Scholar]
- 47.Cano A, Pérez-Moreno MA, Rodrigo I, Locascio A, Blanco MJ, del Barrio MG, Portillo F, Nieto MA. The transcription factor snail controls epithelial-mesenchymal transitions by repressing E-cadherin expression. Nat Cell Biol. 2000;2(2):76– 83. doi: 10.1038/35000025. [DOI] [PubMed] [Google Scholar]
- 48.Batlle E, Sancho E, Francí C, Domínguez D, Monfar M, Baulida J, García De Herreros A. The transcription factor snail is a repressor of E-cadherin gene expression in epithelial tumour cells. Nat Cell Biol. 2000;2(2):84–89. doi: 10.1038/35000034. [DOI] [PubMed] [Google Scholar]
- 49.Cano A, Portillo F. An emerging role for class I bHLH E2–2 proteins in EMT regulation and tumor progression. Cell Adh Migr. 2010;4(1):56–60. doi: 10.4161/cam.4.1.9995. [DOI] [PMC free article] [PubMed] [Google Scholar]
- 50.Gupta GP, Perk J, Acharyya S, de Candia P, Mittal V, Todorova-Manova K, Gerald WL, Brogi E, Benezra R, Massagué J. ID genes mediate tumor reinitiation during breast cancer lung metastasis. Proc Natl Acad Sci U S A. 2007;104(49):19506– 19511. doi: 10.1073/pnas.0709185104. [DOI] [PMC free article] [PubMed] [Google Scholar]
- 51.Schindl M, Oberhuber G, Obermair A, Schoppmann SF, Karner B, Birner P. Overexpression of Id-1 protein is a marker for unfavorable prognosis in early-stage cervical cancer. Cancer Res. 2001;61(15):5703–5706. [PubMed] [Google Scholar]
- 52.Schindl M, Schoppmann SF, Ströbel T, Heinzl H, Leisser C, Horvat R, Birner P. Level of Id-1 protein expression correlates with poor differentiation, enhanced malignant potential, and more aggressive clinical behavior of epithelial ovarian tumors. Clin Cancer Res. 2003;9(2):779–785. [PubMed] [Google Scholar]
- 53.Zhang L, Lei W, Wang X, Tang Y, Song J. Glucocorticoid induces mesenchymal-to-epithelial transition and inhibits TGF-β1-induced epithelial-to-mesenchymal transition and cell migration. FEBS Lett. 2010;584(22):4646–4654. doi: 10.1016/j.febslet.2010.10.038. [DOI] [PubMed] [Google Scholar]
- 54.Ahmad A, Mondal SK, Mukhopadhyay D, Banerjee R, Alkharfy KM. Development of Liposomal Formulation for Delivering Anticancer Drug to Breast Cancer Stem-Cell-Like Cells and its Pharmacokinetics in an Animal Model. Mol Pharmaceutics. 2016;13(3):1081–1088. doi: 10.1021/acs.molpharmaceut.5b00900. [DOI] [PubMed] [Google Scholar]