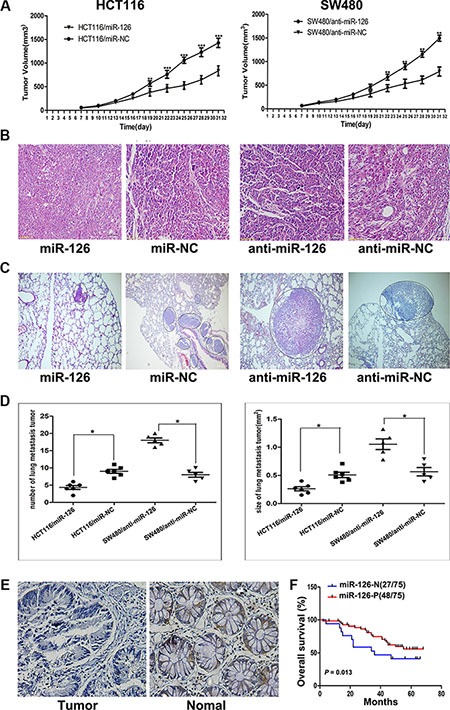
Figure 1. miR-126 inhibits colon cancer progression.

(A) Tumor volume was measured 1 week after injection and every 3 d thereafter. The average tumor volume for HCT116/miR-126 was smaller than that of the control (HCT116/miR-NC; left panel; n = 5, p < 0.01, ANOVA), whereas the average tumor volume for SW480/anti-miR-126 was larger than that of the control (SW480/anti-miR-NC; right panel; n = 5, p < 0.01, ANOVA), **p < 0.01, ***p < 0.001. (B) Representative hematoxylin/eosin-stained images of subcutaneous tumors from mice that had been injected with transfected HCT116 or transfected SW480 cells (200×). (C) Representative hematoxylin/eosin-stained images of lung tissue sections from mice that had been injected with transfected HCT116 (left panel) or transfected SW480 cells (right panel). Black circles identify metastatic foci (200×). (D) Scatter diagrams depicting the average number (left panel) and size (right panel) of metastatic nodules in 4–5 microscope fields for each type of transfected cells, *p < 0.05. (E) A decrease in miR-126 was detected in microarrays of colon cancer tissues compared with that detected in normal colonic mucosa as shown by in situ hybridization (200×). (F) Kaplan-Meier survival curves for patients with different levels of miR-126 expression in their colon tumors. Red line: patients whose tissues expressed miR-126 (48/75 patients); blue line, patients whose tissues did not express miR-126 (27/75 patients). p = 0.013. MiR-126-N: miR-126 negative expression; miR-126-P: miR-126 positive expression.
