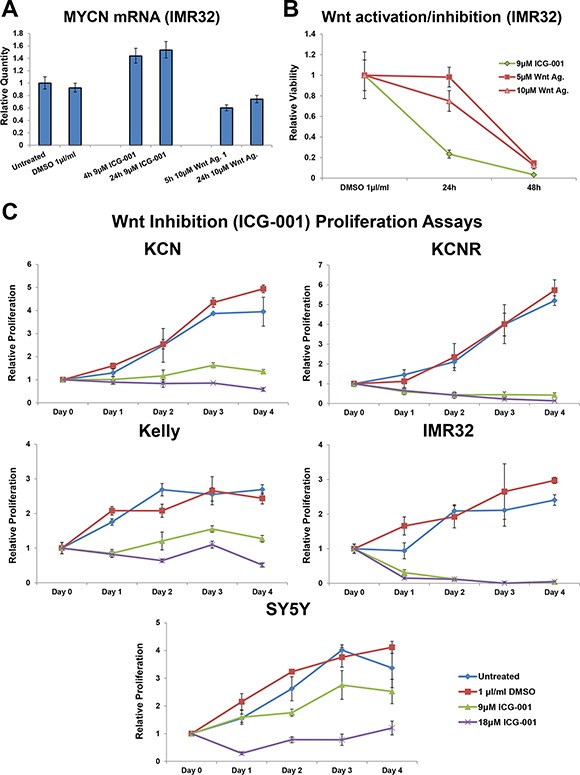
Figure 2. Varying dynamic response to small molecule Wnt activation/inhibition.

(A) Relative expression level of MYCN mRNA in IMR32 cells upon treatment with ICG-001 or Wnt agonist 1, as determined by qPCR. (B) Temporal profile of viability loss upon Wnt activation (Wnt agonist 1) and inhibition (ICG-001), as measured by MTS assay and relative to control cells. (C) Proliferation in response to four day Wnt inhibition (ICG-001) in MYCN amplified KCN, KCNR, Kelly and MYCN single copy SY5Y cells, as measured by MTS assay. Proliferation is relative to the corresponding Day 0 (pre-treatment) cells.
