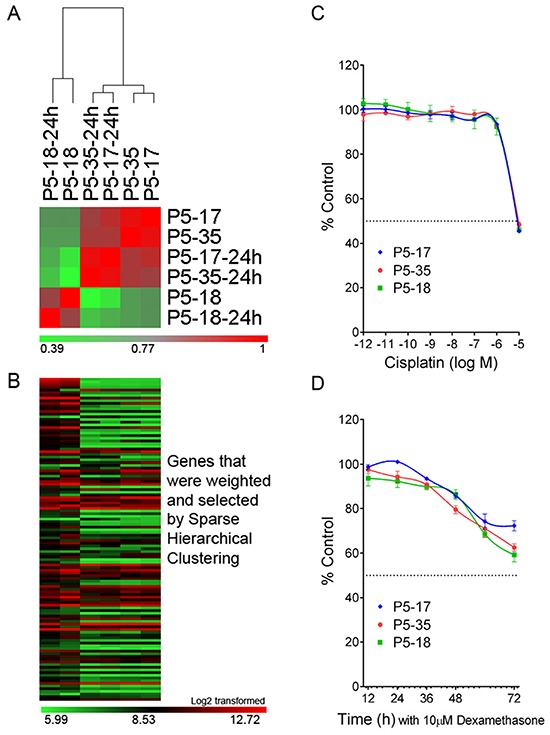
Figure 5. Gene expression analysis and cytotoxicity assays on the SNP-discrepant ALL-19 PDXs.

A. Correlation analysis on ALL-19 PDXs, including 2 validated (P5-17 and P5-35) and 1 contaminated (P5-18) sample. “-24h” refers to PDXs incubated in QBSF 60/F in vitro for 24 h. The color legend represents the correlation coefficient R value calculated based on the gene expression profiles from microarray study. B. Heatmap of GEPs generated by Sparse Hierarchical clustering. The details of the genes in the heatmap are provided in Supplementary Table S3. C. The 3 PDXs (1 contaminated and 2 validated) were treated with increasing concentrations of Cisplatin, and viability was assessed by Alamar Blue assay after 48 h incubation. D. Time course study of Dexamethasone cytotoxicity on the 3 PDXs (1 contaminated and 2 validated) and viability assessed by 7-AAD exclusion using flow cytometry. Values are expressed as a percentage of the untreated control. Data represent Mean + SEM for N = 3 experiments.
